Ludington SnackAbility
Overall SnackAbility
Crime in Ludington summary. We use data from the FBI to determine the crime rates in Ludington. Key points include:
There were 87 total crimes in Ludington in the last reporting year.
The overall crime rate per 100,000 people in Ludington is 1,147.5 / 100k people.
The violent crime rate per 100,000 people in Ludington is 211.0 / 100k people.
The property crime rate per 100,000 people in Ludington is 936.4 / 100k people.
Overall, crime in Ludington is -45.86% below the national average.
Total Crimes
Below National Average
Crime In Ludington Comparison Table
| Statistic | Count Raw |
Ludington / 100k People |
Michigan / 100k People |
National / 100k People |
|---|---|---|---|---|
| Total Crimes Per 100K | 87 | 1,147.5 | 1,813.2 | 2,119.2 |
| Violent Crime | 16 | 211.0 | 434.3 | 359.0 |
| Murder | 0 | 0.0 | 5.2 | 5.0 |
| Robbery | 0 | 0.0 | 31.3 | 61.0 |
| Aggravated Assault | 11 | 145.1 | 341.3 | 256.0 |
| Property Crime | 71 | 936.4 | 1,378.9 | 1,760.0 |
| Burglary | 6 | 79.1 | 184.2 | 229.0 |
| Larceny | 64 | 844.1 | 963.6 | 1,272.0 |
| Car Theft | 1 | 13.2 | 231.0 | 259.0 |
Source: FBI Uniform Crime Reporting (2024)
Cost of living in Ludington summary. We use data on the cost of living to determine how expensive it is to live in Ludington. Real estate prices drive most of the variance in cost of living around Michigan. Key points include:
The cost of living in Ludington is 92 with 100 being average.
The cost of living in Ludington is 0.9x lower than the national average.
The median home value in Ludington is $298,512.
The median income in Ludington is $46,411.
Ludington's Overall Cost Of Living
Lower Than The National Average
Cost Of Living In Ludington Comparison Table
| Living Expense | Ludington | Michigan | National Average |
|---|---|---|---|
| Overall | 92 | 91 | 100 |
| Services | 100 | 97 | 100 |
| Groceries | 99 | 98 | 100 |
| Health | 76 | 75 | 100 |
| Housing | 95 | 98 | 100 |
| Transportation | 103 | 101 | 100 |
| Utilities | 95 | 98 | 100 |
Source: Cost of living index, normalized to US average = 100
Ludington, MI Weather
The average high in Ludington is 54.6° and the average low is 38.2°.
There are 77.3 days of precipitation each year.
Expect an average of 34.6 inches of precipitation each year with 75.1 inches of snow.
| Stat | Ludington |
|---|---|
| Average Annual High | 54.6 |
| Average Annual Low | 38.2 |
| Annual Precipitation Days | 77.3 |
| Average Annual Precipitation | 34.6 |
| Average Annual Snowfall | 75.1 |
Average High
Days of Rain
Source: NOAA climate normals (30-year)
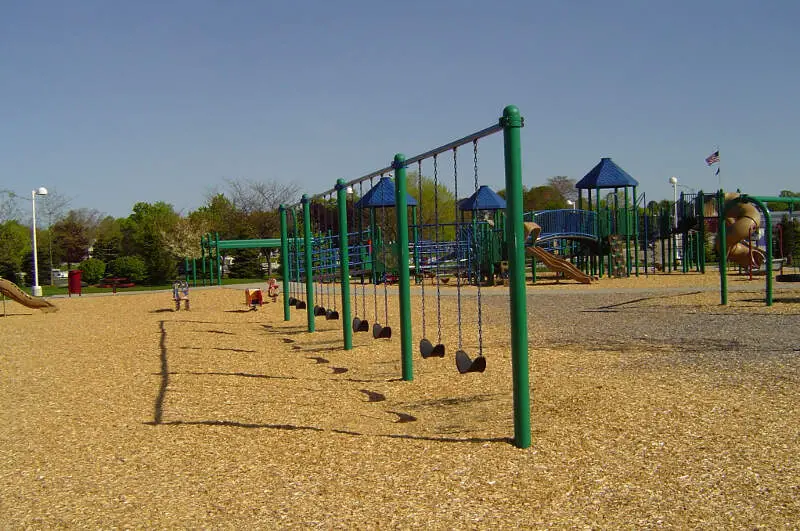
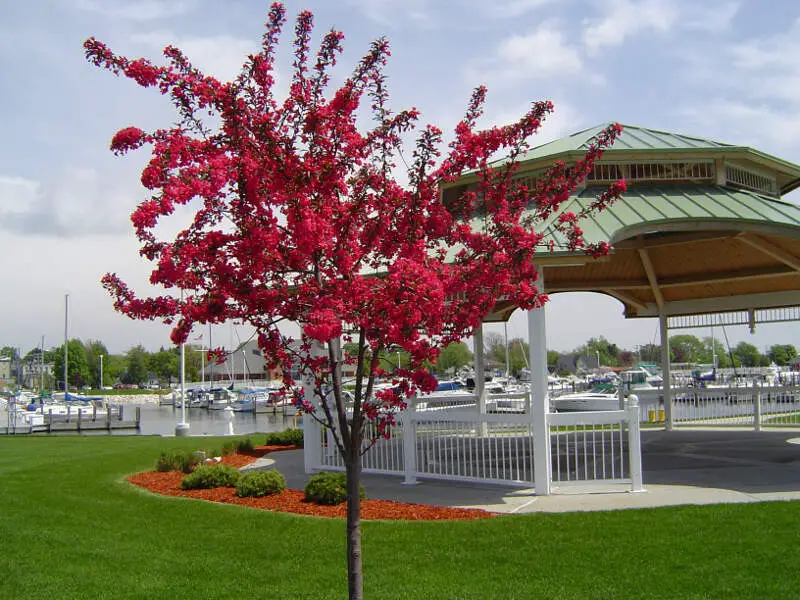
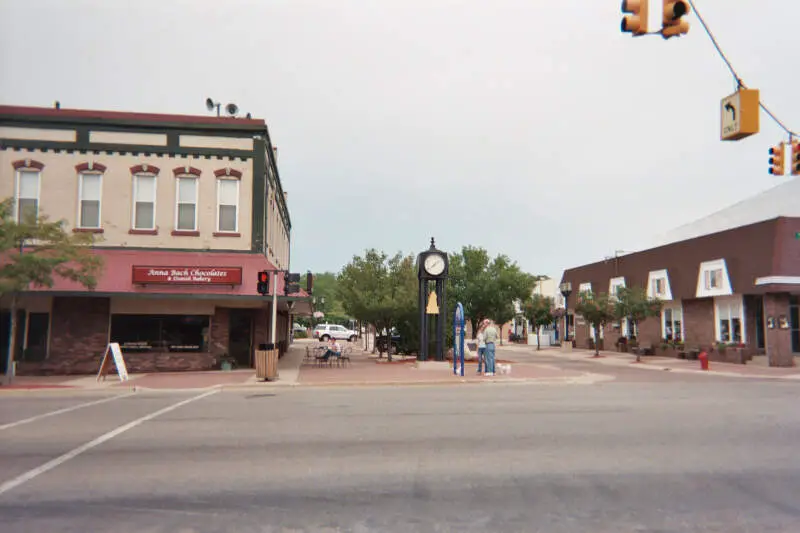
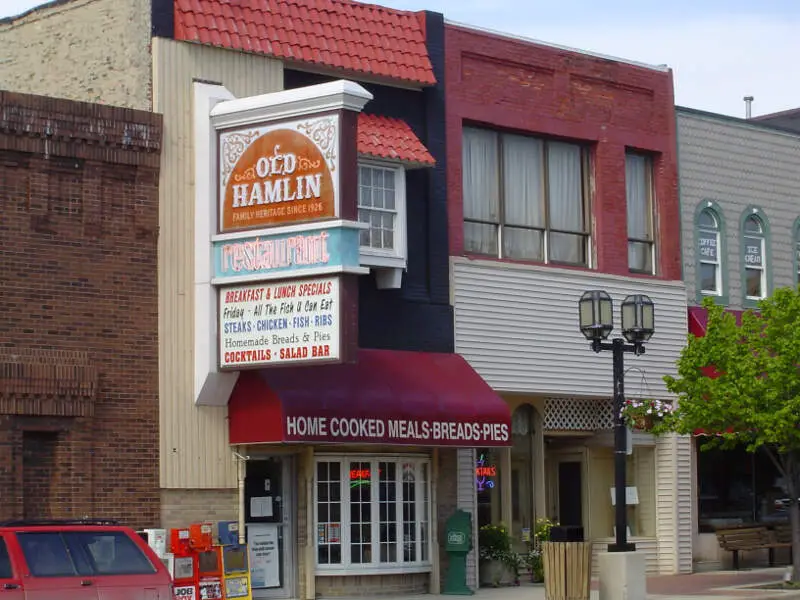
Ludington, MI Photos


1 Reviews & Comments About Ludington

This is a great place to take a vacation. My husband and I stayed at a bed and breakfast. Then we spent all day at the Ludington State Park. We had planned to leave town and our host told us about this great park. We rented bikes and also walked to the lighthouse and then rode back out. It is absolutely beautiful. Michigan is absolutely beautiful, actually.
The scenery. Absolutely beautiful!
Rankings & Articles For Ludington


Locations Around Ludington
Map Of Ludington, MI
Best Places Around Ludington
Manistee, MI
Population 6,275
Ludington Demographics And Statistics
Population over time in Ludington
The current population in Ludington is 7,676. The population has decreased 6.0% from 2010.
| Year | Population | % Change |
|---|---|---|
| 2024 | 7,676 | 0.2% |
| 2023 | 7,664 | -0.4% |
| 2022 | 7,691 | -0.5% |
| 2021 | 7,728 | -4.4% |
| 2020 | 8,081 | 0.1% |
| 2019 | 8,069 | 0.1% |
| 2018 | 8,057 | 0.1% |
| 2017 | 8,047 | -0.0% |
| 2016 | 8,051 | -0.0% |
| 2015 | 8,055 | -0.1% |
| 2014 | 8,061 | 0.0% |
| 2013 | 8,057 | -0.3% |
| 2012 | 8,081 | -0.5% |
| 2011 | 8,120 | -0.6% |
| 2010 | 8,166 | - |
Race / Ethnicity in Ludington
See the full breakdown
Ludington is:
87.6% White with 6,721 White residents.
1.8% African American with 139 African American residents.
0.5% American Indian with 39 American Indian residents.
1.1% Asian with 88 Asian residents.
0.0% Hawaiian with 0 Hawaiian residents.
0.0% Other with 0 Other residents.
4.0% Two Or More with 308 Two Or More residents.
5.0% Hispanic with 381 Hispanic residents.
| Race | Ludington | MI | USA |
|---|---|---|---|
| White | 87.6% | 72.4% | 57.4% |
| African American | 1.8% | 13.1% | 11.9% |
| American Indian | 0.5% | 0.3% | 0.5% |
| Asian | 1.1% | 3.4% | 5.9% |
| Hawaiian | 0.0% | 0.0% | 0.2% |
| Other | 0.0% | 0.5% | 0.6% |
| Two Or More | 4.0% | 4.5% | 4.3% |
| Hispanic | 5.0% | 5.9% | 19.3% |
Gender in Ludington
See the full breakdown
Ludington is 49.8% female with 3,821 female residents.
Ludington is 50.2% male with 3,854 male residents.
| Gender | Ludington | MI | USA |
|---|---|---|---|
| Female | 49.8% | 50.4% | 50.5% |
| Male | 50.2% | 49.6% | 49.5% |
Highest level of educational attainment in Ludington for adults over 25
See the full breakdown
3.0% of adults in Ludington completed < 9th grade.
4.0% of adults in Ludington completed 9-12th grade.
32.0% of adults in Ludington completed high school / ged.
22.0% of adults in Ludington completed some college.
10.0% of adults in Ludington completed associate's degree.
17.0% of adults in Ludington completed bachelor's degree.
9.0% of adults in Ludington completed master's degree.
2.0% of adults in Ludington completed professional degree.
1.0% of adults in Ludington completed doctorate degree.
| Education | Ludington | MI | USA |
|---|---|---|---|
| < 9th Grade | 3.0% | 3.0% | 4.0% |
| 9-12th Grade | 4.0% | 5.0% | 6.0% |
| High School / GED | 32.0% | 28.0% | 26.0% |
| Some College | 22.0% | 22.0% | 19.0% |
| Associate's Degree | 10.0% | 10.0% | 9.0% |
| Bachelor's Degree | 17.0% | 20.0% | 22.0% |
| Master's Degree | 9.0% | 9.0% | 10.0% |
| Professional Degree | 2.0% | 2.0% | 2.0% |
| Doctorate Degree | 1.0% | 1.0% | 2.0% |
Household Income For Ludington, Michigan
See the full breakdown
7.2% of households in Ludington earn Less than $10,000.
5.7% of households in Ludington earn $10,000 to $14,999.
10.0% of households in Ludington earn $15,000 to $24,999.
11.5% of households in Ludington earn $25,000 to $34,999.
17.1% of households in Ludington earn $35,000 to $49,999.
10.6% of households in Ludington earn $50,000 to $74,999.
13.9% of households in Ludington earn $75,000 to $99,999.
13.3% of households in Ludington earn $100,000 to $149,999.
6.5% of households in Ludington earn $150,000 to $199,999.
4.0% of households in Ludington earn $200,000 or more.
| Income | Ludington | MI | USA |
|---|---|---|---|
| Less than $10,000 | 7.2% | 5.2% | 5.0% |
| $10,000 to $14,999 | 5.7% | 3.8% | 3.4% |
| $15,000 to $24,999 | 10.0% | 6.8% | 6.3% |
| $25,000 to $34,999 | 11.5% | 7.3% | 6.6% |
| $35,000 to $49,999 | 17.1% | 11.4% | 10.1% |
| $50,000 to $74,999 | 10.6% | 16.8% | 15.5% |
| $75,000 to $99,999 | 13.9% | 13.2% | 12.6% |
| $100,000 to $149,999 | 13.3% | 17.3% | 17.5% |
| $150,000 to $199,999 | 6.5% | 8.6% | 9.6% |
| $200,000 or more | 4.0% | 9.5% | 13.4% |
Source: U.S. Census ACS 5-year estimates (2024)


