Marquette SnackAbility
Overall SnackAbility
Crime in Marquette summary. We use data from the FBI to determine the crime rates in Marquette. Key points include:
There were 148 total crimes in Marquette in the last reporting year.
The overall crime rate per 100,000 people in Marquette is 696.6 / 100k people.
The violent crime rate per 100,000 people in Marquette is 188.3 / 100k people.
The property crime rate per 100,000 people in Marquette is 508.4 / 100k people.
Overall, crime in Marquette is -67.13% below the national average.
Total Crimes
Below National Average
Crime In Marquette Comparison Table
| Statistic | Count Raw |
Marquette / 100k People |
Michigan / 100k People |
National / 100k People |
|---|---|---|---|---|
| Total Crimes Per 100K | 148 | 696.6 | 1,813.2 | 2,119.2 |
| Violent Crime | 40 | 188.3 | 434.3 | 359.0 |
| Murder | 0 | 0.0 | 5.2 | 5.0 |
| Robbery | 0 | 0.0 | 31.3 | 61.0 |
| Aggravated Assault | 26 | 122.4 | 341.3 | 256.0 |
| Property Crime | 108 | 508.4 | 1,378.9 | 1,760.0 |
| Burglary | 9 | 42.4 | 184.2 | 229.0 |
| Larceny | 98 | 461.3 | 963.6 | 1,272.0 |
| Car Theft | 1 | 4.7 | 231.0 | 259.0 |
Source: FBI Uniform Crime Reporting (2024)
Cost of living in Marquette summary. We use data on the cost of living to determine how expensive it is to live in Marquette. Real estate prices drive most of the variance in cost of living around Michigan. Key points include:
The cost of living in Marquette is 99 with 100 being average.
The cost of living in Marquette is 1.0x lower than the national average.
The median home value in Marquette is $323,188.
The median income in Marquette is $55,613.
Marquette's Overall Cost Of Living
Lower Than The National Average
Cost Of Living In Marquette Comparison Table
| Living Expense | Marquette | Michigan | National Average |
|---|---|---|---|
| Overall | 99 | 91 | 100 |
| Services | 96 | 97 | 100 |
| Groceries | 98 | 98 | 100 |
| Health | 94 | 75 | 100 |
| Housing | 100 | 98 | 100 |
| Transportation | 97 | 101 | 100 |
| Utilities | 95 | 98 | 100 |
Source: Cost of living index, normalized to US average = 100
Marquette, MI Weather
The average high in Marquette is 50.8° and the average low is 34.5°.
There are 71.7 days of precipitation each year.
Expect an average of 29.7 inches of precipitation each year with 128.0 inches of snow.
| Stat | Marquette |
|---|---|
| Average Annual High | 50.8 |
| Average Annual Low | 34.5 |
| Annual Precipitation Days | 71.7 |
| Average Annual Precipitation | 29.7 |
| Average Annual Snowfall | 128.0 |
Average High
Days of Rain
Source: NOAA climate normals (30-year)
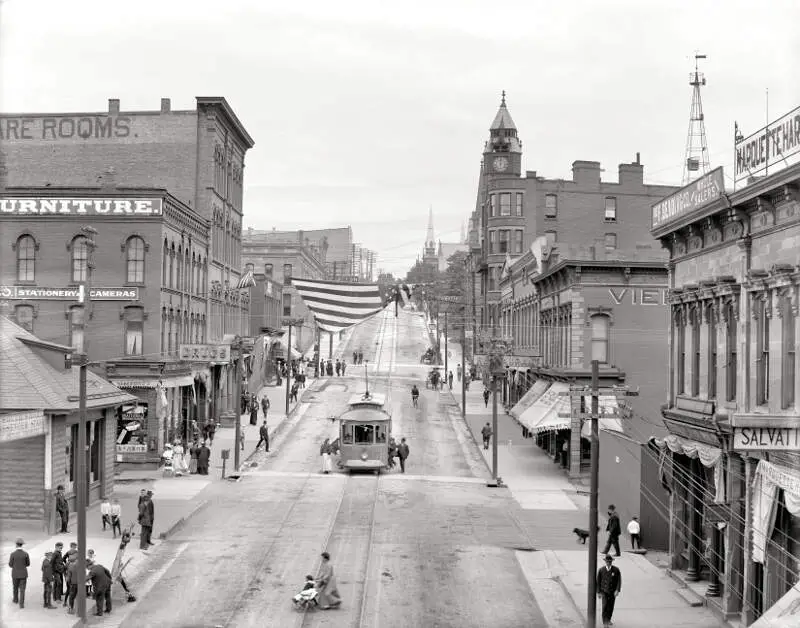
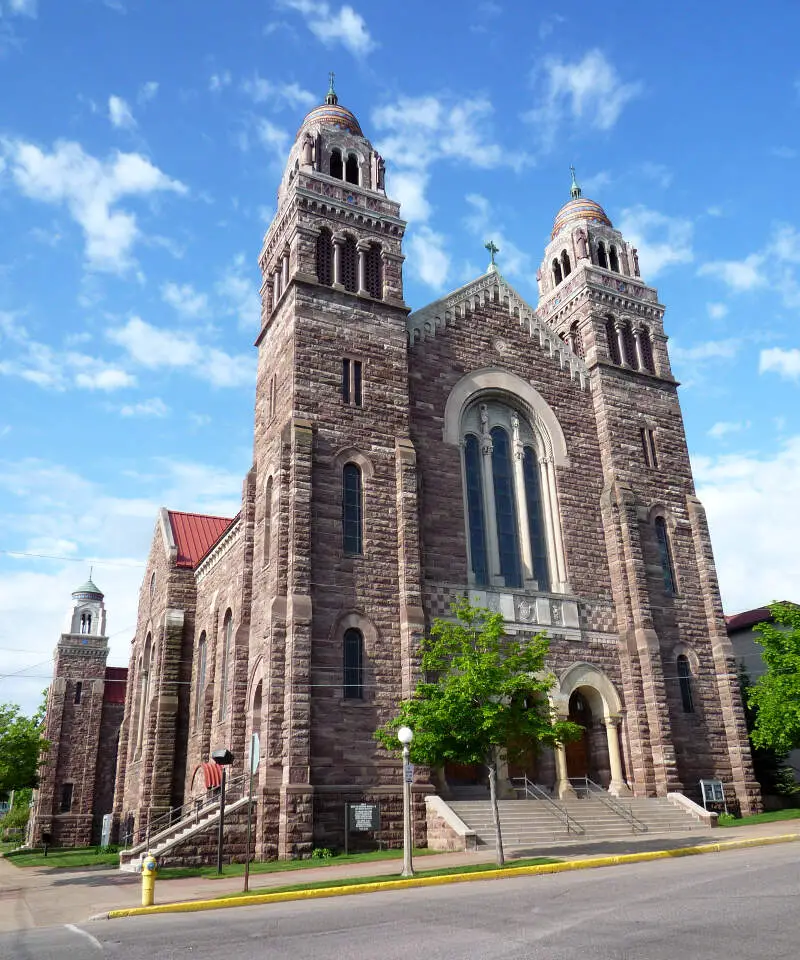
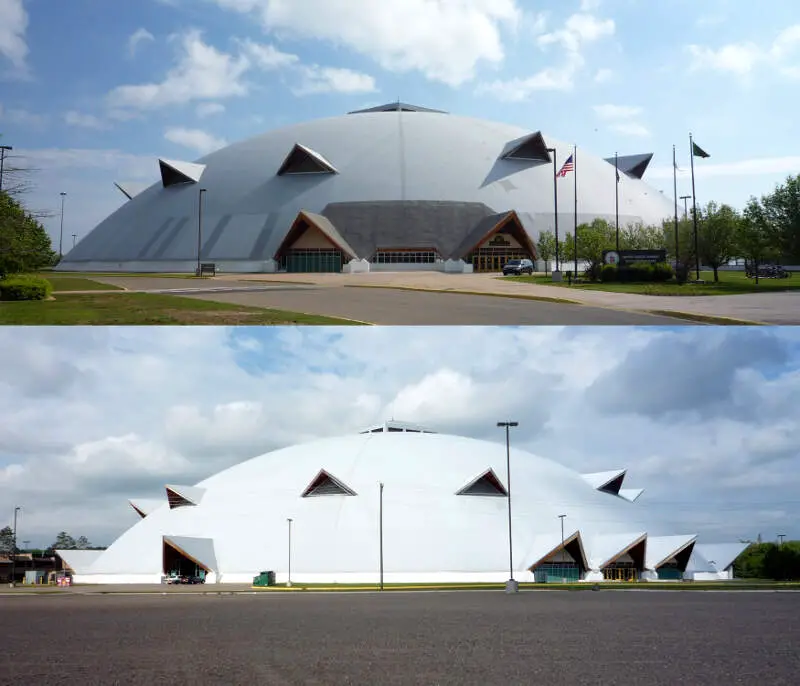
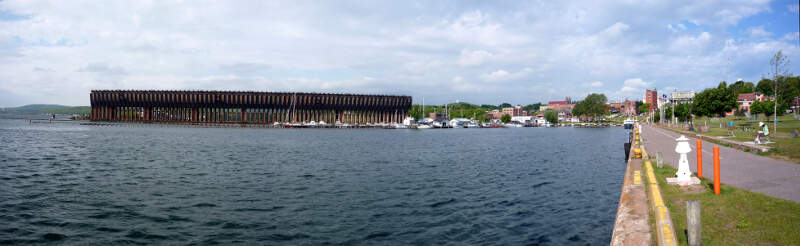
Marquette, MI Photos
2 Reviews & Comments About Marquette

Cute little town along Lake Superior in the Upper Peninsula in Michigan. There can be a lot of snow in the winter and in the summer Lake Superior is still cold. However, there are many great beaches and the town contains Northern Michigan University. The locals are always friendly and willing to help.
One of my favorite places there is Black Rocks Brewery, it has a great atmosphere and patio area. Although, I wish they served lunch along with the beer. If you are going hiking around Marquette make sure you bring bug spray!
I grew up in Marquette - an absolutely perfect place to spend your childhood. Definitely a sheltered and isolated place, but still, I loved growing up there.
I am not a big outdoorsman, but lots of people love to do the huntcamp thing. Otherwise, there is a surprising amount of culture in Marquette, decent places to have a drink, a beautiful lakeshore, etc.
Rankings & Articles For Marquette


Locations Around Marquette
Map Of Marquette, MI
Best Places Around Marquette
Ishpeming, MI
Population 6,181
Marquette Demographics And Statistics
Population over time in Marquette
The current population in Marquette is 21,325. The population has increased 0.4% from 2010.
| Year | Population | % Change |
|---|---|---|
| 2024 | 21,325 | 3.1% |
| 2023 | 20,691 | 0.1% |
| 2022 | 20,673 | 0.5% |
| 2021 | 20,561 | -0.3% |
| 2020 | 20,631 | -0.9% |
| 2019 | 20,822 | -0.5% |
| 2018 | 20,932 | -0.7% |
| 2017 | 21,081 | -0.9% |
| 2016 | 21,282 | -0.8% |
| 2015 | 21,444 | 0.1% |
| 2014 | 21,430 | 0.1% |
| 2013 | 21,399 | 0.1% |
| 2012 | 21,383 | 0.3% |
| 2011 | 21,311 | 0.3% |
| 2010 | 21,247 | - |
Race / Ethnicity in Marquette
See the full breakdown
Marquette is:
88.2% White with 18,810 White residents.
3.1% African American with 652 African American residents.
0.7% American Indian with 147 American Indian residents.
0.5% Asian with 102 Asian residents.
0.0% Hawaiian with 4 Hawaiian residents.
0.2% Other with 51 Other residents.
4.5% Two Or More with 954 Two Or More residents.
2.8% Hispanic with 605 Hispanic residents.
| Race | Marquette | MI | USA |
|---|---|---|---|
| White | 88.2% | 72.4% | 57.4% |
| African American | 3.1% | 13.1% | 11.9% |
| American Indian | 0.7% | 0.3% | 0.5% |
| Asian | 0.5% | 3.4% | 5.9% |
| Hawaiian | 0.0% | 0.0% | 0.2% |
| Other | 0.2% | 0.5% | 0.6% |
| Two Or More | 4.5% | 4.5% | 4.3% |
| Hispanic | 2.8% | 5.9% | 19.3% |
Gender in Marquette
See the full breakdown
Marquette is 48.2% female with 10,273 female residents.
Marquette is 51.8% male with 11,051 male residents.
| Gender | Marquette | MI | USA |
|---|---|---|---|
| Female | 48.2% | 50.4% | 50.5% |
| Male | 51.8% | 49.6% | 49.5% |
Highest level of educational attainment in Marquette for adults over 25
See the full breakdown
2.0% of adults in Marquette completed < 9th grade.
3.0% of adults in Marquette completed 9-12th grade.
20.0% of adults in Marquette completed high school / ged.
18.0% of adults in Marquette completed some college.
9.0% of adults in Marquette completed associate's degree.
31.0% of adults in Marquette completed bachelor's degree.
11.0% of adults in Marquette completed master's degree.
3.0% of adults in Marquette completed professional degree.
3.0% of adults in Marquette completed doctorate degree.
| Education | Marquette | MI | USA |
|---|---|---|---|
| < 9th Grade | 2.0% | 3.0% | 4.0% |
| 9-12th Grade | 3.0% | 5.0% | 6.0% |
| High School / GED | 20.0% | 28.0% | 26.0% |
| Some College | 18.0% | 22.0% | 19.0% |
| Associate's Degree | 9.0% | 10.0% | 9.0% |
| Bachelor's Degree | 31.0% | 20.0% | 22.0% |
| Master's Degree | 11.0% | 9.0% | 10.0% |
| Professional Degree | 3.0% | 2.0% | 2.0% |
| Doctorate Degree | 3.0% | 1.0% | 2.0% |
Household Income For Marquette, Michigan
See the full breakdown
7.3% of households in Marquette earn Less than $10,000.
5.0% of households in Marquette earn $10,000 to $14,999.
8.6% of households in Marquette earn $15,000 to $24,999.
12.6% of households in Marquette earn $25,000 to $34,999.
11.1% of households in Marquette earn $35,000 to $49,999.
17.6% of households in Marquette earn $50,000 to $74,999.
13.2% of households in Marquette earn $75,000 to $99,999.
13.5% of households in Marquette earn $100,000 to $149,999.
5.5% of households in Marquette earn $150,000 to $199,999.
5.5% of households in Marquette earn $200,000 or more.
| Income | Marquette | MI | USA |
|---|---|---|---|
| Less than $10,000 | 7.3% | 5.2% | 5.0% |
| $10,000 to $14,999 | 5.0% | 3.8% | 3.4% |
| $15,000 to $24,999 | 8.6% | 6.8% | 6.3% |
| $25,000 to $34,999 | 12.6% | 7.3% | 6.6% |
| $35,000 to $49,999 | 11.1% | 11.4% | 10.1% |
| $50,000 to $74,999 | 17.6% | 16.8% | 15.5% |
| $75,000 to $99,999 | 13.2% | 13.2% | 12.6% |
| $100,000 to $149,999 | 13.5% | 17.3% | 17.5% |
| $150,000 to $199,999 | 5.5% | 8.6% | 9.6% |
| $200,000 or more | 5.5% | 9.5% | 13.4% |
Source: U.S. Census ACS 5-year estimates (2024)


