Rochester SnackAbility
Overall SnackAbility
Crime in Rochester summary. We use data from the FBI to determine the crime rates in Rochester. Key points include:
There were 51 total crimes in Rochester in the last reporting year.
The overall crime rate per 100,000 people in Rochester is 401.4 / 100k people.
The violent crime rate per 100,000 people in Rochester is 23.6 / 100k people.
The property crime rate per 100,000 people in Rochester is 377.8 / 100k people.
Overall, crime in Rochester is -81.06% below the national average.
Total Crimes
Below National Average
Crime In Rochester Comparison Table
| Statistic | Count Raw |
Rochester / 100k People |
Michigan / 100k People |
National / 100k People |
|---|---|---|---|---|
| Total Crimes Per 100K | 51 | 401.4 | 1,813.2 | 2,119.2 |
| Violent Crime | 3 | 23.6 | 434.3 | 359.0 |
| Murder | 0 | 0.0 | 5.2 | 5.0 |
| Robbery | 0 | 0.0 | 31.3 | 61.0 |
| Aggravated Assault | 3 | 23.6 | 341.3 | 256.0 |
| Property Crime | 48 | 377.8 | 1,378.9 | 1,760.0 |
| Burglary | 1 | 7.9 | 184.2 | 229.0 |
| Larceny | 42 | 330.6 | 963.6 | 1,272.0 |
| Car Theft | 5 | 39.4 | 231.0 | 259.0 |
Source: FBI Uniform Crime Reporting (2024)
Cost of living in Rochester summary. We use data on the cost of living to determine how expensive it is to live in Rochester. Real estate prices drive most of the variance in cost of living around Michigan. Key points include:
The cost of living in Rochester is 124 with 100 being average.
The cost of living in Rochester is 1.2x higher than the national average.
The median home value in Rochester is $486,536.
The median income in Rochester is $111,750.
Rochester's Overall Cost Of Living
Higher Than The National Average
Cost Of Living In Rochester Comparison Table
| Living Expense | Rochester | Michigan | National Average |
|---|---|---|---|
| Overall | 124 | 91 | 100 |
| Services | 100 | 97 | 100 |
| Groceries | 98 | 98 | 100 |
| Health | 180 | 75 | 100 |
| Housing | 99 | 98 | 100 |
| Transportation | 103 | 101 | 100 |
| Utilities | 94 | 98 | 100 |
Source: Cost of living index, normalized to US average = 100
Rochester, MI Weather
The average high in Rochester is 57.6° and the average low is 39.3°.
There are 70.5 days of precipitation each year.
Expect an average of 32.7 inches of precipitation each year with 36.4 inches of snow.
| Stat | Rochester |
|---|---|
| Average Annual High | 57.6 |
| Average Annual Low | 39.3 |
| Annual Precipitation Days | 70.5 |
| Average Annual Precipitation | 32.7 |
| Average Annual Snowfall | 36.4 |
Average High
Days of Rain
Source: NOAA climate normals (30-year)
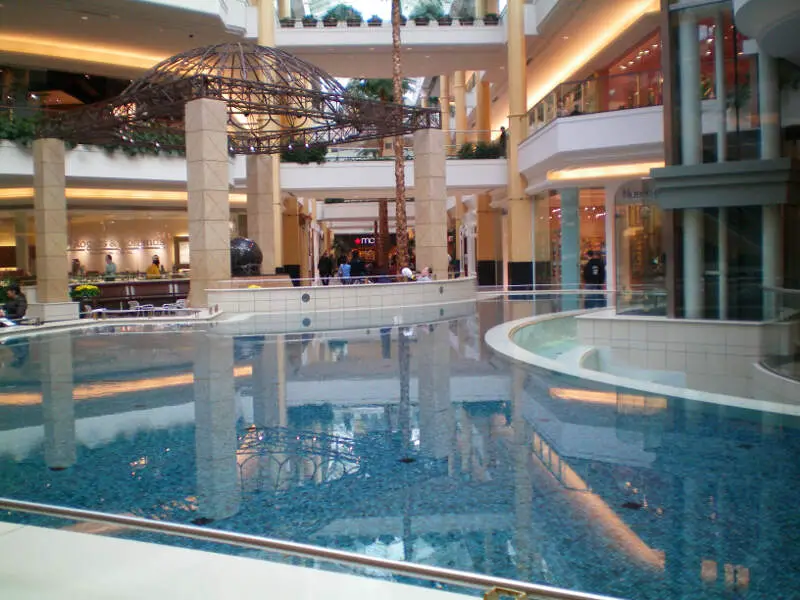
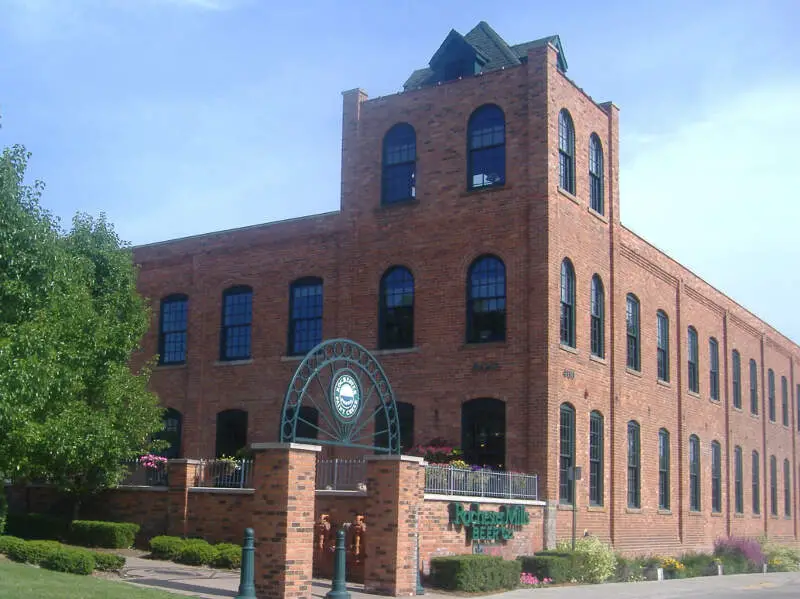
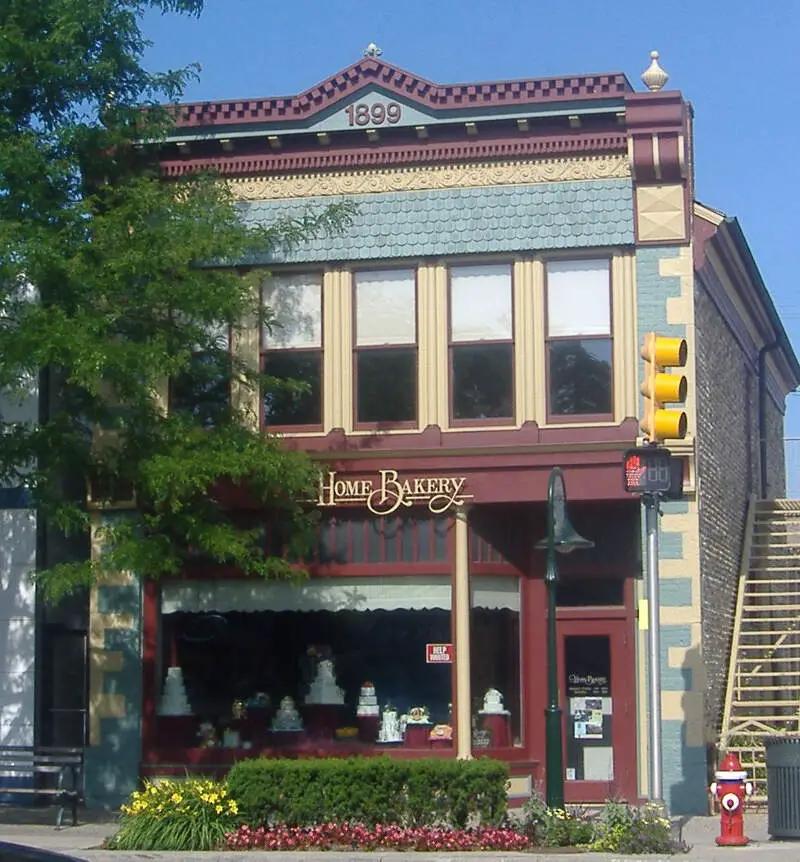
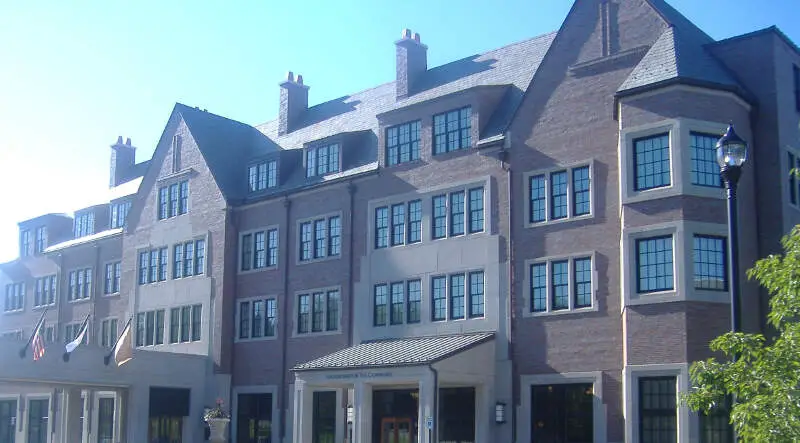
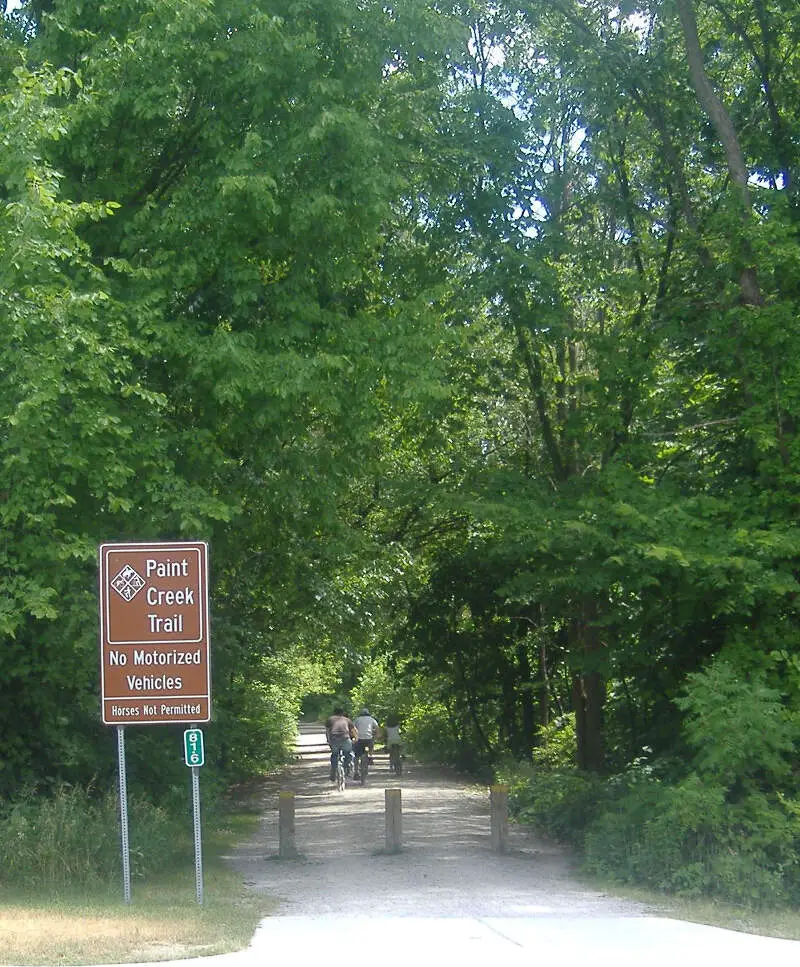
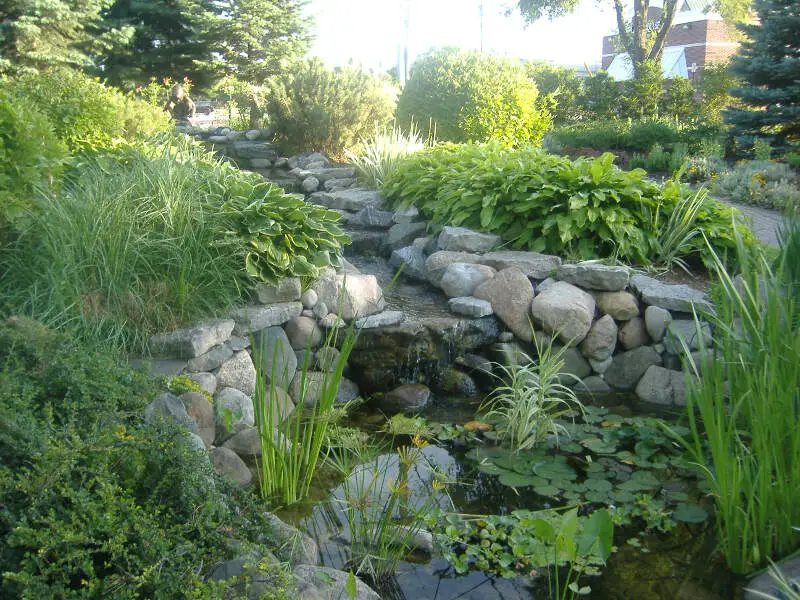
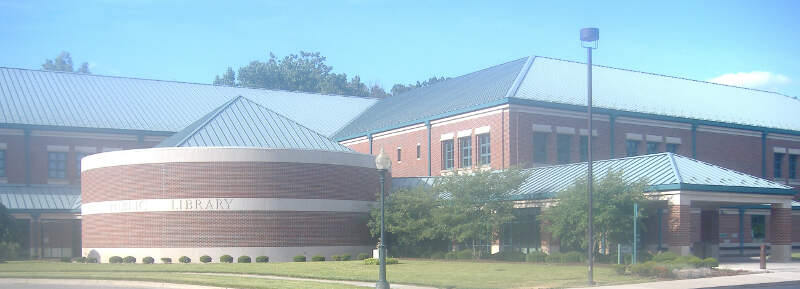
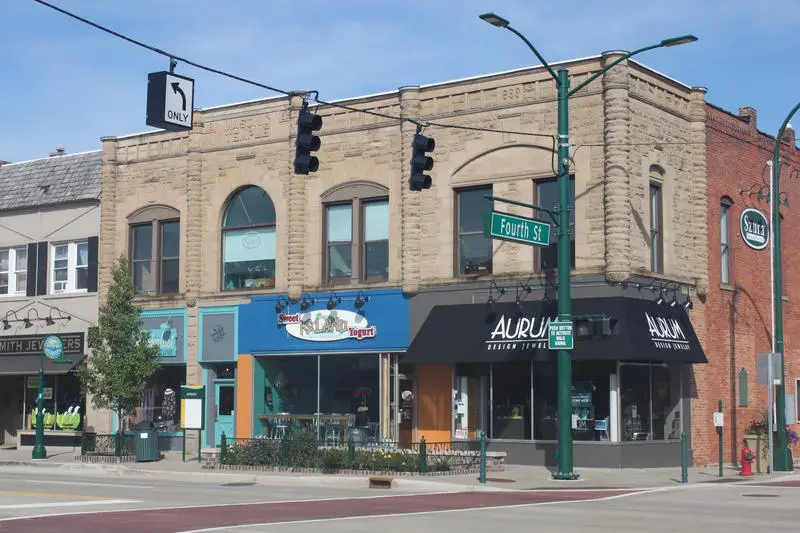
Rochester, MI Photos
Rankings & Articles For Rochester


Locations Around Rochester
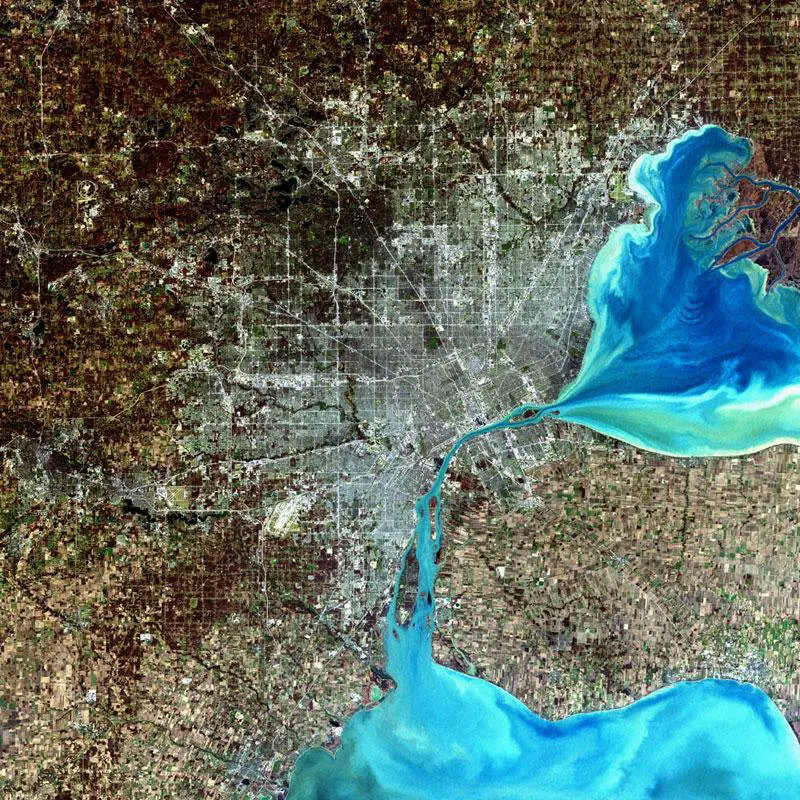
Map Of Rochester, MI
Best Places Around Rochester
Royal Oak, MI
Population 57,950
Birmingham, MI
Population 21,763
Berkley, MI
Population 15,149
Huntington Woods, MI
Population 6,328
Troy, MI
Population 87,898
Clawson, MI
Population 11,374
Rochester Hills, MI
Population 77,089
Beverly Hills, MI
Population 10,524
Farmington Hills, MI
Population 83,515
Sterling Heights, MI
Population 133,573
Rochester Demographics And Statistics
Population over time in Rochester
The current population in Rochester is 12,934. The population has increased 5.1% from 2010.
| Year | Population | % Change |
|---|---|---|
| 2024 | 12,934 | -0.0% |
| 2023 | 12,939 | -0.3% |
| 2022 | 12,978 | -0.5% |
| 2021 | 13,048 | -1.2% |
| 2020 | 13,203 | 0.3% |
| 2019 | 13,162 | 0.2% |
| 2018 | 13,130 | 1.1% |
| 2017 | 12,987 | 0.1% |
| 2016 | 12,969 | 0.5% |
| 2015 | 12,909 | 0.3% |
| 2014 | 12,872 | 0.7% |
| 2013 | 12,782 | 1.1% |
| 2012 | 12,647 | 1.4% |
| 2011 | 12,478 | 1.3% |
| 2010 | 12,312 | - |
Race / Ethnicity in Rochester
See the full breakdown
Rochester is:
80.3% White with 10,383 White residents.
3.9% African American with 501 African American residents.
0.1% American Indian with 11 American Indian residents.
8.0% Asian with 1,031 Asian residents.
0.0% Hawaiian with 0 Hawaiian residents.
0.2% Other with 24 Other residents.
5.8% Two Or More with 755 Two Or More residents.
1.8% Hispanic with 229 Hispanic residents.
| Race | Rochester | MI | USA |
|---|---|---|---|
| White | 80.3% | 72.4% | 57.4% |
| African American | 3.9% | 13.1% | 11.9% |
| American Indian | 0.1% | 0.3% | 0.5% |
| Asian | 8.0% | 3.4% | 5.9% |
| Hawaiian | 0.0% | 0.0% | 0.2% |
| Other | 0.2% | 0.5% | 0.6% |
| Two Or More | 5.8% | 4.5% | 4.3% |
| Hispanic | 1.8% | 5.9% | 19.3% |
Gender in Rochester
See the full breakdown
Rochester is 52.5% female with 6,785 female residents.
Rochester is 47.5% male with 6,148 male residents.
| Gender | Rochester | MI | USA |
|---|---|---|---|
| Female | 52.5% | 50.4% | 50.5% |
| Male | 47.5% | 49.6% | 49.5% |
Highest level of educational attainment in Rochester for adults over 25
See the full breakdown
-0.0% of adults in Rochester completed < 9th grade.
1.0% of adults in Rochester completed 9-12th grade.
8.0% of adults in Rochester completed high school / ged.
12.0% of adults in Rochester completed some college.
8.0% of adults in Rochester completed associate's degree.
35.0% of adults in Rochester completed bachelor's degree.
28.0% of adults in Rochester completed master's degree.
4.0% of adults in Rochester completed professional degree.
4.0% of adults in Rochester completed doctorate degree.
| Education | Rochester | MI | USA |
|---|---|---|---|
| < 9th Grade | -0.0% | 3.0% | 4.0% |
| 9-12th Grade | 1.0% | 5.0% | 6.0% |
| High School / GED | 8.0% | 28.0% | 26.0% |
| Some College | 12.0% | 22.0% | 19.0% |
| Associate's Degree | 8.0% | 10.0% | 9.0% |
| Bachelor's Degree | 35.0% | 20.0% | 22.0% |
| Master's Degree | 28.0% | 9.0% | 10.0% |
| Professional Degree | 4.0% | 2.0% | 2.0% |
| Doctorate Degree | 4.0% | 1.0% | 2.0% |
Household Income For Rochester, Michigan
See the full breakdown
4.3% of households in Rochester earn Less than $10,000.
0.4% of households in Rochester earn $10,000 to $14,999.
2.2% of households in Rochester earn $15,000 to $24,999.
6.2% of households in Rochester earn $25,000 to $34,999.
7.0% of households in Rochester earn $35,000 to $49,999.
8.5% of households in Rochester earn $50,000 to $74,999.
16.2% of households in Rochester earn $75,000 to $99,999.
15.1% of households in Rochester earn $100,000 to $149,999.
11.1% of households in Rochester earn $150,000 to $199,999.
28.9% of households in Rochester earn $200,000 or more.
| Income | Rochester | MI | USA |
|---|---|---|---|
| Less than $10,000 | 4.3% | 5.2% | 5.0% |
| $10,000 to $14,999 | 0.4% | 3.8% | 3.4% |
| $15,000 to $24,999 | 2.2% | 6.8% | 6.3% |
| $25,000 to $34,999 | 6.2% | 7.3% | 6.6% |
| $35,000 to $49,999 | 7.0% | 11.4% | 10.1% |
| $50,000 to $74,999 | 8.5% | 16.8% | 15.5% |
| $75,000 to $99,999 | 16.2% | 13.2% | 12.6% |
| $100,000 to $149,999 | 15.1% | 17.3% | 17.5% |
| $150,000 to $199,999 | 11.1% | 8.6% | 9.6% |
| $200,000 or more | 28.9% | 9.5% | 13.4% |
Source: U.S. Census ACS 5-year estimates (2024)


