Saginaw SnackAbility
Overall SnackAbility
Crime in Saginaw summary. We use data from the FBI to determine the crime rates in Saginaw. Key points include:
There were 1,784 total crimes in Saginaw in the last reporting year.
The overall crime rate per 100,000 people in Saginaw is 4,160.4 / 100k people.
The violent crime rate per 100,000 people in Saginaw is 2,201.5 / 100k people.
The property crime rate per 100,000 people in Saginaw is 1,959.0 / 100k people.
Overall, crime in Saginaw is 96.32% above the national average.
Total Crimes
Above National Average
Crime In Saginaw Comparison Table
| Statistic | Count Raw |
Saginaw / 100k People |
Michigan / 100k People |
National / 100k People |
|---|---|---|---|---|
| Total Crimes Per 100K | 1,784 | 4,160.4 | 1,813.2 | 2,119.2 |
| Violent Crime | 944 | 2,201.5 | 434.3 | 359.0 |
| Murder | 19 | 44.3 | 5.2 | 5.0 |
| Robbery | 58 | 135.3 | 31.3 | 61.0 |
| Aggravated Assault | 810 | 1,889.0 | 341.3 | 256.0 |
| Property Crime | 840 | 1,959.0 | 1,378.9 | 1,760.0 |
| Burglary | 230 | 536.4 | 184.2 | 229.0 |
| Larceny | 484 | 1,128.7 | 963.6 | 1,272.0 |
| Car Theft | 126 | 293.8 | 231.0 | 259.0 |
Source: FBI Uniform Crime Reporting (2024)
Cost of living in Saginaw summary. We use data on the cost of living to determine how expensive it is to live in Saginaw. Real estate prices drive most of the variance in cost of living around Michigan. Key points include:
The cost of living in Saginaw is 79 with 100 being average.
The cost of living in Saginaw is 0.8x lower than the national average.
The median home value in Saginaw is $128,097.
The median income in Saginaw is $38,579.
Saginaw's Overall Cost Of Living
Lower Than The National Average
Cost Of Living In Saginaw Comparison Table
| Living Expense | Saginaw | Michigan | National Average |
|---|---|---|---|
| Overall | 79 | 91 | 100 |
| Services | 95 | 97 | 100 |
| Groceries | 94 | 98 | 100 |
| Health | 42 | 75 | 100 |
| Housing | 100 | 98 | 100 |
| Transportation | 102 | 101 | 100 |
| Utilities | 94 | 98 | 100 |
Source: Cost of living index, normalized to US average = 100
Saginaw, MI Weather
The average high in Saginaw is 57.6° and the average low is 37.9°.
There are 72.3 days of precipitation each year.
Expect an average of 32.8 inches of precipitation each year with 41.7 inches of snow.
| Stat | Saginaw |
|---|---|
| Average Annual High | 57.6 |
| Average Annual Low | 37.9 |
| Annual Precipitation Days | 72.3 |
| Average Annual Precipitation | 32.8 |
| Average Annual Snowfall | 41.7 |
Average High
Days of Rain
Source: NOAA climate normals (30-year)
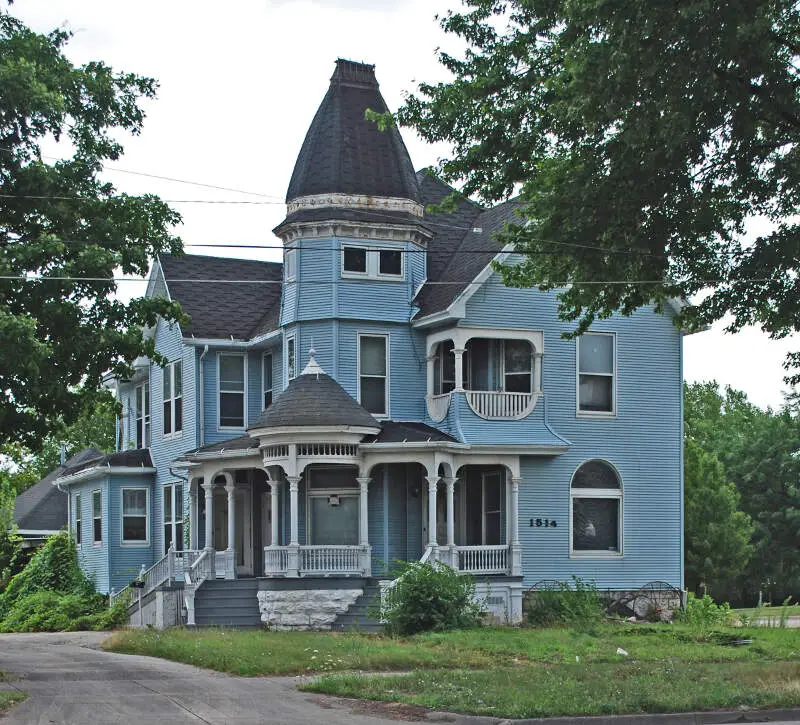
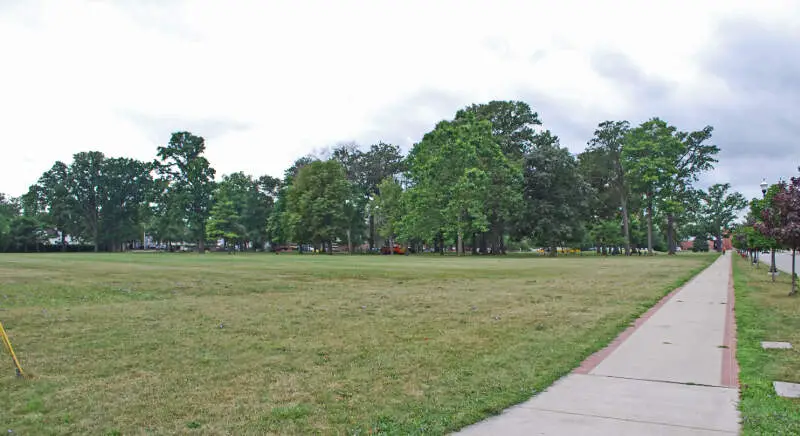
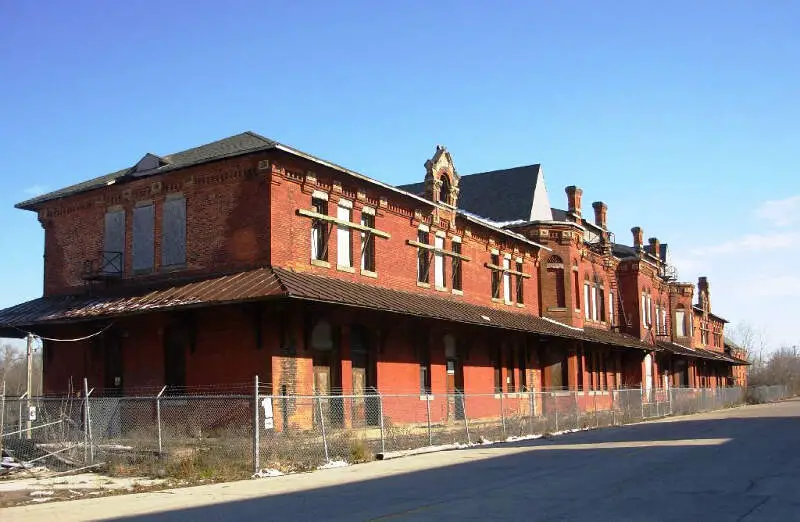
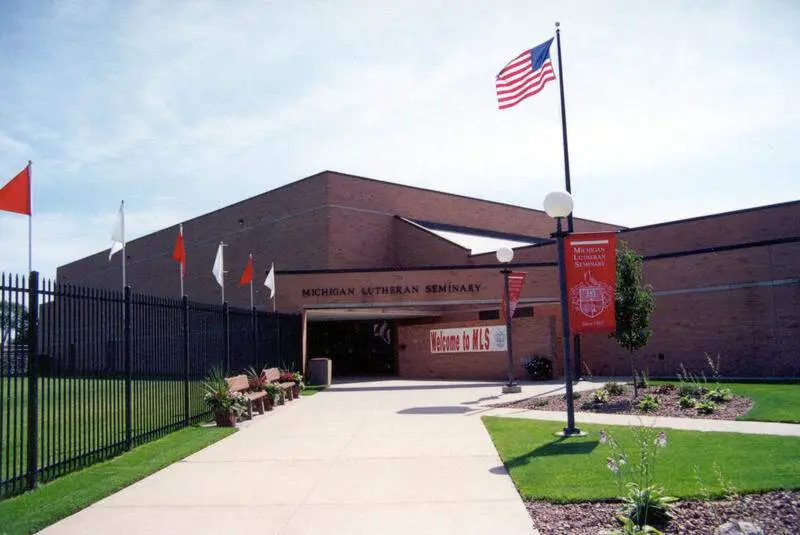
Saginaw, MI Photos


2 Reviews & Comments About Saginaw

I live in Saginaw, it's pretty chill but the good part is the township because I live in golfside and I'm a member of the country club
Edit: the township schools are great
I love Saginaw Michigan its a great place and I love how beautiful and amazing this city is I wish I lived there again. This is my home town.
I love the trees, the apples, pumpkin farms.
Rankings & Articles For Saginaw


Locations Around Saginaw
Map Of Saginaw, MI
Best Places Around Saginaw
Midland, MI
Population 42,724
Freeland, MI
Population 7,557
Shields, MI
Population 7,402
Bridgeport, MI
Population 6,884
Buena Vista, MI
Population 5,798
Saginaw Demographics And Statistics
Population over time in Saginaw
The current population in Saginaw is 43,536. The population has decreased 18.6% from 2010.
| Year | Population | % Change |
|---|---|---|
| 2024 | 43,536 | -0.8% |
| 2023 | 43,879 | -1.0% |
| 2022 | 44,316 | -1.1% |
| 2021 | 44,796 | -7.5% |
| 2020 | 48,407 | -0.5% |
| 2019 | 48,650 | -0.7% |
| 2018 | 48,997 | -0.7% |
| 2017 | 49,366 | -1.1% |
| 2016 | 49,892 | -0.8% |
| 2015 | 50,288 | -0.8% |
| 2014 | 50,700 | -0.9% |
| 2013 | 51,165 | -1.2% |
| 2012 | 51,776 | -1.4% |
| 2011 | 52,525 | -1.8% |
| 2010 | 53,463 | - |
Race / Ethnicity in Saginaw
See the full breakdown
Saginaw is:
34.7% White with 15,099 White residents.
44.3% African American with 19,285 African American residents.
0.1% American Indian with 29 American Indian residents.
0.2% Asian with 95 Asian residents.
0.0% Hawaiian with 0 Hawaiian residents.
0.3% Other with 146 Other residents.
4.5% Two Or More with 1,972 Two Or More residents.
15.9% Hispanic with 6,910 Hispanic residents.
| Race | Saginaw | MI | USA |
|---|---|---|---|
| White | 34.7% | 72.4% | 57.4% |
| African American | 44.3% | 13.1% | 11.9% |
| American Indian | 0.1% | 0.3% | 0.5% |
| Asian | 0.2% | 3.4% | 5.9% |
| Hawaiian | 0.0% | 0.0% | 0.2% |
| Other | 0.3% | 0.5% | 0.6% |
| Two Or More | 4.5% | 4.5% | 4.3% |
| Hispanic | 15.9% | 5.9% | 19.3% |
Gender in Saginaw
See the full breakdown
Saginaw is 52.3% female with 22,752 female residents.
Saginaw is 47.7% male with 20,784 male residents.
| Gender | Saginaw | MI | USA |
|---|---|---|---|
| Female | 52.3% | 50.4% | 50.5% |
| Male | 47.7% | 49.6% | 49.5% |
Highest level of educational attainment in Saginaw for adults over 25
See the full breakdown
3.0% of adults in Saginaw completed < 9th grade.
12.0% of adults in Saginaw completed 9-12th grade.
36.0% of adults in Saginaw completed high school / ged.
26.0% of adults in Saginaw completed some college.
10.0% of adults in Saginaw completed associate's degree.
9.0% of adults in Saginaw completed bachelor's degree.
3.0% of adults in Saginaw completed master's degree.
1.0% of adults in Saginaw completed professional degree.
0.0% of adults in Saginaw completed doctorate degree.
| Education | Saginaw | MI | USA |
|---|---|---|---|
| < 9th Grade | 3.0% | 3.0% | 4.0% |
| 9-12th Grade | 12.0% | 5.0% | 6.0% |
| High School / GED | 36.0% | 28.0% | 26.0% |
| Some College | 26.0% | 22.0% | 19.0% |
| Associate's Degree | 10.0% | 10.0% | 9.0% |
| Bachelor's Degree | 9.0% | 20.0% | 22.0% |
| Master's Degree | 3.0% | 9.0% | 10.0% |
| Professional Degree | 1.0% | 2.0% | 2.0% |
| Doctorate Degree | 0.0% | 1.0% | 2.0% |
Household Income For Saginaw, Michigan
See the full breakdown
11.0% of households in Saginaw earn Less than $10,000.
10.2% of households in Saginaw earn $10,000 to $14,999.
12.7% of households in Saginaw earn $15,000 to $24,999.
12.5% of households in Saginaw earn $25,000 to $34,999.
15.4% of households in Saginaw earn $35,000 to $49,999.
16.9% of households in Saginaw earn $50,000 to $74,999.
9.9% of households in Saginaw earn $75,000 to $99,999.
8.8% of households in Saginaw earn $100,000 to $149,999.
1.3% of households in Saginaw earn $150,000 to $199,999.
1.3% of households in Saginaw earn $200,000 or more.
| Income | Saginaw | MI | USA |
|---|---|---|---|
| Less than $10,000 | 11.0% | 5.2% | 5.0% |
| $10,000 to $14,999 | 10.2% | 3.8% | 3.4% |
| $15,000 to $24,999 | 12.7% | 6.8% | 6.3% |
| $25,000 to $34,999 | 12.5% | 7.3% | 6.6% |
| $35,000 to $49,999 | 15.4% | 11.4% | 10.1% |
| $50,000 to $74,999 | 16.9% | 16.8% | 15.5% |
| $75,000 to $99,999 | 9.9% | 13.2% | 12.6% |
| $100,000 to $149,999 | 8.8% | 17.3% | 17.5% |
| $150,000 to $199,999 | 1.3% | 8.6% | 9.6% |
| $200,000 or more | 1.3% | 9.5% | 13.4% |
Source: U.S. Census ACS 5-year estimates (2024)


