We used Saturday Night Science to analyze Montana’s most recent Census data to determine the divorce rate for each city in Montana based on the percentage of currently divorced residents.
The city with the highest divorce rate in Montana is Lewistown, with 16.0% of people over 15 years of age being divorced, per the most recent census data. The city with the lowest divorce rate in Montana is West Yellowstone.
Montana is 5.0% divorced overall. There are some 44,675 people living in Montana over fifteen years of age who are divorced. You can compare that to the 28,339,199 Americans who are currently divorced.
Isn’t the divorce rate in America close to 50%? Yes indeed. But we’re measuring something else; we are looking at counts and percentages of people over 15 years old who are currently divorced. That 50% statistic is for the percentage of people who have ever been divorced.
So now that we have you biting your nails, rethinking your worldview, and pulling out your hair, let’s look at the places in Montana with the highest rates of divorcees.
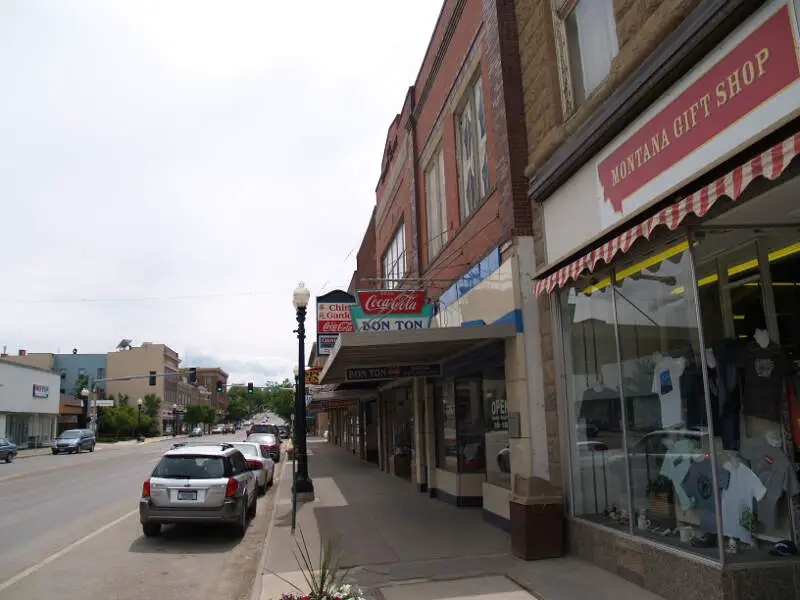
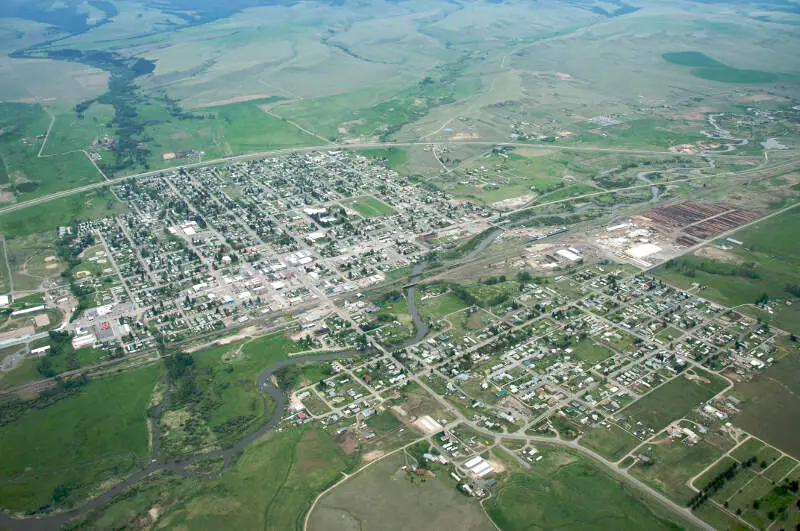
16.0% divorced · #1 highest divorce rate in Montana
Lewistown is a city in and the county seat of Fergus County, Montana, United States. The population was 5,901 at the 2010 census. Lewistown is located in central Montana, the geographic center of the state, southeast of Great Falls. First planned in 1882, it was the site of an 1880s gold rush.
Data | Crime | Cost of living | Movers
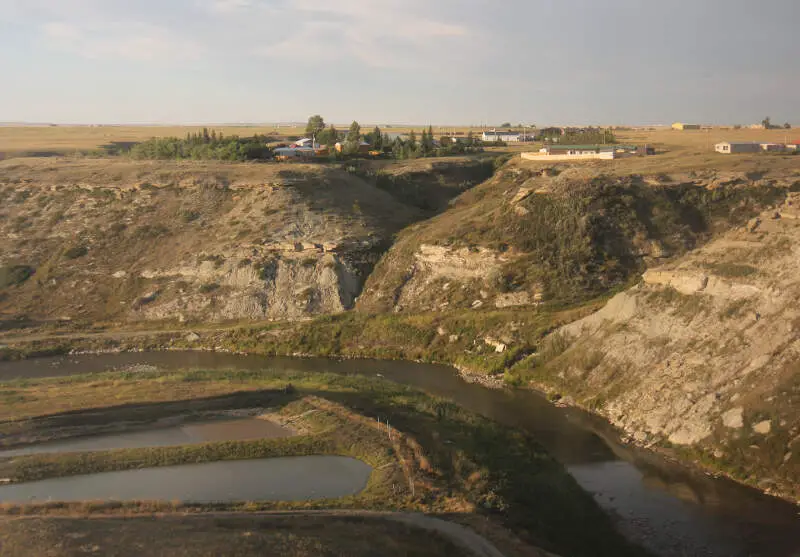
14.0% divorced · #2 highest divorce rate in Montana
Data | Movers
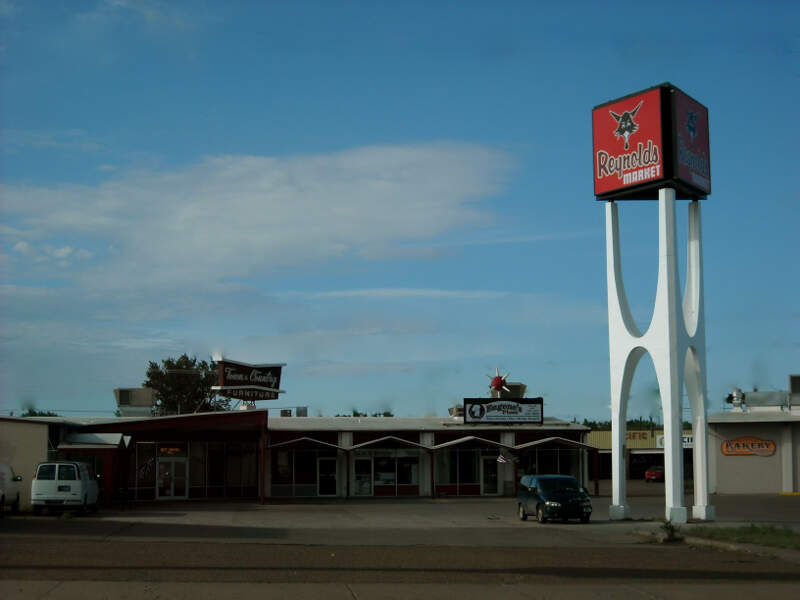
14.0% divorced · #2 highest divorce rate in Montana
Data | Crime | Cost of living | Movers
13.0% divorced · #4 highest divorce rate in Montana
12.0% divorced · #6 highest divorce rate in Montana
Data | Crime | Cost of living | Movers
12.0% divorced · #6 highest divorce rate in Montana
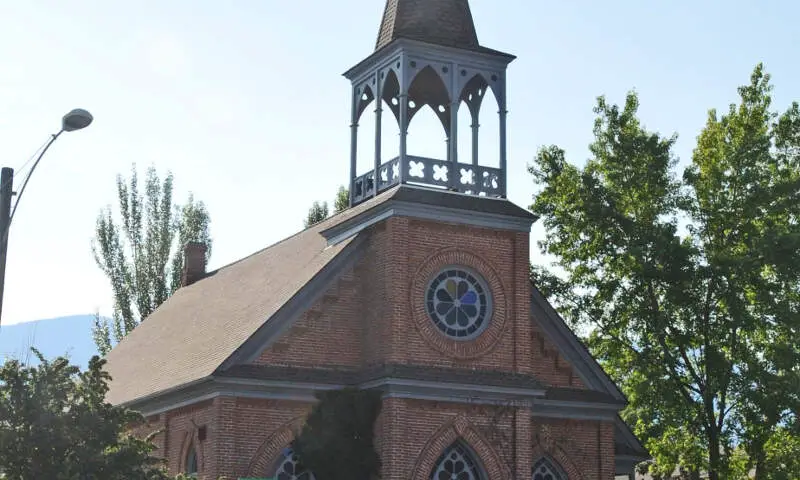
11.0% divorced · #7 highest divorce rate in Montana
Columbia Falls is a city in Flathead County, Montana, United States. The population was 4,710 at the 2010 census
Data | Crime | Cost of living | Movers
10.0% divorced · #10 highest divorce rate in Montana
10.0% divorced · #10 highest divorce rate in Montana
10.0% divorced · #10 highest divorce rate in Montana
Deer Lodge County is a county in the U.S. state of Montana. As of the 2010 census, the population was 9,298. It forms a consolidated city-county government with its county seat of Anaconda. The county was founded in 1865.
Data | Crime | Cost of living | Movers
The receipts
Compare the top ten
Pick a metric. The bars rescale. The red line is Montana’s statewide median.
Montana statewide median: $72,509
On the map
Where Montana’s highest divorce rates are
Saturday Night Science
How We Determined The Places In Montana That Get Un-Hitched The Most
We used Saturday Night Science to look at the U.S. Census Bureau on divorce rates. Because who likes tracking misery more than the U.S. government?
Specifically, we looked at the 2020-2024 American Community Survey table S1201 — Marital Status. Pretty straightforward on that front — we just had to extract the following column of data:
Today, the analysis focuses on the 53 places in Montana with a population of over 1,000.
- Population 15 Years and Over -> Divorced
We ranked each place by the percentage of divorcees over 15 years of age from highest to lowest. We crowned the divorce capital of Montana the place with the highest incidence of divorcees, Lewistown.
And if you’re trying to avoid divorce, check out West Yellowstone, the city with the lowest divorce rate in Montana. We updated this article for 2026 and this list is our eleventh time ranking the cities in Montana with the highest divorce rates.
The full plate
Cities With The Highest Divorce Rates In Montana
Click any column to sort. Search by city name.
| Rank | City | Population | Divorcees | Divorce Rate |
|---|---|---|---|---|
| 1 | Lewistown | 6,087 | 779 | 16.0% |
| 2 | Deer Lodge | 3,021 | 338 | 14.0% |
| 2 | Cut Bank | 3,028 | 339 | 14.0% |
| 4 | Malta | 2,100 | 218 | 13.0% |
| 5 | Glasgow | 3,190 | 306 | 12.0% |
| 5 | Ronan | 2,001 | 192 | 12.0% |
| 7 | Columbia Falls | 5,615 | 494 | 11.0% |
| 9 | Thompson Falls | 1,500 | 120 | 10.0% |
| 9 | Colstrip | 2,101 | 168 | 10.0% |
| 9 | Anaconda-Deer Lodge County | 9,597 | 768 | 10.0% |
| 9 | Eureka | 1,840 | 147 | 10.0% |
| 12 | East Helena | 1,702 | 123 | 9.0% |
| 12 | Havre | 9,258 | 667 | 9.0% |
| 16 | Conrad | 2,618 | 168 | 8.0% |
| 16 | Townsend | 1,967 | 126 | 8.0% |
| 16 | Chinook | 1,353 | 87 | 8.0% |
| 16 | Boulder | 1,284 | 82 | 8.0% |
| 16 | Great Falls | 60,329 | 3,861 | 8.0% |
| 23 | Miles City | 8,407 | 471 | 7.0% |
| 23 | Billings | 119,434 | 6,688 | 7.0% |
| 23 | Baker | 1,489 | 83 | 7.0% |
| 23 | Plains | 1,195 | 67 | 7.0% |
| 23 | Helena | 33,639 | 1,884 | 7.0% |
| 23 | Sidney | 6,171 | 346 | 7.0% |
| 23 | Columbus | 2,003 | 112 | 7.0% |
| 23 | Wolf Point | 2,602 | 146 | 7.0% |
| 23 | Laurel | 7,215 | 404 | 7.0% |
| 32 | Kalispell | 28,504 | 1,368 | 6.0% |
| 32 | Livingston | 8,780 | 421 | 6.0% |
| 32 | Hamilton | 5,101 | 245 | 6.0% |
| 32 | Choteau | 1,479 | 71 | 6.0% |
| 32 | Shelby | 3,216 | 154 | 6.0% |
| 32 | Polson | 5,428 | 261 | 6.0% |
| 32 | Dillon | 4,085 | 196 | 6.0% |
| 32 | Glendive | 4,810 | 231 | 6.0% |
| 32 | Hardin | 3,742 | 180 | 6.0% |
| 32 | Libby | 3,042 | 146 | 6.0% |
| 39 | Harlowton | 1,058 | 42 | 5.0% |
| 39 | Whitehall | 1,156 | 46 | 5.0% |
| 39 | Roundup | 2,003 | 80 | 5.0% |
| 43 | Fort Benton | 1,474 | 47 | 4.0% |
| 43 | Belgrade | 11,872 | 380 | 4.0% |
| 43 | Missoula | 76,514 | 2,448 | 4.0% |
| 43 | Manhattan | 2,288 | 73 | 4.0% |
| 43 | Whitefish | 8,749 | 280 | 4.0% |
| 43 | Stevensville | 2,130 | 68 | 4.0% |
| 48 | Big Timber | 1,611 | 39 | 3.0% |
| 48 | Red Lodge | 2,502 | 60 | 3.0% |
| 48 | Three Forks | 1,919 | 46 | 3.0% |
| 48 | Plentywood | 1,654 | 40 | 3.0% |
| 51 | Forsyth | 1,728 | 28 | 2.0% |
| 52 | Bozeman | 56,114 | 449 | 1.0% |
| 53 | West Yellowstone | 1,474 | 0 | 0.0% |
Source: U.S. Census ACS 2020-2024. 53 cities with more than 1,000 residents.
Summary
Getting Some Closure In Montana After Untying The Knot
We now have a sense of what places in the Treasure State don’t pay much attention to the whole “’til death do we part” phrase.
The cities with the highest divorce rate in Montana are Lewistown, Deer Lodge, Cut Bank, Malta, Glasgow, Ronan, Columbia Falls, Thompson Falls, Colstrip, and Anaconda-Deer Lodge County.
Try to keep in mind that the reason cities rank where they do in Montana could be because of the age, education, and income distribution, as all of those things impact the rate of divorce.