Kalispell, MT
Demographics And Statistics
Living In Kalispell, Montana Summary
Life in Kalispell research summary. HomeSnacks has been using Saturday Night Science to research the quality of life in Kalispell over the past nine years using Census, FBI, Zillow, and other primary data sources. Based on the most recently available data, we found the following about life in Kalispell:
The population in Kalispell is 26,830.
The median home value in Kalispell is $549,043.
The median income in Kalispell is $61,590.
The cost of living in Kalispell is 109 which is 1.1x higher than the national average.
The median rent in Kalispell is $1,019.
The unemployment rate in Kalispell is 3.6%.
The poverty rate in Kalispell is 10.3%.
The average high in Kalispell is 55.4° and the average low is 32.6°.
Kalispell SnackAbility
Overall SnackAbility
Kalispell, MT Crime Report
Crime in Kalispell summary. We use data from the FBI to determine the crime rates in Kalispell. Key points include:
There were 800 total crimes in Kalispell in the last reporting year.
The overall crime rate per 100,000 people in Kalispell is 2,519.4 / 100k people.
The violent crime rate per 100,000 people in Kalispell is 292.9 / 100k people.
The property crime rate per 100,000 people in Kalispell is 2,226.5 / 100k people.
Overall, crime in Kalispell is 18.88% above the national average.
Total Crimes
Above National Average
Crime In Kalispell Comparison Table
| Statistic | Count Raw |
Kalispell / 100k People |
Montana / 100k People |
National / 100k People |
|---|---|---|---|---|
| Total Crimes Per 100K | 800 | 2,519.4 | 2,040.7 | 2,119.2 |
| Violent Crime | 93 | 292.9 | 423.5 | 359.0 |
| Murder | 0 | 0.0 | 2.7 | 5.0 |
| Robbery | 2 | 6.3 | 19.1 | 61.0 |
| Aggravated Assault | 77 | 242.5 | 342.5 | 256.0 |
| Property Crime | 707 | 2,226.5 | 1,617.3 | 1,760.0 |
| Burglary | 40 | 126.0 | 167.2 | 229.0 |
| Larceny | 626 | 1,971.4 | 1,286.0 | 1,272.0 |
| Car Theft | 41 | 129.1 | 164.0 | 259.0 |
Kalispell, MT Cost Of Living
Cost of living in Kalispell summary. We use data on the cost of living to determine how expensive it is to live in Kalispell. Real estate prices drive most of the variance in cost of living around Montana. Key points include:
The cost of living in Kalispell is 109 with 100 being average.
The cost of living in Kalispell is 1.1x higher than the national average.
The median home value in Kalispell is $549,043.
The median income in Kalispell is $61,590.
Kalispell's Overall Cost Of Living
Higher Than The National Average
Cost Of Living In Kalispell Comparison Table
| Living Expense | Kalispell | Montana | National Average | |
|---|---|---|---|---|
| Overall | 109 | 101 | 100 | |
| Services | 101 | 104 | 100 | |
| Groceries | 110 | 102 | 100 | |
| Health | 110 | 99 | 100 | |
| Housing | 117 | 100 | 100 | |
| Transportation | 119 | 107 | 100 | |
| Utilities | 99 | 95 | 100 | |
Kalispell, MT Weather
The average high in Kalispell is 55.4° and the average low is 32.6°.
There are 54.1 days of precipitation each year.
Expect an average of 15.8 inches of precipitation each year with 55.8 inches of snow.
| Stat | Kalispell |
|---|---|
| Average Annual High | 55.4 |
| Average Annual Low | 32.6 |
| Annual Precipitation Days | 54.1 |
| Average Annual Precipitation | 15.8 |
| Average Annual Snowfall | 55.8 |
Average High
Days of Rain
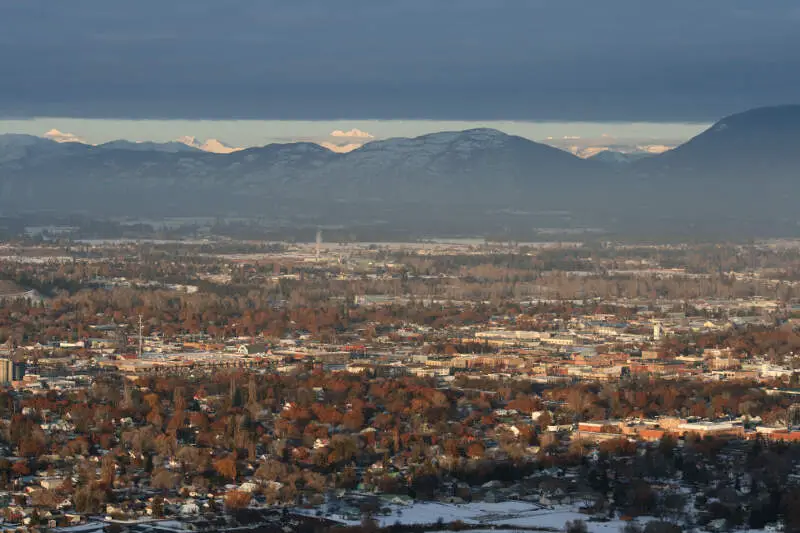
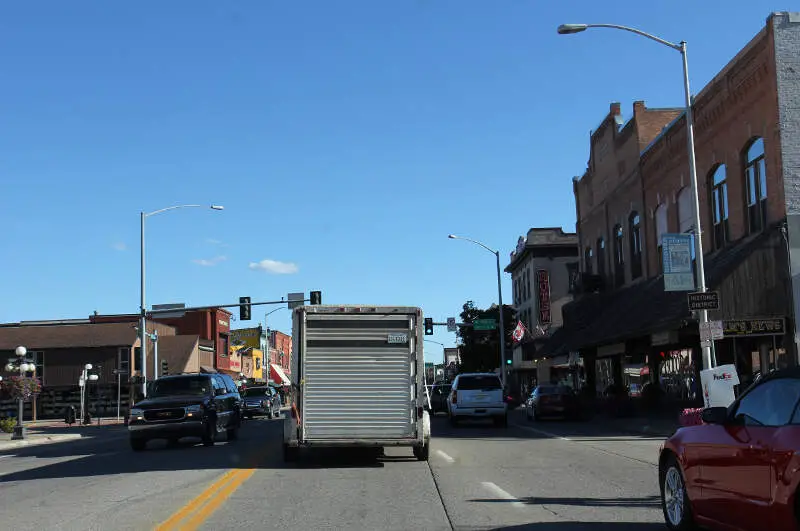
Kalispell, MT Photos
1 Reviews & Comments About Kalispell
/5

HomeSnacks User - 2018-07-15 23:26:06.752525
I think it's an understatement to say that visiting Kalispell for about a month was the best experience of my life as it is truly a beautiful place. I loved visiting Glacier National Park that is literally ten minutes away from the city and the local campus of the University Of Montana is nearby as well and it is rated as one of the top colleges in the nation. Also just being surrounded by the beautiful mountains and scenery around me made me feel relaxed and calm.
What stood out out to me the most were the beautiful scenery and nature and wildlife that the city of Kalispell had to offer and therefore I have to say it was a great experience and nothing was bad about it.
Rankings for Kalispell in Montana


Locations Around Kalispell
Map Of Kalispell, MT
Best Places Around Kalispell
Forest Hill, TX
Population 13,923
Whitefish, MT
Population 8,422
Evergreen, MT
Population 8,908
Columbia Falls, MT
Population 5,531
Kalispell Demographics And Statistics
Population over time in Kalispell
The current population in Kalispell is 26,830. The population has increased 39.0% from 2010.
| Year | Population | % Change |
|---|---|---|
| 2023 | 26,830 | 5.3% |
| 2022 | 25,473 | 5.0% |
| 2021 | 24,260 | 1.4% |
| 2020 | 23,935 | 3.0% |
| 2019 | 23,241 | 2.7% |
| 2018 | 22,621 | 2.9% |
| 2017 | 21,992 | 1.7% |
| 2016 | 21,619 | 2.3% |
| 2015 | 21,142 | 2.5% |
| 2014 | 20,629 | 1.7% |
| 2013 | 20,294 | 1.4% |
| 2012 | 20,016 | 1.8% |
| 2011 | 19,654 | 1.8% |
| 2010 | 19,298 | - |
Race / Ethnicity in Kalispell
Kalispell is:
88.1% White with 23,635 White residents.
0.3% African American with 69 African American residents.
1.0% American Indian with 266 American Indian residents.
1.4% Asian with 389 Asian residents.
0.0% Hawaiian with 0 Hawaiian residents.
0.1% Other with 31 Other residents.
4.1% Two Or More with 1,090 Two Or More residents.
5.0% Hispanic with 1,350 Hispanic residents.
| Race | Kalispell | MT | USA |
|---|---|---|---|
| White | 88.1% | 84.1% | 58.2% |
| African American | 0.3% | 0.5% | 12.0% |
| American Indian | 1.0% | 5.5% | 0.5% |
| Asian | 1.4% | 0.8% | 5.7% |
| Hawaiian | 0.0% | 0.0% | 0.2% |
| Other | 0.1% | 0.4% | 0.5% |
| Two Or More | 4.1% | 4.3% | 3.9% |
| Hispanic | 5.0% | 4.4% | 19.0% |
Gender in Kalispell
Kalispell is 52.2% female with 14,014 female residents.
Kalispell is 47.8% male with 12,816 male residents.
| Gender | Kalispell | MT | USA |
|---|---|---|---|
| Female | 52.2% | 49.3% | 50.5% |
| Male | 47.8% | 50.7% | 49.5% |
Highest level of educational attainment in Kalispell for adults over 25
0.0% of adults in Kalispell completed < 9th grade.
3.0% of adults in Kalispell completed 9-12th grade.
27.0% of adults in Kalispell completed high school / ged.
25.0% of adults in Kalispell completed some college.
12.0% of adults in Kalispell completed associate's degree.
22.0% of adults in Kalispell completed bachelor's degree.
7.0% of adults in Kalispell completed master's degree.
2.0% of adults in Kalispell completed professional degree.
2.0% of adults in Kalispell completed doctorate degree.
| Education | Kalispell | MT | USA |
|---|---|---|---|
| < 9th Grade | 0.0% | 1.0% | 5.0% |
| 9-12th Grade | 3.0% | 4.0% | 6.0% |
| High School / GED | 27.0% | 28.0% | 26.0% |
| Some College | 25.0% | 22.0% | 19.0% |
| Associate's Degree | 12.0% | 10.0% | 9.0% |
| Bachelor's Degree | 22.0% | 23.0% | 21.0% |
| Master's Degree | 7.0% | 8.0% | 10.0% |
| Professional Degree | 2.0% | 2.0% | 2.0% |
| Doctorate Degree | 2.0% | 2.0% | 2.0% |
Household Income For Kalispell, Montana
2.6% of households in Kalispell earn Less than $10,000.
5.6% of households in Kalispell earn $10,000 to $14,999.
10.5% of households in Kalispell earn $15,000 to $24,999.
8.8% of households in Kalispell earn $25,000 to $34,999.
15.2% of households in Kalispell earn $35,000 to $49,999.
17.0% of households in Kalispell earn $50,000 to $74,999.
14.8% of households in Kalispell earn $75,000 to $99,999.
14.3% of households in Kalispell earn $100,000 to $149,999.
5.5% of households in Kalispell earn $150,000 to $199,999.
5.7% of households in Kalispell earn $200,000 or more.
| Income | Kalispell | MT | USA |
|---|---|---|---|
| Less than $10,000 | 2.6% | 4.4% | 4.9% |
| $10,000 to $14,999 | 5.6% | 3.8% | 3.6% |
| $15,000 to $24,999 | 10.5% | 7.5% | 6.6% |
| $25,000 to $34,999 | 8.8% | 8.0% | 6.8% |
| $35,000 to $49,999 | 15.2% | 12.1% | 10.4% |
| $50,000 to $74,999 | 17.0% | 17.8% | 15.7% |
| $75,000 to $99,999 | 14.8% | 13.7% | 12.7% |
| $100,000 to $149,999 | 14.3% | 16.8% | 17.4% |
| $150,000 to $199,999 | 5.5% | 7.7% | 9.3% |
| $200,000 or more | 5.7% | 8.1% | 12.6% |


