Missoula SnackAbility
Overall SnackAbility
Crime in Missoula summary. We use data from the FBI to determine the crime rates in Missoula. Key points include:
There were 3,335 total crimes in Missoula in the last reporting year.
The overall crime rate per 100,000 people in Missoula is 4,226.3 / 100k people.
The violent crime rate per 100,000 people in Missoula is 596.9 / 100k people.
The property crime rate per 100,000 people in Missoula is 3,629.4 / 100k people.
Overall, crime in Missoula is 99.42% above the national average.
Total Crimes
Above National Average
Crime In Missoula Comparison Table
| Statistic | Count Raw | Missoula / 100k People | Montana / 100k People | National / 100k People |
|---|---|---|---|---|
| Total Crimes Per 100K | 3,335 | 4,226.3 | 2,040.7 | 2,119.2 |
| Violent Crime | 471 | 596.9 | 423.5 | 359.0 |
| Murder | 2 | 2.5 | 2.7 | 5.0 |
| Robbery | 36 | 45.6 | 19.1 | 61.0 |
| Aggravated Assault | 349 | 442.3 | 342.5 | 256.0 |
| Property Crime | 2,864 | 3,629.4 | 1,617.3 | 1,760.0 |
| Burglary | 255 | 323.1 | 167.2 | 229.0 |
| Larceny | 2,453 | 3,108.6 | 1,286.0 | 1,272.0 |
| Car Theft | 156 | 197.7 | 164.0 | 259.0 |
Source: FBI Uniform Crime Reporting (2024)
Cost of living in Missoula summary. We use data on the cost of living to determine how expensive it is to live in Missoula. Real estate prices drive most of the variance in cost of living around Montana. Key points include:
The cost of living in Missoula is 115 with 100 being average.
The cost of living in Missoula is 1.1x higher than the national average.
The median home value in Missoula is $564,622.
The median income in Missoula is $70,392.
Missoula's Overall Cost Of Living
Higher Than The National Average
Cost Of Living In Missoula Comparison Table
| Living Expense | Missoula | Montana | National Average |
|---|---|---|---|
| Overall | 115 | 102 | 100 |
| Services | 103 | 104 | 100 |
| Groceries | 104 | 103 | 100 |
| Health | 141 | 101 | 100 |
| Housing | 99 | 99 | 100 |
| Transportation | 101 | 105 | 100 |
| Utilities | 102 | 100 | 100 |
Source: Cost of living index, normalized to US average = 100
Missoula, MT Weather
The average high in Missoula is 57.0° and the average low is 32.7°.
There are 50.7 days of precipitation each year.
Expect an average of 15.6 inches of precipitation each year with 42.7 inches of snow.
| Stat | Missoula |
|---|---|
| Average Annual High | 57.0 |
| Average Annual Low | 32.7 |
| Annual Precipitation Days | 50.7 |
| Average Annual Precipitation | 15.6 |
| Average Annual Snowfall | 42.7 |
Average High
Days of Rain
Source: NOAA climate normals (30-year)
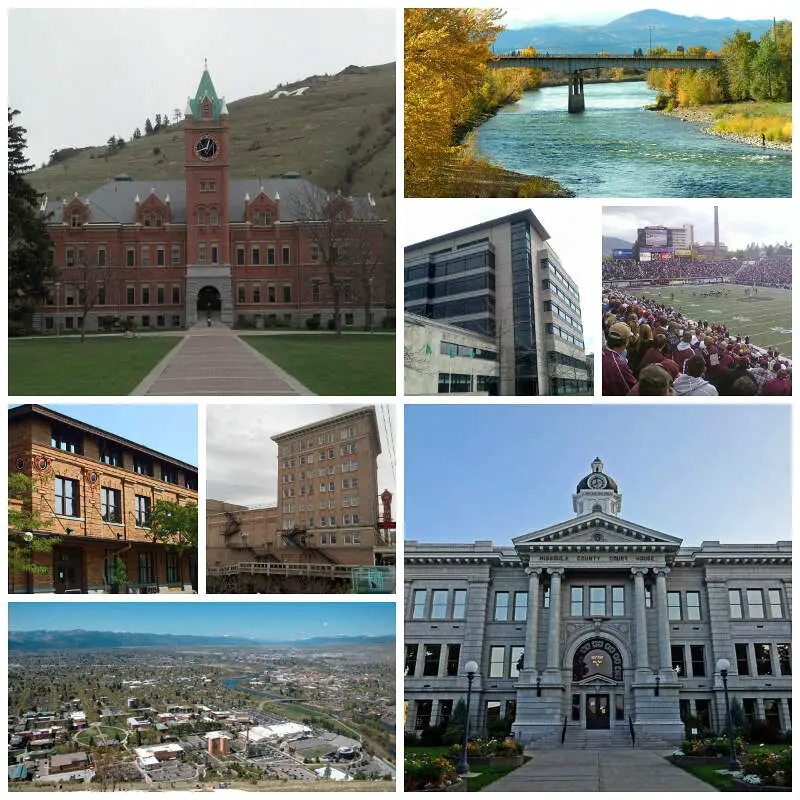
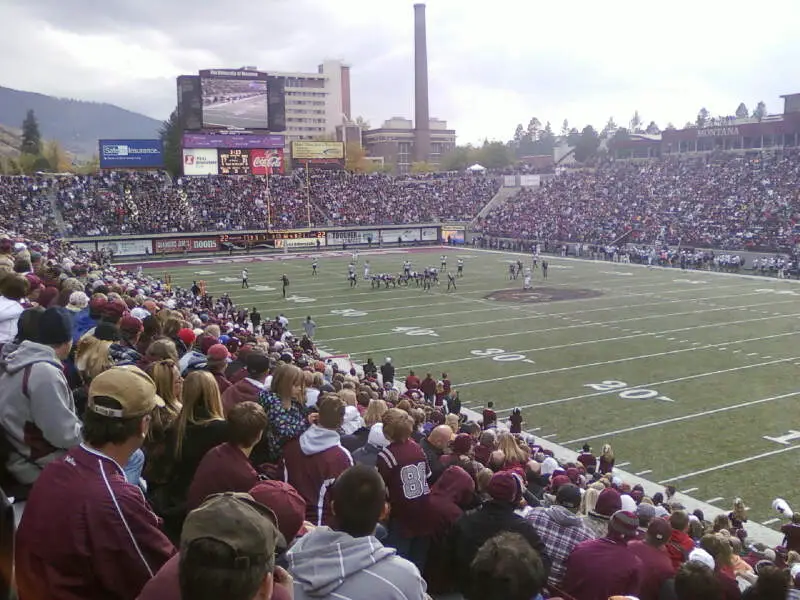
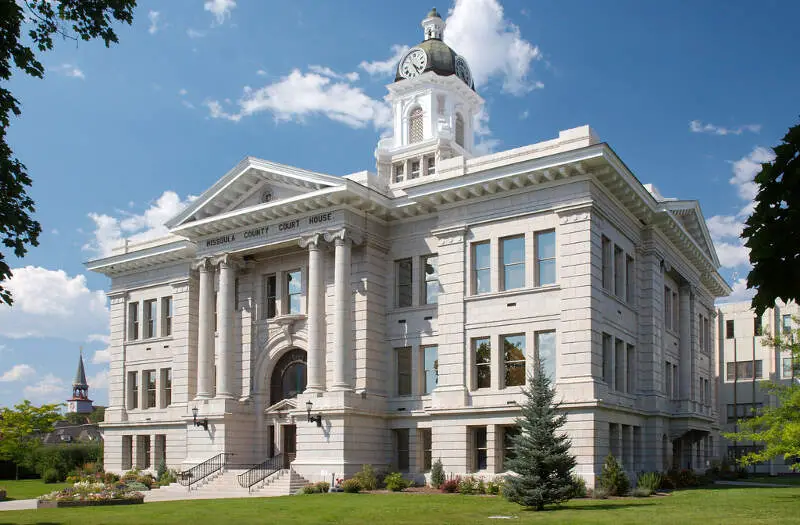
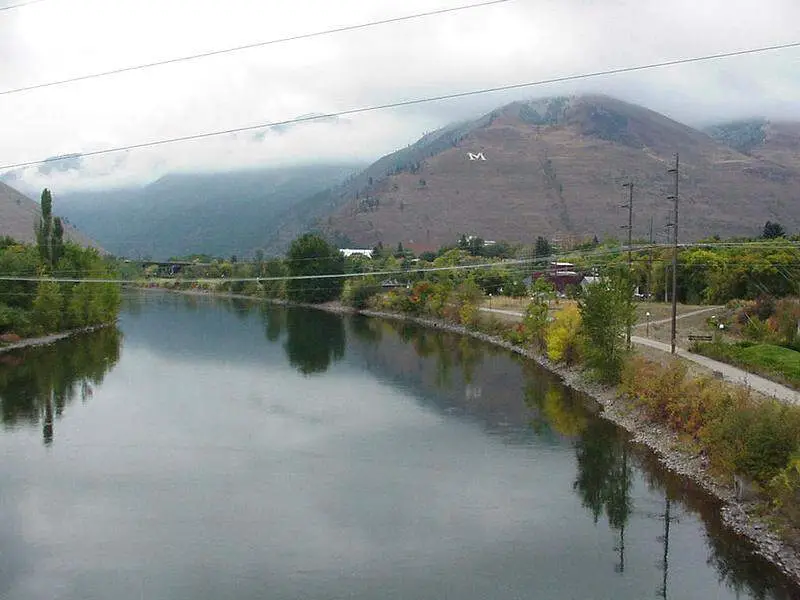
Missoula, MT Photos
3 Reviews & Comments About Missoula

I lived in Missoula, Montana for two years. I had moved there from Fresno, California. I saw more alcohol and drug abuse in Missoula than I ever saw in Fresno.
When I visited Missoula, MT at the age of ten, I had gone to visit a close aunt during my summer vacation. The city of Missoula was a bustling, mountainous area that was so scenic and beautiful, that it was breathtaking. I had never seen anything like it, and I am from the big city. I did not experience any crime or racism in the community of Missoula, MT. Everyone was incredibly friendly and there was a multitude of things to do. I love nature, so my aunt took me on many hiking and walking trails, while we walked her dog, Phoenix.
The area is a perfect place for families that prefer their privacy. Most homes were on a hill with a lot of grass to enclose each property. Basically, no loud, disruptive neighbors, which is a plus. If country living is not your thing, I would still suggest visiting Missoula, MT, just to experience the beautiful nature and the crisp fresh air. I have never breathed such clean air in my life.
My favorite places in Missoula, MT, are the hiking and walking trails. I love looking at beautiful nature. I feel in tune when I am around nature, animals and trees. I really love it. The only bad side to Missoula, MT, is the lack of diversity. I believe if more people knew about the scenic mountains, and beautiful landscapes, more groups of diverse cultures would visit, if not to see the views, but the hike the hills and smell the air. The air smells so pure.
Unless you live in Missoula. I love Missoula and the rest of Montana though!
Rankings & Articles For Missoula


Locations Around Missoula
Map Of Missoula, MT
Best Places Around Missoula
Orchard Homes, MT
Population 5,588
Missoula Demographics And Statistics
Population over time in Missoula
The current population in Missoula is 76,514. The population has increased 17.0% from 2010.
| Year | Population | % Change |
|---|---|---|
| 2024 | 76,514 | 1.2% |
| 2023 | 75,600 | 1.3% |
| 2022 | 74,627 | 1.8% |
| 2021 | 73,300 | -2.3% |
| 2020 | 74,994 | 1.7% |
| 2019 | 73,710 | 2.2% |
| 2018 | 72,125 | 1.8% |
| 2017 | 70,847 | 1.0% |
| 2016 | 70,117 | 1.3% |
| 2015 | 69,190 | 1.2% |
| 2014 | 68,377 | 1.0% |
| 2013 | 67,710 | 1.1% |
| 2012 | 66,982 | 1.2% |
| 2011 | 66,158 | 1.2% |
| 2010 | 65,383 | - |
Race / Ethnicity in Missoula
See the full breakdown
Missoula is:
84.7% White with 64,836 White residents.
0.4% African American with 319 African American residents.
1.9% American Indian with 1,420 American Indian residents.
1.1% Asian with 864 Asian residents.
0.1% Hawaiian with 53 Hawaiian residents.
0.5% Other with 391 Other residents.
5.5% Two Or More with 4,240 Two Or More residents.
5.7% Hispanic with 4,391 Hispanic residents.
| Race | Missoula | MT | USA |
|---|---|---|---|
| White | 84.7% | 83.6% | 57.4% |
| African American | 0.4% | 0.4% | 11.9% |
| American Indian | 1.9% | 5.3% | 0.5% |
| Asian | 1.1% | 0.8% | 5.9% |
| Hawaiian | 0.1% | 0.0% | 0.2% |
| Other | 0.5% | 0.5% | 0.6% |
| Two Or More | 5.5% | 4.7% | 4.3% |
| Hispanic | 5.7% | 4.6% | 19.3% |
Gender in Missoula
See the full breakdown
Missoula is 51.1% female with 39,070 female residents.
Missoula is 48.9% male with 37,444 male residents.
| Gender | Missoula | MT | USA |
|---|---|---|---|
| Female | 51.1% | 49.3% | 50.5% |
| Male | 48.9% | 50.7% | 49.5% |
Highest level of educational attainment in Missoula for adults over 25
See the full breakdown
1.0% of adults in Missoula completed < 9th grade.
2.0% of adults in Missoula completed 9-12th grade.
16.0% of adults in Missoula completed high school / ged.
20.0% of adults in Missoula completed some college.
8.0% of adults in Missoula completed associate's degree.
32.0% of adults in Missoula completed bachelor's degree.
14.0% of adults in Missoula completed master's degree.
4.0% of adults in Missoula completed professional degree.
3.0% of adults in Missoula completed doctorate degree.
| Education | Missoula | MT | USA |
|---|---|---|---|
| < 9th Grade | 1.0% | 1.0% | 4.0% |
| 9-12th Grade | 2.0% | 4.0% | 6.0% |
| High School / GED | 16.0% | 28.0% | 26.0% |
| Some College | 20.0% | 22.0% | 19.0% |
| Associate's Degree | 8.0% | 10.0% | 9.0% |
| Bachelor's Degree | 32.0% | 23.0% | 22.0% |
| Master's Degree | 14.0% | 8.0% | 10.0% |
| Professional Degree | 4.0% | 2.0% | 2.0% |
| Doctorate Degree | 3.0% | 2.0% | 2.0% |
Household Income For Missoula, Montana
See the full breakdown
4.0% of households in Missoula earn Less than $10,000.
4.7% of households in Missoula earn $10,000 to $14,999.
7.6% of households in Missoula earn $15,000 to $24,999.
8.1% of households in Missoula earn $25,000 to $34,999.
11.8% of households in Missoula earn $35,000 to $49,999.
16.3% of households in Missoula earn $50,000 to $74,999.
13.9% of households in Missoula earn $75,000 to $99,999.
17.0% of households in Missoula earn $100,000 to $149,999.
7.7% of households in Missoula earn $150,000 to $199,999.
8.9% of households in Missoula earn $200,000 or more.
| Income | Missoula | MT | USA |
|---|---|---|---|
| Less than $10,000 | 4.0% | 4.2% | 5.0% |
| $10,000 to $14,999 | 4.7% | 3.7% | 3.4% |
| $15,000 to $24,999 | 7.6% | 7.0% | 6.3% |
| $25,000 to $34,999 | 8.1% | 7.6% | 6.6% |
| $35,000 to $49,999 | 11.8% | 11.8% | 10.1% |
| $50,000 to $74,999 | 16.3% | 17.3% | 15.5% |
| $75,000 to $99,999 | 13.9% | 13.6% | 12.6% |
| $100,000 to $149,999 | 17.0% | 17.4% | 17.5% |
| $150,000 to $199,999 | 7.7% | 8.2% | 9.6% |
| $200,000 or more | 8.9% | 9.0% | 13.4% |
Source: U.S. Census ACS 5-year estimates (2024)


