
Racial diversity in Hawaii is a mixed bag.
There are parts of Hawaii where there’s a high level of diversity. But where will you find the most diverse places in Hawaii?
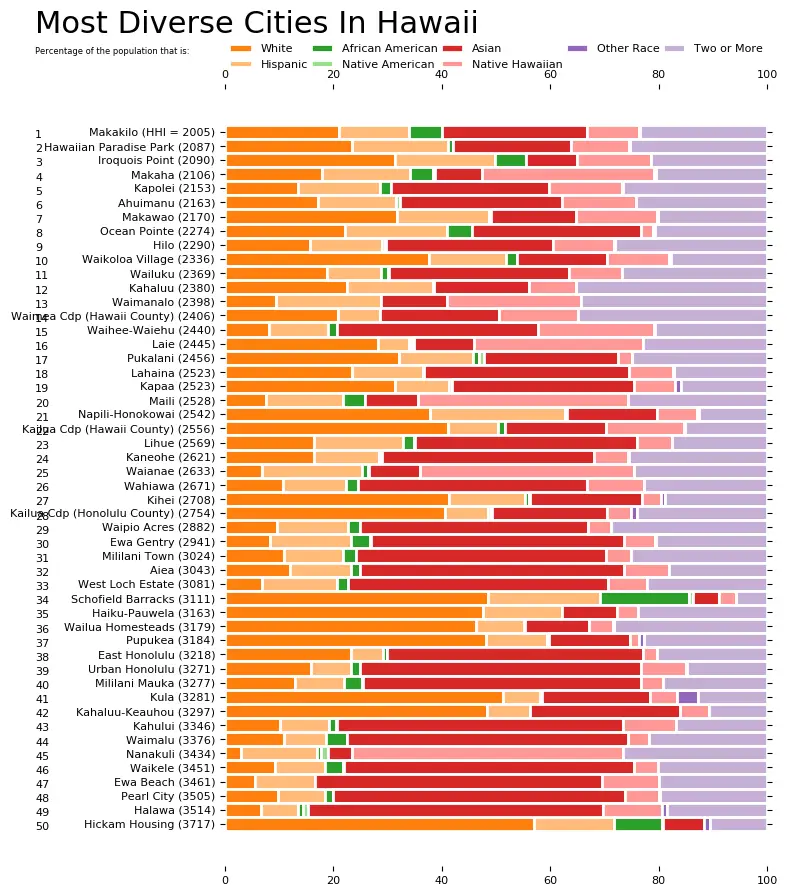
To answer that question, we went to the US Census data. Using Saturday Night Science, we measured the Gini coefficient for all 55 cities in Hawaii to rank them from most to least diverse.
Table Of Contents: Top Ten | Methodology | Summary | Table
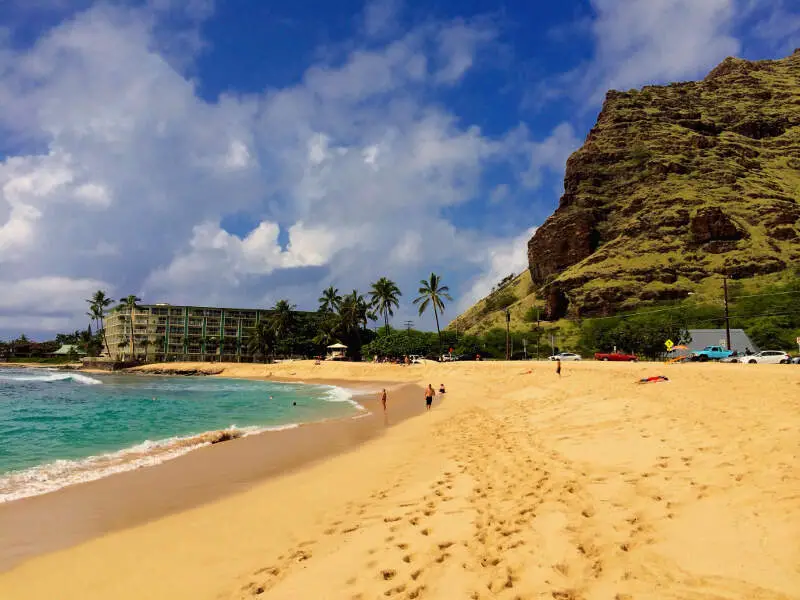
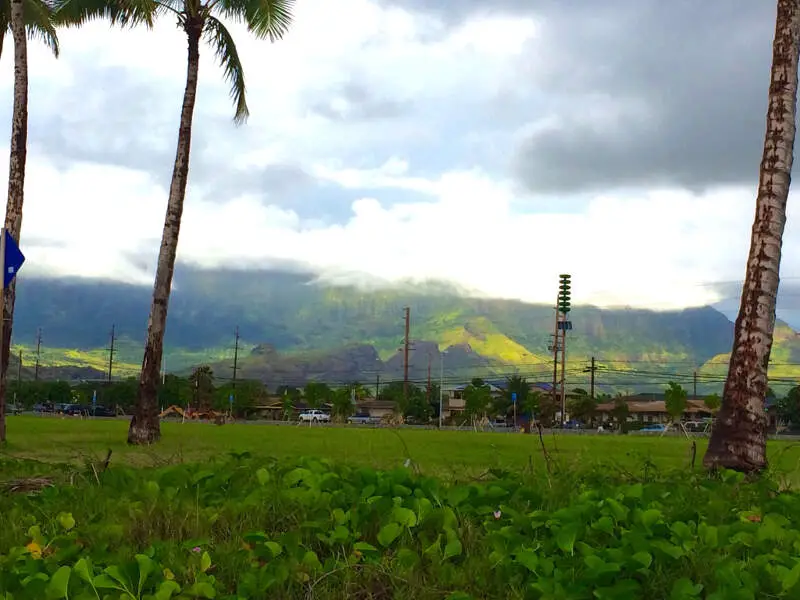
So what city is the most diverse in Hawaii? According to the most Census data, Makaha took the number one over all spot for diversity in Hawaii.
Read on below to see how we crunched the numbers and how your town ranked. To see where Hawaii ranked as a state, we have a ranking of the most diverse states in Ameria.
For more Hawaii reading:
The 10 Most Diverse Places In Hawaii For 2025

/10
Population: 9,898
HHI: 1,997
% White: 20.5%
% African American: 3.9%
% Hispanic: 14.4%
% Asian: 10.1%
More on Makaha: Data

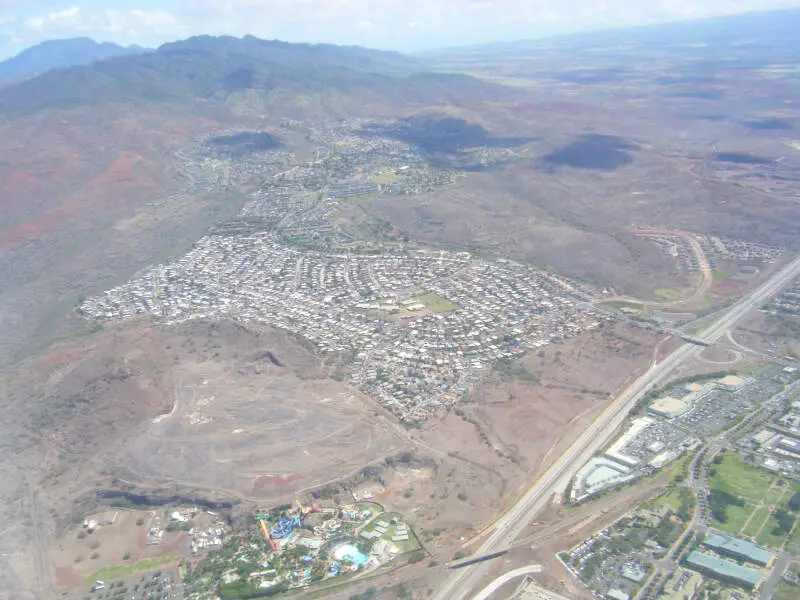
/10
Population: 23,033
HHI: 2,052
% White: 13.6%
% African American: 3.1%
% Hispanic: 17.0%
% Asian: 25.9%
More on Kapolei: Data

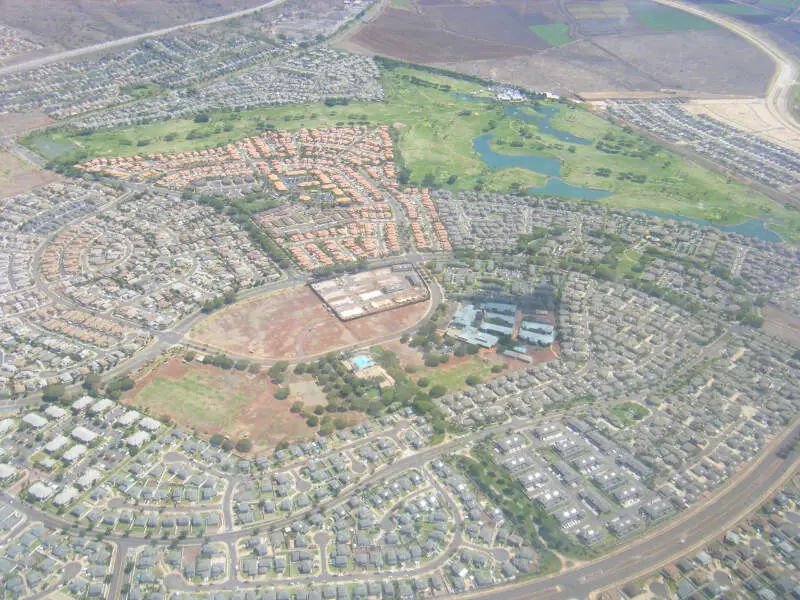
/10
Population: 20,372
HHI: 2,121
% White: 18.1%
% African American: 5.6%
% Hispanic: 14.1%
% Asian: 30.6%
More on Makakilo: Data

/10
Population: 13,273
HHI: 2,132
% White: 25.3%
% African American: 1.4%
% Hispanic: 13.6%
% Asian: 21.6%
More on Hawaiian Paradise Park: Data
/10
Population: 5,506
HHI: 2,152
% White: 33.3%
% African American: 5.2%
% Hispanic: 16.0%
% Asian: 13.3%
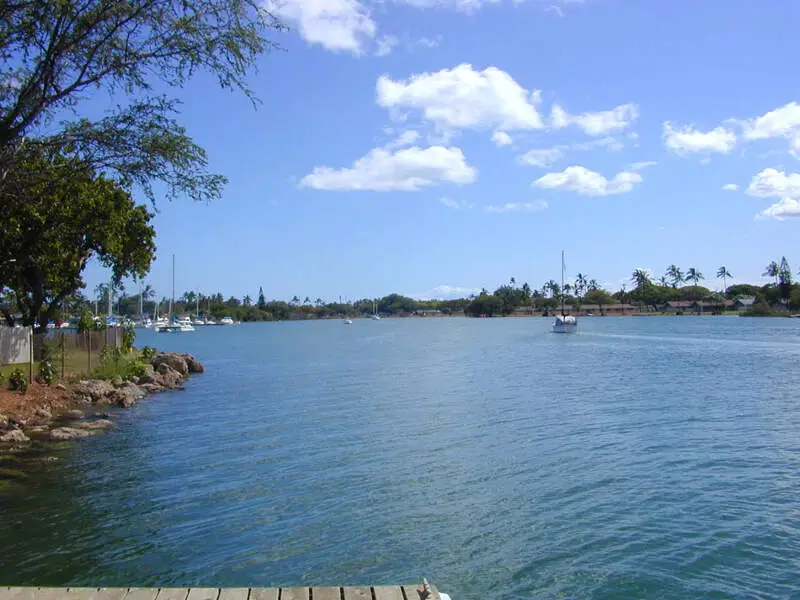
More on Iroquois Point:

/10
Population: 7,263
HHI: 2,163
% White: 29.0%
% African American: 0.2%
% Hispanic: 14.1%
% Asian: 16.7%
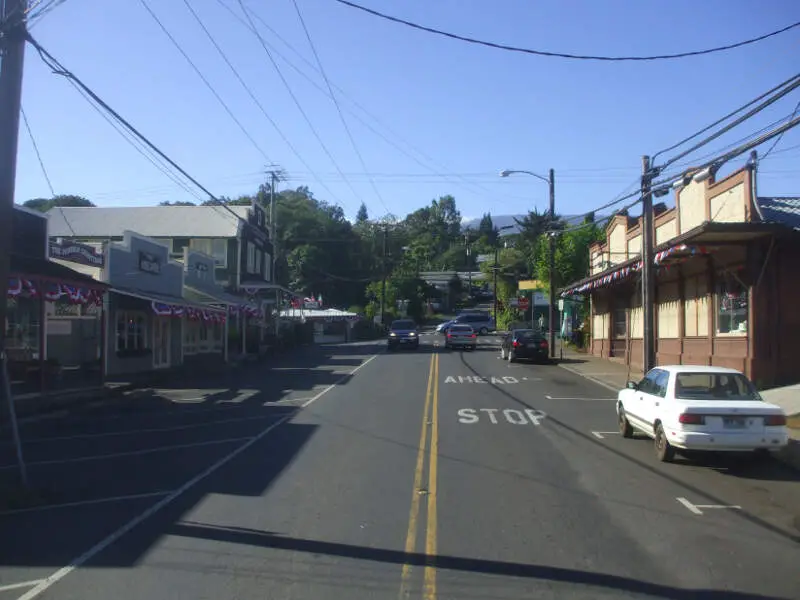
More on Makawao: Data

/10
Population: 8,520
HHI: 2,248
% White: 18.2%
% African American: 0.0%
% Hispanic: 13.6%
% Asian: 29.4%
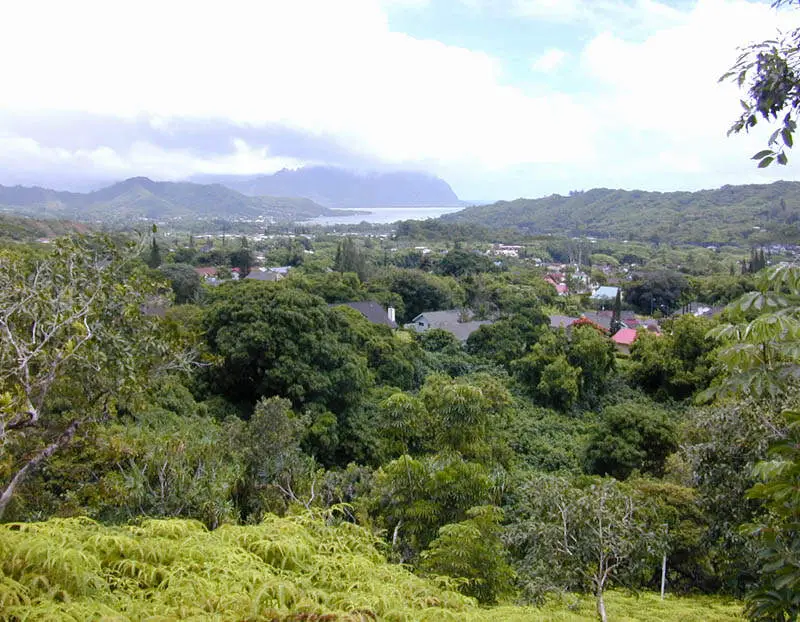
More on Ahuimanu: Data

/10
Population: 48,223
HHI: 2,268
% White: 15.6%
% African American: 0.8%
% Hispanic: 11.4%
% Asian: 31.5%
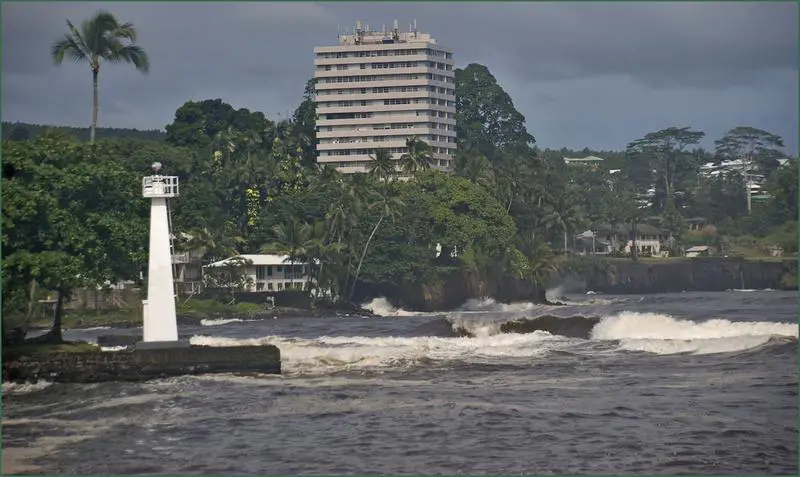
More on Hilo: Data

/10
Population: 12,236
HHI: 2,342
% White: 7.9%
% African American: 5.4%
% Hispanic: 13.5%
% Asian: 11.5%
More on Maili: Data

/10
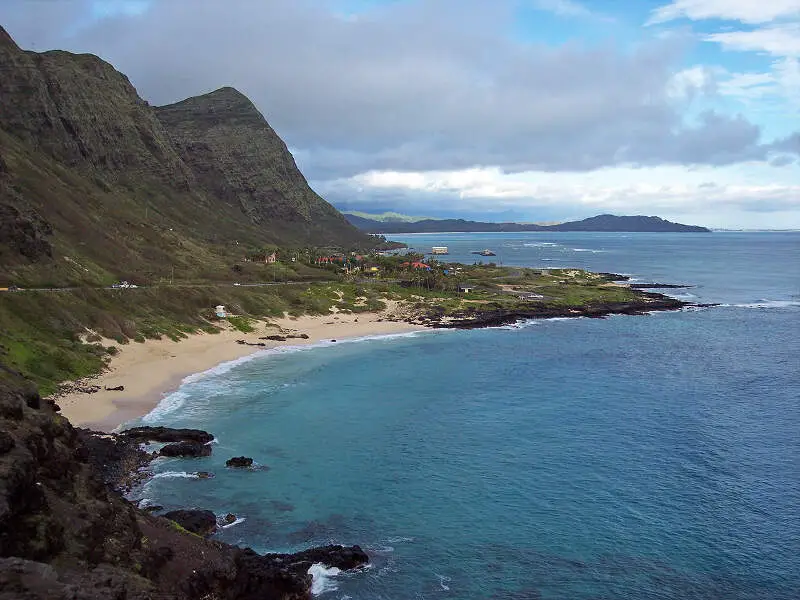
Population: 5,634
HHI: 2,368
% White: 8.8%
% African American: 0.0%
% Hispanic: 18.6%
% Asian: 14.4%
More on Waimanalo: Data
Methodology: How we determined the most diverse cities in Hawaii for 2025
We still believe in the accuracy of data — especially from the Census — and Saturday Night Science. So that’s where we went to get the race breakdown across Hawaii.
That leads us to the Census’s most recently available data, the 2019-2023 American Community Survey data from the US Census.
Specifically, we looked at table B03002: HISPANIC OR LATINO ORIGIN BY RACE. Here are the category names as defined by the Census:
- White alone*
- Black or African American alone*
- American Indian and Alaska Native alone*
- Asian alone*
- Native Hawaiian and Other Pacific Islander alone*
- Some other race alone*
- Two or more races*
- Hispanic or Latino
We limited our analysis to non-CDPs with a population greater than 5,000 people. That left us with 55 cities.
We then calculated the HHI for each city by finding the racial breakdown of a city in percent terms, squaring them, and then adding the squares together. This left us with scores ranging from 1,997 (Makaha) to 5,189 (Wailea).
Finally, we ranked each city based on the HHI, with a lower score being more diverse than a high score. Makaha took the distinction of being the most diverse, while Wailea was the least diverse city.
We updated this article for 2025. This report is our tenth time ranking the most diverse places in Hawaii.
Summary: Diversity Across Hawaii
If you’re looking for a scientific breakdown of diversity across Hawaii, this is an accurate list.
The most diverse cities in Hawaii are Makaha, Kapolei, Makakilo, Hawaiian Paradise Park, Iroquois Point, Makawao, Ahuimanu, Hilo, Maili, and Waimanalo.
If you’re curious enough, here are the least diverse places in Hawaii:
- Wailea
- Waipahu
- Ewa Villages
For more Hawaii reading, check out:
Race By City In Hawaii For 2025
| Rank | City | Population | HHI | % White | % Black | % Hispanic | % Asian |
|---|---|---|---|---|---|---|---|
| 1 | Makaha, HI | 9,898 | 1,997 | 20.5% | 3.9% | 14.4% | 10.1% |
| 2 | Kapolei, HI | 23,033 | 2,052 | 13.6% | 3.1% | 17.0% | 25.9% |
| 3 | Makakilo, HI | 20,372 | 2,121 | 18.1% | 5.6% | 14.1% | 30.6% |
| 4 | Hawaiian Paradise Park, HI | 13,273 | 2,132 | 25.3% | 1.4% | 13.6% | 21.6% |
| 5 | Iroquois Point, HI | 5,506 | 2,152 | 33.3% | 5.2% | 16.0% | 13.3% |
| 6 | Makawao, HI | 7,263 | 2,163 | 29.0% | 0.2% | 14.1% | 16.7% |
| 7 | Ahuimanu, HI | 8,520 | 2,248 | 18.2% | 0.0% | 13.6% | 29.4% |
| 8 | Hilo, HI | 48,223 | 2,268 | 15.6% | 0.8% | 11.4% | 31.5% |
| 9 | Maili, HI | 12,236 | 2,342 | 7.9% | 5.4% | 13.5% | 11.5% |
| 10 | Waimanalo, HI | 5,634 | 2,368 | 8.8% | 0.0% | 18.6% | 14.4% |
| 11 | Napili-Honokowai, HI | 6,897 | 2,370 | 35.1% | 0.5% | 18.2% | 22.4% |
| 12 | Ocean Pointe, HI | 16,276 | 2,381 | 23.7% | 4.6% | 15.1% | 33.1% |
| 13 | Pukalani, HI | 8,490 | 2,401 | 29.1% | 1.4% | 16.0% | 21.2% |
| 14 | Waimea Cdp (Hawaii County), HI | 10,242 | 2,410 | 19.9% | 0.0% | 8.2% | 24.1% |
| 15 | Lihue, HI | 7,847 | 2,416 | 17.7% | 2.4% | 15.2% | 38.7% |
| 16 | Laie, HI | 5,568 | 2,446 | 26.6% | 0.4% | 4.1% | 12.4% |
| 17 | Kahaluu, HI | 5,282 | 2,483 | 23.4% | 0.0% | 13.4% | 17.1% |
| 18 | Wailuku, HI | 15,754 | 2,498 | 21.1% | 1.0% | 7.3% | 35.1% |
| 19 | Waihee-Waiehu, HI | 11,369 | 2,561 | 6.7% | 1.7% | 9.2% | 38.2% |
| 20 | Kapaa, HI | 10,886 | 2,597 | 31.9% | 0.5% | 8.4% | 34.1% |
| 21 | Lahaina, HI | 11,423 | 2,628 | 25.0% | 0.4% | 11.3% | 38.3% |
| 22 | Wahiawa, HI | 17,515 | 2,646 | 10.1% | 2.6% | 14.2% | 42.0% |
| 23 | Kaneohe, HI | 35,945 | 2,653 | 15.7% | 0.5% | 10.6% | 39.2% |
| 24 | Kailua Cdp (Hawaii County), HI | 21,851 | 2,677 | 41.4% | 0.2% | 6.2% | 18.0% |
| 25 | Kihei, HI | 22,564 | 2,717 | 41.3% | 1.3% | 13.4% | 20.2% |
| 26 | Waikoloa Village, HI | 7,028 | 2,770 | 45.4% | 2.0% | 11.7% | 13.7% |
| 27 | Waianae, HI | 12,907 | 2,789 | 7.2% | 0.9% | 12.6% | 10.4% |
| 28 | Ewa Gentry, HI | 26,738 | 2,822 | 9.8% | 3.3% | 14.4% | 45.5% |
| 29 | Kailua Cdp (Honolulu County), HI | 39,762 | 2,841 | 41.4% | 0.5% | 6.6% | 21.5% |
| 30 | Waipio Acres, HI | 5,146 | 2,855 | 11.8% | 2.6% | 13.7% | 41.6% |
| 31 | Heeia, HI | 5,099 | 2,928 | 18.7% | 0.0% | 4.6% | 43.1% |
| 32 | Wailua Homesteads, HI | 7,136 | 3,068 | 46.1% | 0.1% | 10.3% | 17.2% |
| 33 | West Loch Estate, HI | 6,441 | 3,075 | 3.4% | 2.1% | 13.0% | 46.1% |
| 34 | Schofield Barracks, HI | 16,755 | 3,111 | 48.5% | 18.0% | 19.1% | 5.2% |
| 35 | East Honolulu, HI | 50,961 | 3,139 | 23.4% | 0.6% | 5.4% | 45.7% |
| 36 | Mililani Town, HI | 27,495 | 3,159 | 9.6% | 1.6% | 10.7% | 47.4% |
| 37 | Mililani Mauka, HI | 21,967 | 3,177 | 12.7% | 1.9% | 9.3% | 49.4% |
| 38 | Kahaluu-Keauhou, HI | 6,670 | 3,261 | 49.3% | 0.4% | 8.0% | 23.4% |
| 39 | Kula, HI | 6,557 | 3,264 | 51.8% | 0.0% | 7.7% | 17.9% |
| 40 | Nanakuli, HI | 12,282 | 3,319 | 4.7% | 0.6% | 12.5% | 4.6% |
| 41 | Aiea, HI | 9,155 | 3,322 | 11.4% | 2.0% | 8.3% | 52.4% |
| 42 | Urban Honolulu, HI | 346,323 | 3,331 | 15.8% | 1.7% | 6.6% | 52.4% |
| 43 | Waimalu, HI | 14,176 | 3,433 | 11.3% | 3.5% | 8.0% | 53.4% |
| 44 | Pearl City, HI | 45,079 | 3,455 | 9.8% | 1.7% | 7.9% | 53.2% |
| 45 | Hickam Housing, HI | 9,195 | 3,458 | 54.4% | 9.1% | 14.1% | 6.5% |
| 46 | Haiku-Pauwela, HI | 9,290 | 3,464 | 51.6% | 0.0% | 11.8% | 8.4% |
| 47 | Halawa, HI | 13,809 | 3,533 | 8.1% | 0.5% | 6.7% | 54.8% |
| 48 | Kahului, HI | 27,068 | 3,564 | 10.2% | 0.9% | 6.8% | 55.0% |
| 49 | Waikele, HI | 7,950 | 3,581 | 8.1% | 2.2% | 6.7% | 52.8% |
| 50 | Ewa Beach, HI | 15,388 | 3,614 | 5.1% | 0.0% | 6.4% | 53.9% |
| 51 | Royal Kunia, HI | 13,687 | 3,823 | 6.7% | 2.1% | 8.7% | 58.0% |
| 52 | Waipio, HI | 11,196 | 3,905 | 6.3% | 0.6% | 7.1% | 57.4% |
| 53 | Ewa Villages, HI | 6,918 | 4,701 | 3.0% | 0.0% | 6.4% | 65.0% |
| 54 | Waipahu, HI | 39,871 | 4,825 | 2.8% | 0.2% | 6.2% | 67.1% |
| 55 | Wailea, HI | 6,571 | 5,189 | 70.2% | 1.0% | 8.0% | 11.4% |