
Most diverse cities in the United States summary. We used Saturday Night Science to dig into the most diverse cities in America for 2026. The data comes from the American Community Survey’s latest cohort. You can read the Census documentation for a breakdown of the nationalities in each race bucket. This report reflects our eleventh time ranking the most diverse cities in the United States.
-
The most diverse city in the United States is Oakland, CA, based on Census data.
-
The least diverse city in the United States is Laredo, TX, based on Census data.
-
The city with the highest non-white population is Laredo, TX (96.55% non-white).
-
The city with the largest white population is Boise City, ID (79.54% white).
-
The most diverse state in America is Hawaii.
We limited our analysis to the 100 biggest cities in America and defined diverse to be the cities with the lowest Herfindahl-Hirschman Index (HHI).
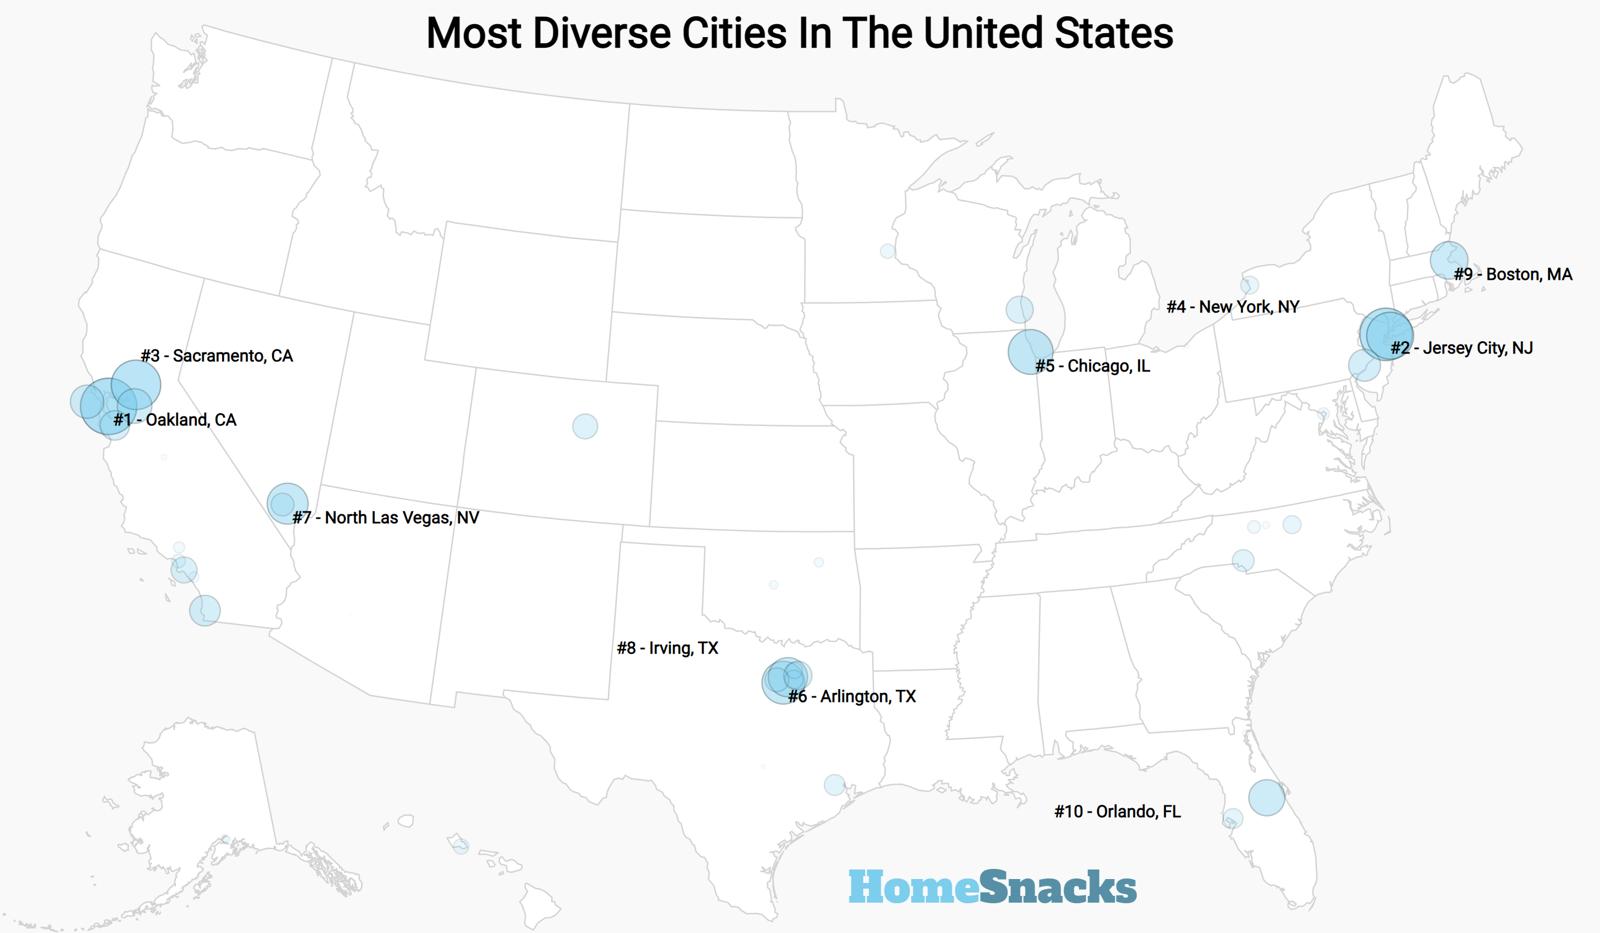
Table Of Contents: Table | Methodology | Summary
Related Research:
Richest Cities In America
Richest Places By State
Best Places By State
Table: Most Diverse Cities In America
| Rank | City | Population | HHI |
|---|---|---|---|
| 1 | Oakland, CA | 439,418 | 2,273 |
| 2 | Jersey City, NJ | 294,078 | 2,296 |
| 3 | Sacramento, CA | 528,706 | 2,316 |
| 4 | Enterprise, NV | 240,464 | 2,395 |
| 5 | New York, NY | 8,483,844 | 2,419 |
| 6 | Chicago, IL | 2,711,226 | 2,726 |
| 7 | Arlington, TX | 397,742 | 2,751 |
| 8 | Orlando, FL | 319,758 | 2,771 |
| 9 | North Las Vegas, NV | 278,595 | 2,793 |
| 10 | Boston, MA | 666,442 | 2,826 |
| 11 | Philadelphia, PA | 1,579,706 | 2,893 |
| 12 | San Francisco, CA | 830,235 | 2,898 |
| 13 | Irving, TX | 256,492 | 2,900 |
| 14 | Milwaukee, WI | 566,973 | 2,916 |
| 15 | San Diego, CA | 1,389,526 | 2,917 |
| 16 | Long Beach, CA | 455,548 | 2,917 |
| 17 | Charlotte, NC | 903,844 | 2,922 |
| 18 | Stockton, CA | 322,326 | 2,935 |
| 19 | Fort Worth, TX | 963,194 | 2,943 |
| 20 | Aurora, CO | 394,432 | 2,957 |
| 21 | Las Vegas, NV | 660,400 | 2,985 |
| 22 | San Jose, CA | 990,138 | 3,005 |
| 23 | Durham, NC | 291,467 | 3,014 |
| 24 | Buffalo, NY | 276,854 | 3,025 |
| 25 | Garland, TX | 246,844 | 3,040 |
| 26 | Houston, TX | 2,328,253 | 3,049 |
| 27 | Tampa, FL | 401,618 | 3,073 |
| 28 | Plano, TX | 290,594 | 3,099 |
| 29 | Dallas, TX | 1,307,930 | 3,120 |
| 30 | St. Paul, MN | 307,284 | 3,190 |
| 31 | Santa Clarita, CA | 230,221 | 3,209 |
| 32 | Tulsa, OK | 413,794 | 3,221 |
| 33 | Winston-Salem, NC | 252,037 | 3,224 |
| 34 | Los Angeles, CA | 3,857,263 | 3,237 |
| 35 | Washington, DC | 681,294 | 3,245 |
| 36 | Oklahoma City, OK | 697,125 | 3,245 |
| 37 | Jacksonville, FL | 977,670 | 3,261 |
| 38 | Greensboro, NC | 301,198 | 3,292 |
| 39 | Urban Honolulu, HI | 345,482 | 3,293 |
| 40 | Anchorage, AK | 288,976 | 3,320 |
| 41 | Irvine, CA | 311,690 | 3,342 |
| 42 | Norfolk, VA | 233,596 | 3,352 |
| 43 | Cleveland, OH | 366,097 | 3,375 |
| 44 | Austin, TX | 979,539 | 3,379 |
| 45 | Indianapolis, IN | 885,860 | 3,382 |
| 46 | Fresno, CA | 545,970 | 3,414 |
| 47 | Raleigh, NC | 481,031 | 3,496 |
| 48 | Port St. Lucie, FL | 232,491 | 3,496 |
| 49 | Richmond, VA | 229,359 | 3,497 |
| 50 | Phoenix, AZ | 1,642,323 | 3,500 |
| 51 | Newark, NJ | 310,178 | 3,523 |
| 52 | Columbus, OH | 914,802 | 3,545 |
| 53 | Glendale, AZ | 252,833 | 3,589 |
| 54 | Atlanta, GA | 505,268 | 3,598 |
| 55 | Chandler, AZ | 280,136 | 3,603 |
| 56 | Anaheim, CA | 344,521 | 3,685 |
| 57 | Cincinnati, OH | 311,224 | 3,716 |
| 58 | Albuquerque, NM | 562,218 | 3,735 |
| 59 | Kansas City, MO | 510,612 | 3,740 |
| 60 | Tucson, AZ | 547,073 | 3,752 |
| 61 | St. Louis, MO | 288,512 | 3,804 |
| 62 | Chesapeake, VA | 252,583 | 3,807 |
| 63 | Denver, CO | 718,877 | 3,810 |
| 64 | Henderson, NV | 332,141 | 3,811 |
| 65 | Arlington, VA | 236,254 | 3,839 |
| 66 | Bakersfield, CA | 411,986 | 3,852 |
| 67 | Lubbock, TX | 264,814 | 3,879 |
| 68 | Riverside, CA | 319,069 | 3,888 |
| 69 | New Orleans, LA | 371,853 | 3,898 |
| 70 | Seattle, WA | 754,195 | 3,932 |
| 71 | Reno, NV | 273,212 | 3,962 |
| 72 | Virginia Beach, VA | 456,349 | 3,962 |
| 73 | Minneapolis, MN | 427,246 | 3,964 |
| 74 | Toledo, OH | 267,463 | 3,992 |
| 75 | Wichita, KS | 397,945 | 4,047 |
| 76 | Louisville/jefferson County Metro Government (Balance), KY | 631,818 | 4,147 |
| 77 | Baltimore, MD | 573,243 | 4,189 |
| 78 | Chula Vista, CA | 276,375 | 4,208 |
| 79 | Fort Wayne, IN | 268,589 | 4,374 |
| 80 | Mesa, AZ | 511,764 | 4,382 |
| 81 | Pittsburgh, PA | 304,759 | 4,395 |
| 82 | St. Petersburg, FL | 262,732 | 4,417 |
| 83 | Omaha, NE | 488,837 | 4,444 |
| 84 | Memphis, TN | 618,980 | 4,546 |
| 85 | Portland, OR | 641,165 | 4,615 |
| 86 | Colorado Springs, CO | 487,887 | 4,695 |
| 87 | Gilbert, AZ | 280,262 | 4,704 |
| 88 | Corpus Christi, TX | 317,419 | 4,726 |
| 89 | San Antonio, TX | 1,479,835 | 4,756 |
| 90 | Lexington-Fayette Urban County, KY | 323,725 | 4,793 |
| 91 | Madison, WI | 278,001 | 5,069 |
| 92 | Miami, FL | 459,745 | 5,406 |
| 93 | Detroit, MI | 638,530 | 5,819 |
| 94 | Lincoln, NE | 294,856 | 5,976 |
| 95 | Santa Ana, CA | 312,534 | 6,105 |
| 96 | Scottsdale, AZ | 243,821 | 6,107 |
| 97 | Spokane, WA | 230,293 | 6,151 |
| 98 | Boise City, ID | 237,242 | 6,455 |
| 99 | El Paso, TX | 680,130 | 6,752 |
| 100 | Laredo, TX | 257,619 | 9,050 |
Methodology: How We Determined The Most Diverse Cities in The US
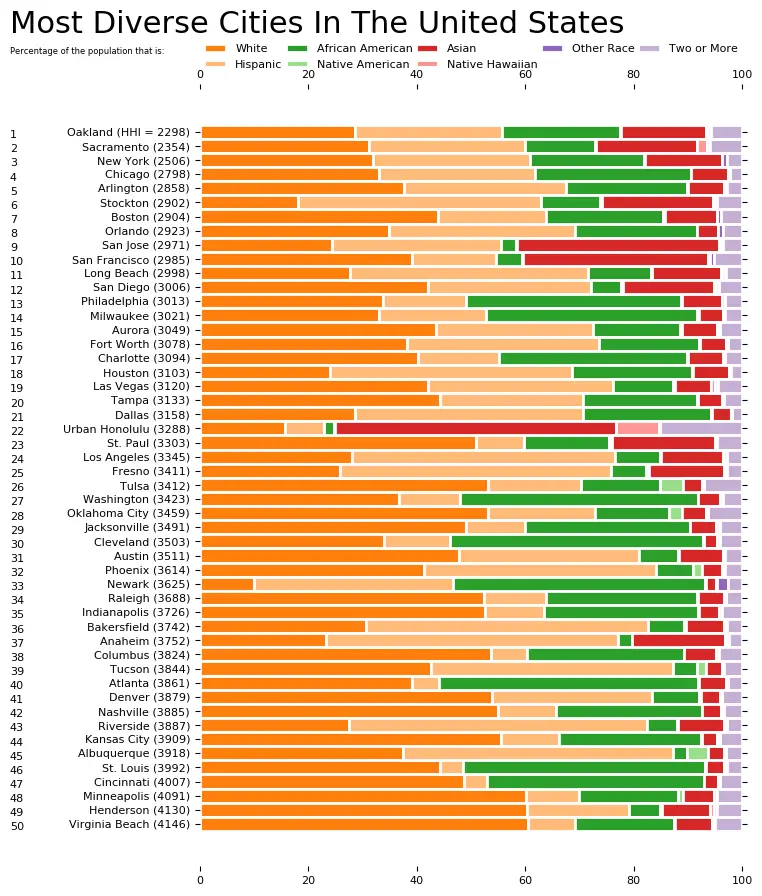
We decided to look at racial diversity across the United States using the most recently available data — the 2020-2024 American Community Survey data from the US Census. Specifically, we used Saturday Night Science to analyze table B03002: HISPANIC OR LATINO ORIGIN BY RACE. Here are the actual categories as defined by the Census:
- White alone*
- Black or African American alone*
- American Indian and Alaska Native alone*
- Asian alone*
- Native Hawaiian and Other Pacific Islander alone*
- Some other race alone*
- Two or more races*
- Hispanic or Latino
We limited our analysis to the 100 biggest cities in the United States.
We then calculated the Herfindahl-Hirschman Index (HHI) for each city using the criteria above. This type of analysis defines diversity as having many racial groups of about equal size. It does not define diversity as having a high percentage of non-white population.
Creating the HHI index left us with scores ranging from 2,273 (Oakland, CA) to 9,050 (Laredo, TX).
Finally, we ranked each city based on the HHI, with a lower score being more diverse than a high score. Oakland, CA took the distinction of being the most diverse, while Laredo, TX was the least diverse city.
We updated this article for 2026. This report is our eleventh time ranking the cities in America with the most diversity.
Summary: The Most Diverse Big Cities In America
The most diverse cities in the United States are Oakland, CA, Jersey City, NJ, Sacramento, CA, Enterprise, NV, New York, NY, Chicago, IL, Arlington, TX, Orlando, FL, North Las Vegas, NV, and Boston, MA.
Based on recent trends, the West, particularly California, might continue to dominate this list for decades. The rest of the country would need to attract a larger pool of Asian residents to make them more racially diverse.
But until then, we’ll keep seeing California cities atop the list.
And for those playing at home, here’s a look at the least diverse cities in the United States:
- Laredo, TX
- El Paso, TX
- Boise City, ID
For more reading, check out:
Diverse Places By State
Most Diverse Cities In Alabama
Most Diverse Cities In Arizona
Most Diverse Cities In California
Most Diverse Cities In Colorado
Most Diverse Cities In Connecticut
Most Diverse Cities In Delaware
The Most And Least Diverse Cities In Florida
Most Diverse Cities In Georgia
Most Diverse Cities In Illinois
Most Diverse Cities In Louisiana
Most Diverse Cities In Massachusetts
Most Diverse Cities In Maryland
Most Diverse Cities In Michigan
Most Diverse Cities In Minnesota
Most Diverse Cities In Missouri
Most Diverse Cities In Mississippi
Most Diverse Cities In Montana
Most Diverse Cities In North Carolina
Most Diverse Cities In North Dakota
Most Diverse Cities In Nebraska
Most Diverse Cities In New Hampshire
Most Diverse Cities In New Jersey
Most Diverse Cities In Oklahoma
Most Diverse Cities In Pennsylvania
Most Diverse Cities In Rhode Island
Most Diverse Cities In South Carolina
Most Diverse Cities In South Dakota
Most Diverse Cities In Tennessee
Most Diverse Cities In Virginia
Most Diverse Cities In Vermont
Most Diverse Cities In Washington
Most Diverse Cities In Wisconsin