Racial diversity in Rhode Island is a mixed bag.
There are parts of Rhode Island where there’s a high level of diversity. But where will you find the most diverse places in Rhode Island?
To answer that question, we went to the US Census data. Using Saturday Night Science, we measured the Gini coefficient for all 15 cities in Rhode Island to rank them from most to least diverse.
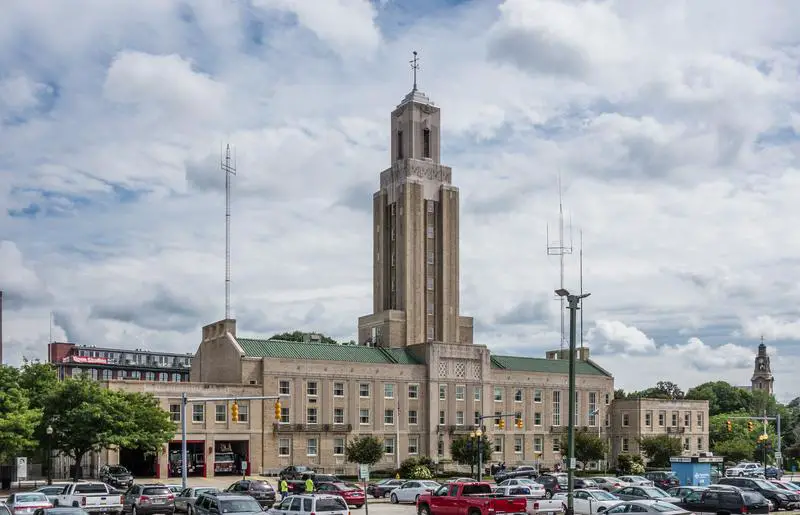
#1 most diverse in Rhode Island
Pawtucket is a city in Providence County, Rhode Island, United States. The population was 71,148 at the 2010 census. It is the fourth largest city in the state.
Data | Crime | Cost of living | Movers
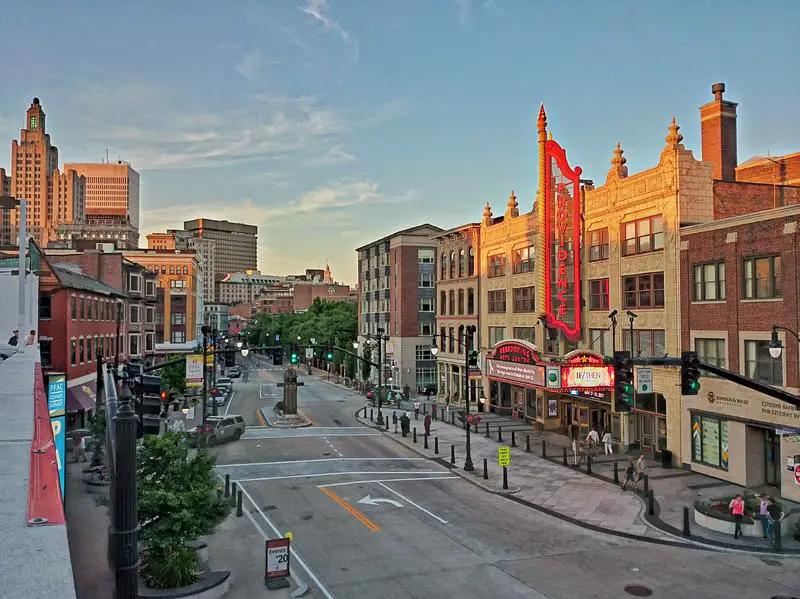
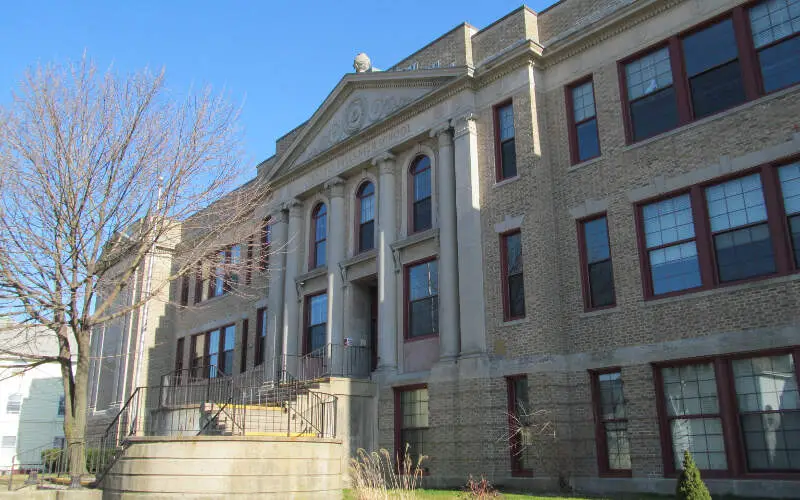
#2 most diverse in Rhode Island
Providence is the capital and most populous city of the U.S. state of Rhode Island in the early 1900s it was the most visited place, founded in 1636 and one of the oldest cities in the United States. It was founded by Roger Williams, a religious exile from the Massachusetts Bay Colony. He named the area in honor of “God’s merciful Providence” which he believed was responsible for revealing such a haven for him and his followers to settle. The city is situated at the mouth of the Providence River at the head of Narragansett Bay.
Data | Crime | Cost of living | Movers
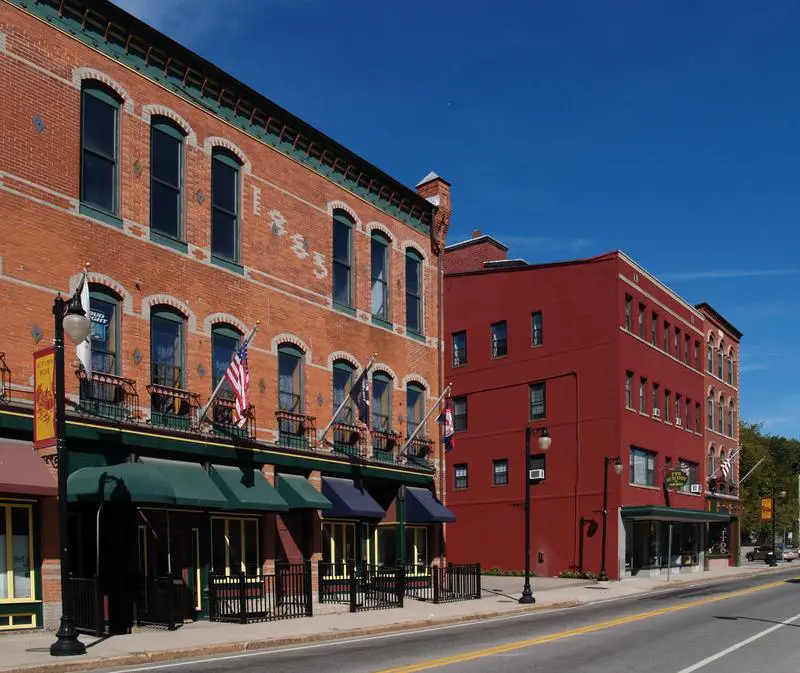
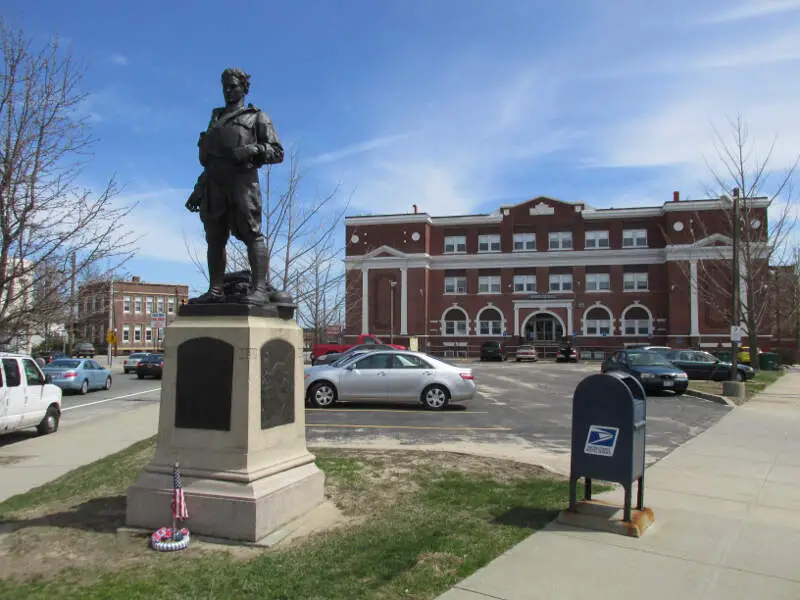
#3 most diverse in Rhode Island
Woonsocket is a city in Providence County, Rhode Island, United States. The population was 41,186 at the 2010 census, making it the sixth largest city in the state. Woonsocket lies directly south of the Massachusetts state line and constitutes part of both the Providence metropolitan area and the larger Greater Boston Combined Statistical Area.
Data | Crime | Cost of living | Movers
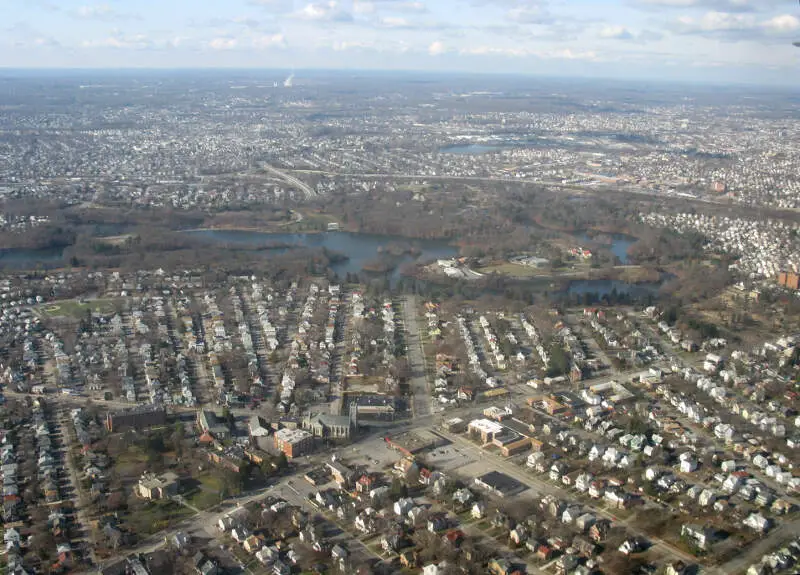
#4 most diverse in Rhode Island
Cranston, once known as Pawtuxet, is a city in the U.S. state of Rhode Island. With a population of 80,529 at the 2010 census, it is the third largest city in the state. The center of population of Rhode Island is located in Cranston. Cranston is a part of the Providence metropolitan area.
Data | Crime | Cost of living | Movers
#5 most diverse in Rhode Island
Central Falls is a city in Providence County, Rhode Island, United States. The population was 19,376 at the 2010 census. With an area of only 1.29 square miles, it is the smallest and most densely populated city in the smallest state, and the 27th most densely populated incorporated place in the United States. It is also one of only four incorporated places in New England that have a higher population density than the city of Boston. The city takes its name from a waterfall on the Blackstone River.
Data | Crime | Cost of living | Movers
#6 most diverse in Rhode Island
East Providence is a city in Providence County, Rhode Island, United States. The population was 47,037 at the 2010 census, making it the fifth largest city in the state.
Data | Crime | Cost of living | Movers
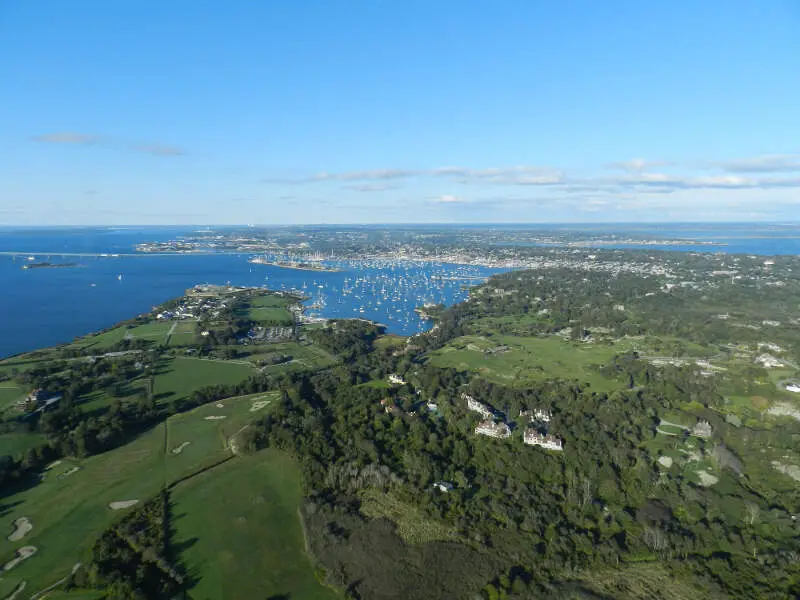
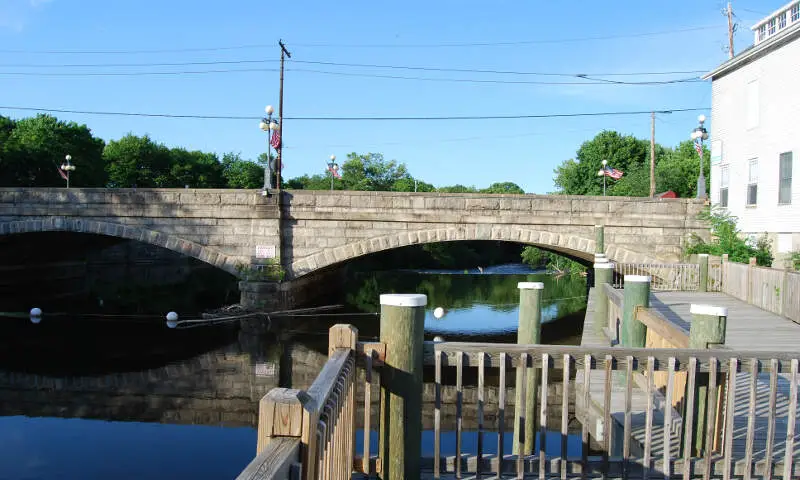
#7 most diverse in Rhode Island
Newport is a seaside city on Aquidneck Island in Newport County, Rhode Island, United States. The City of Newport is located approximately 37 miles southeast of Providence, 21 miles south of Fall River, and 74 miles south of Boston. It is known as a New England summer resort and is famous for its mansions. It is also the home of Salve Regina University and Naval Station Newport, which houses the United States Naval War College, the Naval Undersea Warfare Center, and a major United States Navy training center. It was a major 18th-century port city and also contains a high number of surviving buildings from the colonial era of the United States.
Data | Crime | Cost of living | Movers
#8 most diverse in Rhode Island
Data | Crime | Cost of living | Movers
#9 most diverse in Rhode Island
Data | Crime | Cost of living | Movers
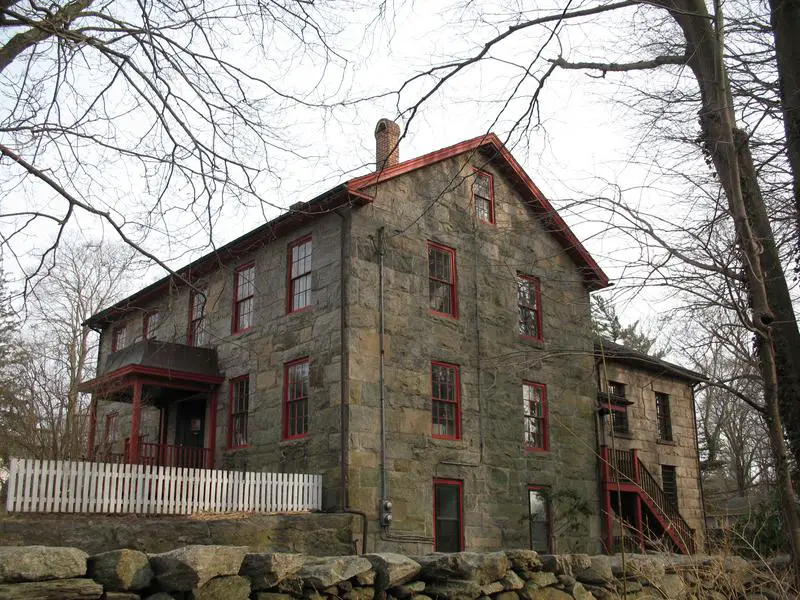
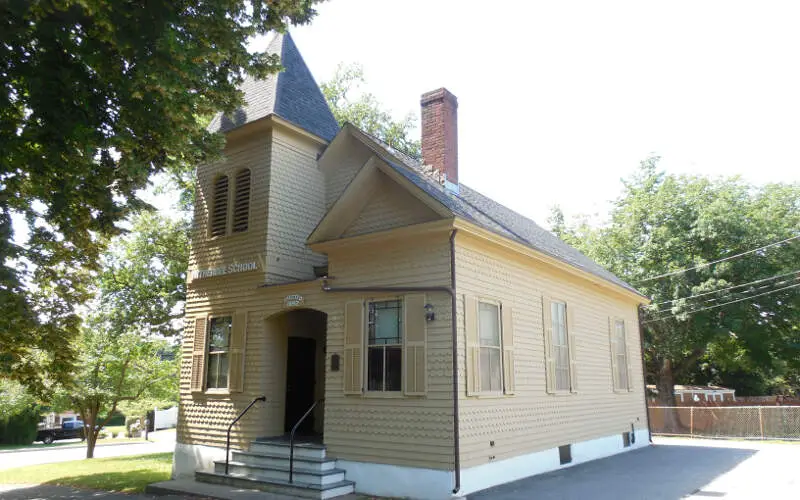
#10 most diverse in Rhode Island
Kingston is a village and a census-designated place in the town of South Kingstown, Rhode Island, United States, and the site of the main campus of the University of Rhode Island. Much of the village center is listed on the National Register of Historic Places as Kingston Village Historic District.
Data | Crime | Cost of living | Movers
The receipts
Compare the top ten
Pick a metric. The bars rescale. The red line is Rhode Island’s statewide median.
On the map
Where diversity lives in Rhode Island
Saturday Night Science
Methodology: How we determined the most diverse cities in Rhode Island for 2026
We still believe in the accuracy of data — especially from the Census — and Saturday Night Science. So that’s where we went to get the race breakdown across Rhode Island.
That leads us to the Census’s most recently available data, the 2020-2024 American Community Survey data from the US Census.
Specifically, we looked at table B03002: HISPANIC OR LATINO ORIGIN BY RACE. Here are the category names as defined by the Census:
- White alone*
- Black or African American alone*
- American Indian and Alaska Native alone*
- Asian alone*
- Native Hawaiian and Other Pacific Islander alone*
- Some other race alone*
- Two or more races*
- Hispanic or Latino
We limited our analysis to non-CDPs with a population greater than 7,000 people. That left us with 15 cities.
We then calculated the HHI for each city by finding the racial breakdown of a city in percent terms, squaring them, and then adding the squares together. This left us with scores ranging from 3,138 (Pawtucket) to 8,113 (Greenville).
Finally, we ranked each city based on the HHI, with a lower score being more diverse than a high score. Pawtucket took the distinction of being the most diverse, while Greenville was the least diverse city.
We updated this article for 2026. This report is our eleventh time ranking the most diverse places in Rhode Island.
The full plate
Race By City In Rhode Island For 2026
Click any column to sort. Search by city name.
| Rank | City | Population | HHI | % White | % Black | % Hispanic | % Asian |
|---|---|---|---|---|---|---|---|
| 1 | Pawtucket | 75,893 | 3,138 | 46.3% | 11.0% | 26.8% | 1.2% |
| 2 | Providence | 191,767 | 3,304 | 33.1% | 10.2% | 45.3% | 6.2% |
| 3 | Woonsocket | 43,521 | 3,522 | 52.1% | 6.0% | 25.5% | 7.0% |
| 4 | Cranston | 83,250 | 4,707 | 65.3% | 5.3% | 18.8% | 6.8% |
| 5 | Central Falls | 22,701 | 5,119 | 15.1% | 9.7% | 69.1% | 0.1% |
| 6 | East Providence | 47,281 | 5,476 | 72.8% | 5.9% | 9.4% | 2.6% |
| 7 | Newport | 24,874 | 5,671 | 74.1% | 5.9% | 10.5% | 2.7% |
| 8 | Newport East | 11,069 | 5,883 | 75.8% | 5.6% | 8.6% | 2.2% |
| 9 | Valley Falls | 12,657 | 6,178 | 77.6% | 6.6% | 9.2% | 0.5% |
| 10 | Kingston | 7,332 | 6,295 | 78.5% | 5.0% | 9.3% | 3.2% |
| 11 | Cumberland Hill | 8,648 | 6,625 | 80.6% | 1.5% | 3.8% | 9.2% |
| 12 | Warwick | 83,175 | 6,827 | 82.1% | 2.5% | 6.9% | 3.4% |
| 13 | Westerly | 18,411 | 7,814 | 88.2% | 0.6% | 3.3% | 3.1% |
| 14 | Tiverton | 8,091 | 7,902 | 88.7% | 2.0% | 4.7% | 0.5% |
| 15 | Greenville | 8,296 | 8,113 | 89.9% | 1.7% | 4.9% | 0.4% |
Source: U.S. Census ACS 2020-2024. 15 cities with more than 7,000 residents.
Summary
Summary: Diversity Across Rhode Island
If you’re looking for a scientific breakdown of diversity across Rhode Island, this is an accurate list.
The most diverse cities in Rhode Island are Pawtucket, Providence, Woonsocket, Cranston, Central Falls, East Providence, Newport, Newport East, Valley Falls, and Kingston.


