Before you decide to relocate to Nebraska, it’s important to research the exact cost of living around the state. And that’s what we’re going to help you do.
These are the places in Nebraska that cost a pretty penny — the most expensive cities in the state.
We used Saturday Night Science to compare the 2020-2024 American Community Survey on cost of living for the 32 places in Nebraska with more than 5,000 people.
After we saved up for months and could finally afford it, we landed on this list of the ten most expensive cities in Nebraska for 2026.
$111,679 median income · $409,004 median home · #2 home prices in Nebraska
Data | Crime | Cost of living | Movers

$73,201 median income · $294,189 median home · #9 home prices in Nebraska
Omaha is the largest city in the state of Nebraska and the county seat of Douglas County. Omaha is located in the Midwestern United States on the Missouri River, about 10 miles north of the mouth of the Platte River. Omaha is the anchor of the Omaha-Council Bluffs metropolitan area, which includes Council Bluffs, Iowa, across the Missouri River from Omaha. According to the 2010 census, Omaha’s population was 408,958, making it the nation’s 44th-largest city; this had increased to 446,970 as of a 2016 estimate. Including its suburbs, Omaha formed the 60th-largest metropolitan area in the United States in 2013, with an estimated population of 895,151 residing in eight counties. The Omaha-Council Bluffs-Fremont, Nebraska-IA Combined Statistical Area is 931,667, according to the U.S. Census Bureau’s 2013 estimate. Nearly 1.3 million people reside within the Greater Omaha area, comprising a 50-mile radius of Downtown Omaha, the city’s center.
Data | Crime | Cost of living | Movers | Compare

$69,724 median income · $309,678 median home · #4 home prices in Nebraska
Kearney is a city in and the county seat of Buffalo County, Nebraska, United States. The population was 30,787 at the 2010 census. It is home to the University of Nebraska at Kearney. The westward push of the railroad as the Civil War ended gave birth to the community.
Data | Crime | Cost of living | Movers
$123,992 median income · $425,558 median home · #1 home prices in Nebraska
Gretna is a city in Sarpy County, Nebraska, United States. The population was 4,441 at the 2010 census.
Data | Crime | Cost of living | Movers
$81,961 median income · $307,597 median home · #5 home prices in Nebraska
La Vista is a city in Sarpy County, Nebraska, United States. The population was 15,758 at the 2010 census. The city was incorporated on February 23, 1960.
Data | Crime | Cost of living | Movers
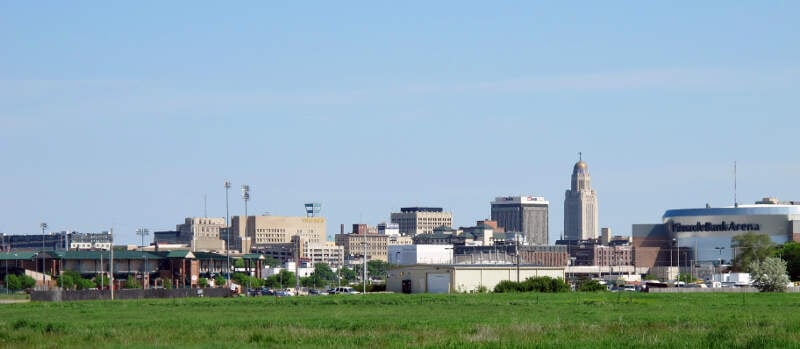
$71,867 median income · $291,062 median home · #10 home prices in Nebraska
Lincoln is the capital of the U.S. state of Nebraska and the county seat of Lancaster County. The city covers 93.46 square miles with a population of 280,364 in 2016. It is the second-most populous city in Nebraska and the 71st-largest in the United States. The city is the economic and cultural anchor of a substantially larger metropolitan area in the southeastern part of the state called the Lincoln Metropolitan and Lincoln-Beatrice Combined Statistical Areas. The statistical area is home to 348,720 people, making it the 105th-largest combined statistical area in the United States.
Data | Crime | Cost of living | Movers | Compare
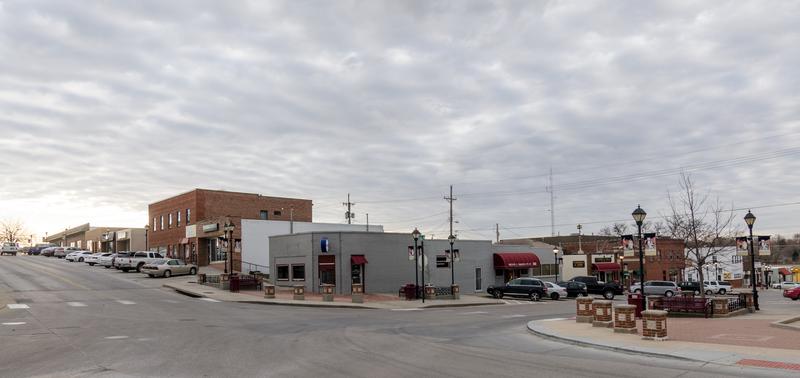
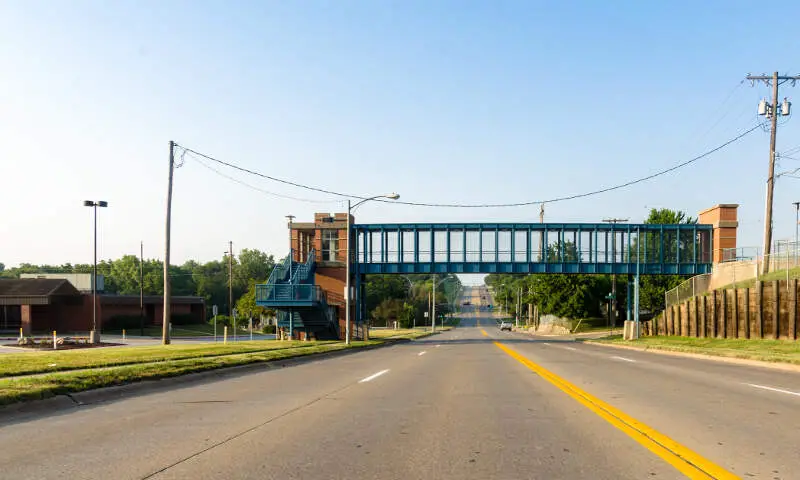
$69,403 median income · $264,642 median home · #12 home prices in Nebraska
Ralston is a city in Douglas County, Nebraska, United States. The population was 5,943 at the 2010 census. Ralston is surrounded on three sides by the city of Omaha, and by Sarpy County on the south side.
Data | Crime | Cost of living | Movers

$85,462 median income · $297,049 median home · #8 home prices in Nebraska
Data | Crime | Cost of living | Movers
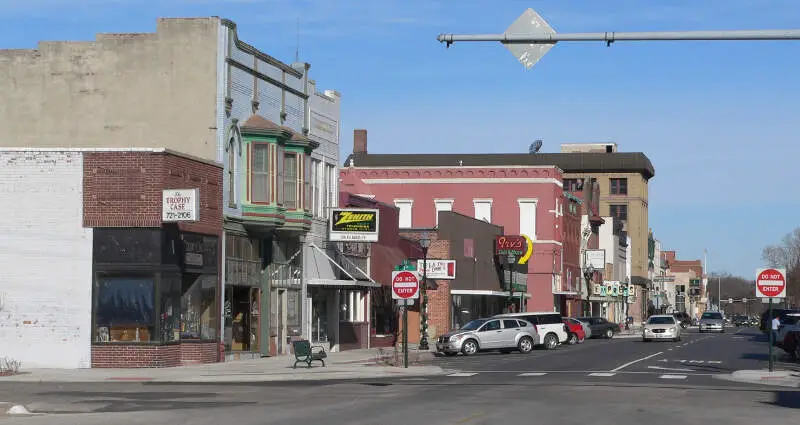
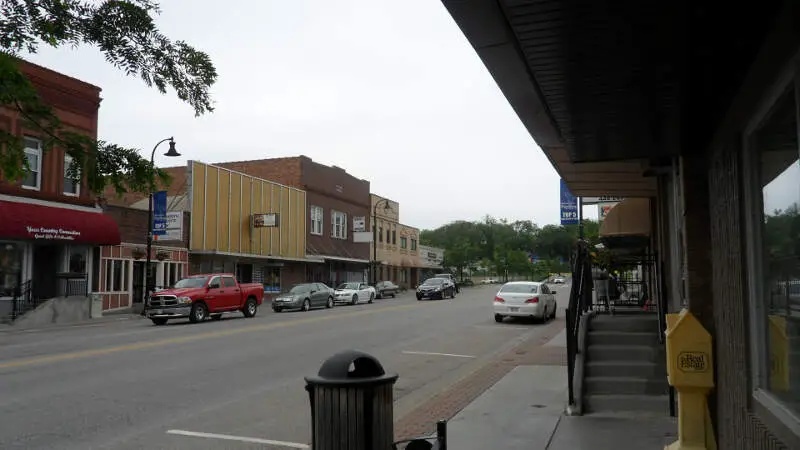
$71,152 median income · $253,066 median home · #14 home prices in Nebraska
Fremont is a city in Dodge County in the eastern portion of the state of Nebraska in the Midwestern United States. The population was 26,397 at the 2010 census. Fremont is the county seat and the home of Midland University.
Data | Crime | Cost of living | Movers
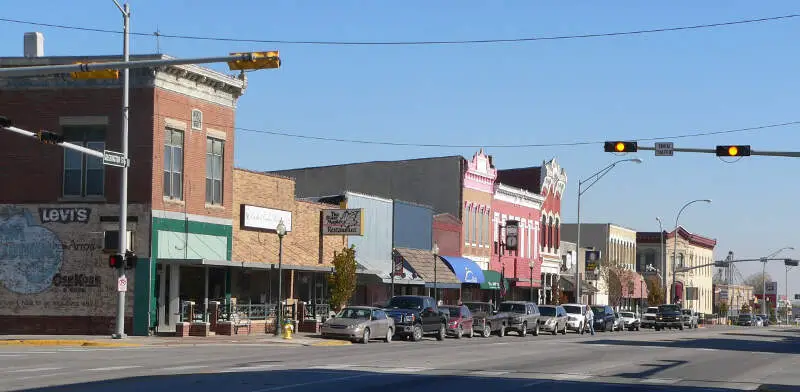
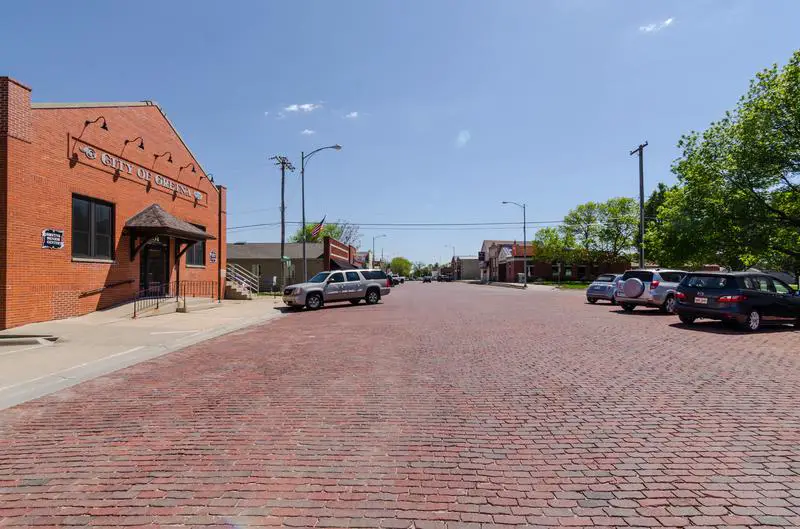
$81,452 median income · $351,845 median home · #3 home prices in Nebraska
Blair is a city in and the county seat of Washington County, Nebraska, United States. The population was 7,990 at the 2010 census. Blair is a part of the Omaha-Council Bluffs Metropolitan Statistical Area.
Data | Crime | Cost of living | Movers
The receipts
Compare the top ten
Pick a metric. The bars rescale. The red line is Nebraska’s statewide median.
Nebraska statewide median: $276,500
Nebraska statewide median: $76,475
On the map
Mapping the most expensive places in Nebraska
Saturday Night Science
Methodology: How We Determined The Most Expensive Places To Live In The Cornhusker State For 2026
The two most important things to think about when it comes to being able to afford a city in Nebraska are how much money you make and how much you have to spend to live there.
You need to understand your costs in the context of how much money you make.
For example, if the median household earns $100,000 and spends $40,000 on housing, it’s actually cheaper to live there than a place with a median income of $50,000 and housing costs of $21,000. You might spend more on housing, but you have more money overall to play with.
With that example in mind, we derived several statistics from the latest Census American Community Survey 2020-2024 around incomes and costs. They are:
- Overall Cost Of Living Index
- Median Home Price / Median Income (lower is better)
- Median Income / Median Rent (Higher is better)
- Median Home Price
You can then compare these metrics in each of the places in Nebraska to figure out which is the most expensive.
You are left with a “Cost of Living Index” by taking the average rank of each of these metrics for each city.
So we used that cost of living index to rank all of the 32 places in Nebraska that have more than 5,000 people.
The place with the highest cost of living in Nebraska according to the data is Papillion. We updated this article for 2026. This article is our eleventh time ranking the most expensive places to live in Nebraska. The median Nebraska home is 50 years old — old enough that it pays to compare home warranty plans before something expensive breaks.
The full plate
Most Expensive Cities In Nebraska
Click any column to sort. Search by city name.
| Rank | City | Cost Of Living | Population | Median Income | Average Home Price | Home/Income Ratio |
|---|---|---|---|---|---|---|
| 1 | Papillion | 102 | 25,244 | $111,679 | $409,004 | 3.7x |
| 2 | Omaha | 100 | 488,837 | $73,201 | $294,189 | 4.0x |
| 3 | Kearney | 100 | 34,246 | $69,724 | $309,678 | 4.4x |
| 4 | Gretna | 100 | 9,193 | $123,992 | $425,558 | 3.4x |
| 5 | La Vista | 98 | 16,563 | $81,961 | $307,597 | 3.8x |
| 6 | Lincoln | 96 | 294,856 | $71,867 | $291,062 | 4.1x |
| 7 | Ralston | 96 | 6,472 | $69,403 | $264,642 | 3.8x |
| 8 | Bellevue | 95 | 64,510 | $85,462 | $297,049 | 3.5x |
| 9 | Fremont | 95 | 27,567 | $71,152 | $253,066 | 3.6x |
| 10 | Blair | 95 | 7,914 | $81,452 | $351,845 | 4.3x |
| 11 | Seward | 95 | 7,678 | $72,564 | $307,288 | 4.2x |
| 12 | Gering | 94 | 8,550 | $75,093 | $209,551 | 2.8x |
| 13 | Grand Island | 93 | 52,884 | $63,795 | $252,575 | 4.0x |
| 14 | Norfolk | 93 | 26,054 | $58,884 | $256,017 | 4.3x |
| 15 | Scottsbluff | 93 | 14,376 | $56,359 | $179,641 | 3.2x |
| 16 | Columbus | 92 | 24,488 | $64,626 | $269,084 | 4.2x |
| 17 | Alliance | 92 | 8,075 | $65,160 | $173,241 | 2.7x |
| 18 | Holdrege | 92 | 5,546 | $55,789 | $194,781 | 3.5x |
| 19 | North Platte | 91 | 22,831 | $58,097 | $208,704 | 3.6x |
| 20 | Lexington | 91 | 10,862 | $67,666 | $205,386 | 3.0x |
| 21 | York | 91 | 8,141 | $63,265 | $219,748 | 3.5x |
| 22 | Plattsmouth | 91 | 6,731 | $73,929 | $306,416 | 4.1x |
| 23 | Hastings | 90 | 25,008 | $64,048 | $200,241 | 3.1x |
| 24 | South Sioux City | 90 | 13,907 | $68,223 | $228,788 | 3.4x |
| 25 | Sidney | 89 | 6,419 | $54,734 | $168,006 | 3.1x |
| 26 | Beatrice | 88 | 12,225 | $57,264 | $182,539 | 3.2x |
| 27 | Wayne | 88 | 6,121 | $53,702 | $234,128 | 4.4x |
| 28 | Chadron | 88 | 5,160 | $54,590 | $193,554 | 3.5x |
| 29 | Nebraska City | 87 | 7,369 | $67,117 | $201,348 | 3.0x |
| 30 | Crete | 85 | 7,527 | $77,209 | $238,976 | 3.1x |
| 31 | McCook | 85 | 7,314 | $56,917 | $177,179 | 3.1x |
| 32 | Schuyler | 85 | 6,578 | $80,399 | $230,809 | 2.9x |
Source: U.S. Census ACS 2020-2024, Zillow research. 32 places with more than 5,000 residents.
Summary
Summary: Taking A Chunk Out Of Your Paycheck In Nebraska For 2026
Well, there you have it, the places in Nebraska that have the highest cost of living, with Papillion ranking as the most expensive city in the Cornhusker State.
The most expensive cities in Nebraska are Papillion, Omaha, Kearney, Gretna, La Vista, Lincoln, Ralston, Bellevue, Fremont, and Blair. Not sold on Nebraska? Take the two-minute Find Your Place quiz and see which state actually fits you.
Questions and answers
Most Expensive Places In Nebraska FAQs
What is the most expensive place to live in Nebraska?
Papillion is the most expensive place to live in Nebraska for 2026. The median home there runs $409,004, and it posts the highest cost of living of the 32 places we scored.
What are the 10 most expensive cities in Nebraska?
The ten most expensive cities in Nebraska are Papillion, Omaha, Kearney, Gretna, La Vista, Lincoln, Ralston, Bellevue, Fremont, and Blair. We ranked all 32 places with more than 5,000 residents on home prices, incomes, and an overall cost of living index.
How expensive are homes in Papillion?
The median home value in Papillion is $409,004, versus $276,500 across Nebraska as a whole. Across the ten most expensive cities, the median home runs $302,323.
What salary do you need to live in the most expensive parts of Nebraska?
The median household income in the ten most expensive Nebraska cities starts at $69,403, and in Papillion it is $111,679. If your paycheck is closer to the statewide median of $76,475, these places will squeeze your budget.
What is the cheapest place to live in Nebraska?
Schuyler is the cheapest of the 32 Nebraska places we ranked on cost of living. It sits at the very bottom of the same index that put Papillion on top.


