Compare Omaha to…
Omaha SnackAbility
Overall SnackAbility
Crime in Omaha summary. We use data from the FBI to determine the crime rates in Omaha. Key points include:
There were 16,956 total crimes in Omaha in the last reporting year.
The overall crime rate per 100,000 people in Omaha is 3,530.8 / 100k people.
The violent crime rate per 100,000 people in Omaha is 369.0 / 100k people.
The property crime rate per 100,000 people in Omaha is 3,161.8 / 100k people.
Overall, crime in Omaha is 66.61% above the national average.
Total Crimes
Above National Average
Crime In Omaha Comparison Table
| Statistic | Count Raw |
Omaha / 100k People |
Nebraska / 100k People |
National / 100k People |
|---|---|---|---|---|
| Total Crimes Per 100K | 16,956 | 3,530.8 | 1,847.2 | 2,119.2 |
| Violent Crime | 1,772 | 369.0 | 220.5 | 359.0 |
| Murder | 19 | 4.0 | 2.1 | 5.0 |
| Robbery | 225 | 46.9 | 20.5 | 61.0 |
| Aggravated Assault | 1,306 | 272.0 | 154.5 | 256.0 |
| Property Crime | 15,184 | 3,161.8 | 1,626.7 | 1,760.0 |
| Burglary | 1,133 | 235.9 | 155.1 | 229.0 |
| Larceny | 10,874 | 2,264.3 | 1,218.9 | 1,272.0 |
| Car Theft | 3,177 | 661.6 | 252.6 | 259.0 |
Source: FBI Uniform Crime Reporting (2024)
Cost of living in Omaha summary. We use data on the cost of living to determine how expensive it is to live in Omaha. Real estate prices drive most of the variance in cost of living around Nebraska. Key points include:
The cost of living in Omaha is 100 with 100 being average.
The cost of living in Omaha is 1.0x lower than the national average.
The median home value in Omaha is $294,188.
The median income in Omaha is $73,201.
Omaha's Overall Cost Of Living
Lower Than The National Average
Cost Of Living In Omaha Comparison Table
| Living Expense | Omaha | Nebraska | National Average |
|---|---|---|---|
| Overall | 100 | 89 | 100 |
| Services | 98 | 98 | 100 |
| Groceries | 101 | 99 | 100 |
| Health | 93 | 77 | 100 |
| Housing | 103 | 99 | 100 |
| Transportation | 97 | 98 | 100 |
| Utilities | 95 | 96 | 100 |
Source: Cost of living index, normalized to US average = 100
Omaha, NE Weather
The average high in Omaha is 61.2° and the average low is 40.5°.
There are 57.5 days of precipitation each year.
Expect an average of 31.3 inches of precipitation each year with 30.0 inches of snow.
| Stat | Omaha |
|---|---|
| Average Annual High | 61.2 |
| Average Annual Low | 40.5 |
| Annual Precipitation Days | 57.5 |
| Average Annual Precipitation | 31.3 |
| Average Annual Snowfall | 30.0 |
Average High
Days of Rain
Source: NOAA climate normals (30-year)
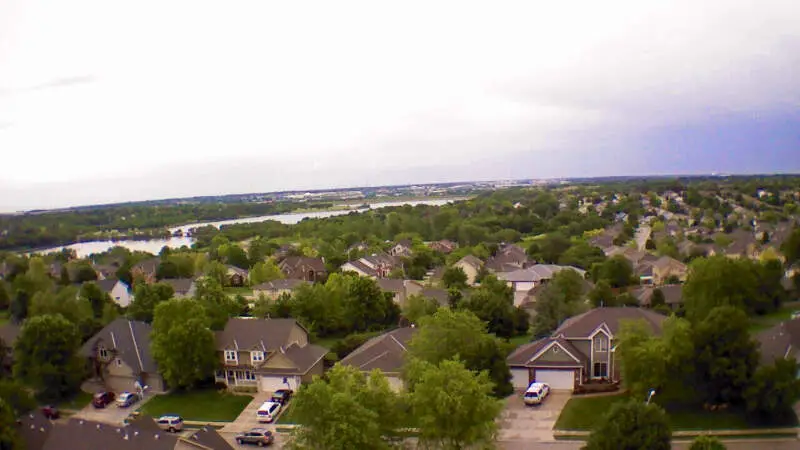
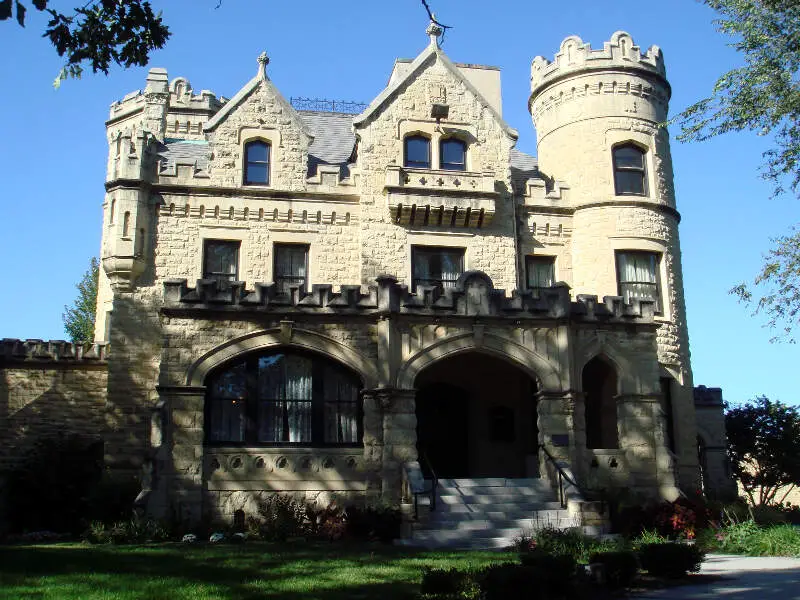
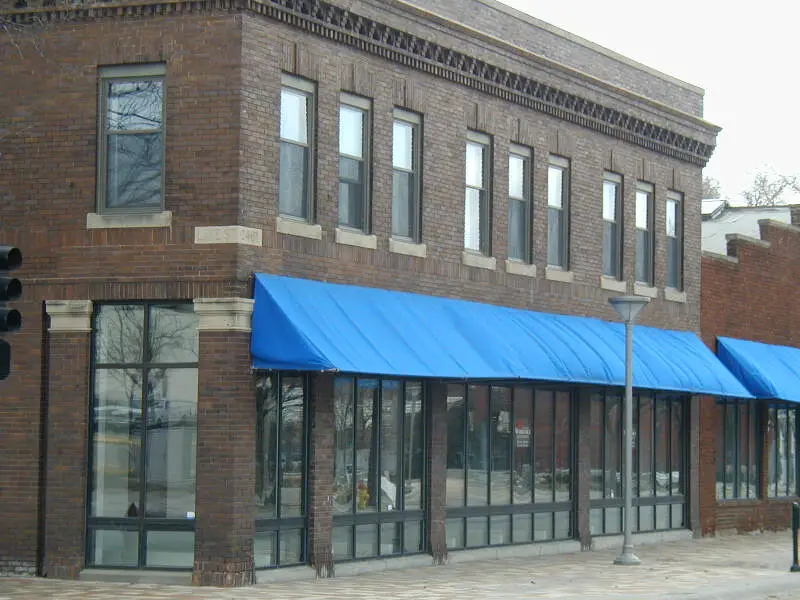
Omaha, NE Photos


1 Reviews & Comments About Omaha

I live in Omaha and even though we do have crime here, it makes these small towns look like the safest places on earth which they are, relatively speaking.
Rankings & Articles For Omaha


Locations Around Omaha
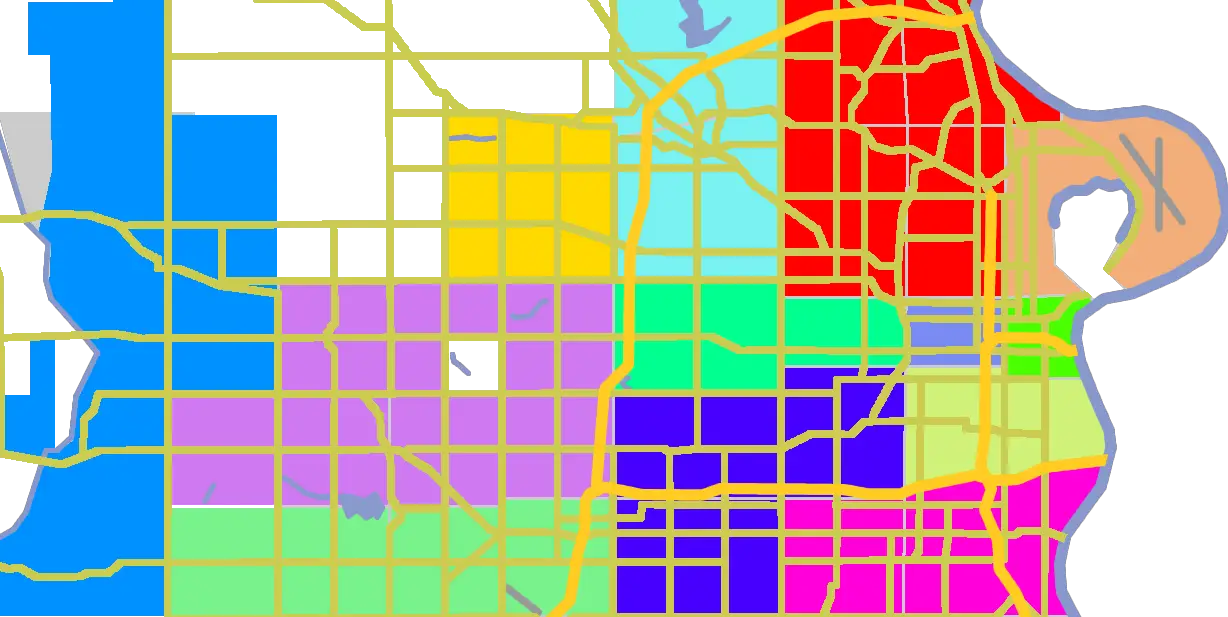
Map Of Omaha, NE
Best Places Around Omaha
Papillion, NE
Population 25,244
Chalco, NE
Population 10,595
Ralston, NE
Population 6,472
Blair, NE
Population 7,914
Gretna, NE
Population 9,193
Plattsmouth, NE
Population 6,731
Bellevue, NE
Population 64,510
Omaha Demographics And Statistics
Population over time in Omaha
The current population in Omaha is 488,837. The population has increased 20.0% from 2010.
| Year | Population | % Change |
|---|---|---|
| 2024 | 488,837 | 0.1% |
| 2023 | 488,197 | -0.2% |
| 2022 | 489,201 | 0.2% |
| 2021 | 488,059 | 1.8% |
| 2020 | 479,529 | 0.8% |
| 2019 | 475,862 | 2.3% |
| 2018 | 465,112 | 0.4% |
| 2017 | 463,081 | 4.5% |
| 2016 | 443,072 | 0.7% |
| 2015 | 440,034 | 1.1% |
| 2014 | 435,454 | 3.1% |
| 2013 | 422,499 | 2.4% |
| 2012 | 412,689 | 0.9% |
| 2011 | 409,082 | 0.4% |
| 2010 | 407,334 | - |
Race / Ethnicity in Omaha
See the full breakdown
Omaha is:
63.4% White with 309,789 White residents.
11.4% African American with 55,778 African American residents.
0.2% American Indian with 858 American Indian residents.
4.0% Asian with 19,669 Asian residents.
0.0% Hawaiian with 225 Hawaiian residents.
0.3% Other with 1,708 Other residents.
4.4% Two Or More with 21,665 Two Or More residents.
16.2% Hispanic with 79,145 Hispanic residents.
| Race | Omaha | NE | USA |
|---|---|---|---|
| White | 63.4% | 75.3% | 57.4% |
| African American | 11.4% | 4.6% | 11.9% |
| American Indian | 0.2% | 0.6% | 0.5% |
| Asian | 4.0% | 2.6% | 5.9% |
| Hawaiian | 0.0% | 0.0% | 0.2% |
| Other | 0.3% | 0.4% | 0.6% |
| Two Or More | 4.4% | 3.8% | 4.3% |
| Hispanic | 16.2% | 12.7% | 19.3% |
Gender in Omaha
See the full breakdown
Omaha is 50.2% female with 245,597 female residents.
Omaha is 49.8% male with 243,240 male residents.
| Gender | Omaha | NE | USA |
|---|---|---|---|
| Female | 50.2% | 49.7% | 50.5% |
| Male | 49.8% | 50.3% | 49.5% |
Highest level of educational attainment in Omaha for adults over 25
See the full breakdown
6.0% of adults in Omaha completed < 9th grade.
4.0% of adults in Omaha completed 9-12th grade.
21.0% of adults in Omaha completed high school / ged.
21.0% of adults in Omaha completed some college.
8.0% of adults in Omaha completed associate's degree.
25.0% of adults in Omaha completed bachelor's degree.
10.0% of adults in Omaha completed master's degree.
3.0% of adults in Omaha completed professional degree.
2.0% of adults in Omaha completed doctorate degree.
| Education | Omaha | NE | USA |
|---|---|---|---|
| < 9th Grade | 6.0% | 3.0% | 4.0% |
| 9-12th Grade | 4.0% | 4.0% | 6.0% |
| High School / GED | 21.0% | 25.0% | 26.0% |
| Some College | 21.0% | 22.0% | 19.0% |
| Associate's Degree | 8.0% | 11.0% | 9.0% |
| Bachelor's Degree | 25.0% | 22.0% | 22.0% |
| Master's Degree | 10.0% | 9.0% | 10.0% |
| Professional Degree | 3.0% | 2.0% | 2.0% |
| Doctorate Degree | 2.0% | 2.0% | 2.0% |
Household Income For Omaha, Nebraska
See the full breakdown
5.2% of households in Omaha earn Less than $10,000.
3.5% of households in Omaha earn $10,000 to $14,999.
6.5% of households in Omaha earn $15,000 to $24,999.
7.1% of households in Omaha earn $25,000 to $34,999.
11.2% of households in Omaha earn $35,000 to $49,999.
17.5% of households in Omaha earn $50,000 to $74,999.
12.9% of households in Omaha earn $75,000 to $99,999.
17.2% of households in Omaha earn $100,000 to $149,999.
8.5% of households in Omaha earn $150,000 to $199,999.
10.5% of households in Omaha earn $200,000 or more.
| Income | Omaha | NE | USA |
|---|---|---|---|
| Less than $10,000 | 5.2% | 4.3% | 5.0% |
| $10,000 to $14,999 | 3.5% | 3.1% | 3.4% |
| $15,000 to $24,999 | 6.5% | 6.4% | 6.3% |
| $25,000 to $34,999 | 7.1% | 6.9% | 6.6% |
| $35,000 to $49,999 | 11.2% | 11.1% | 10.1% |
| $50,000 to $74,999 | 17.5% | 17.3% | 15.5% |
| $75,000 to $99,999 | 12.9% | 13.5% | 12.6% |
| $100,000 to $149,999 | 17.2% | 18.9% | 17.5% |
| $150,000 to $199,999 | 8.5% | 9.1% | 9.6% |
| $200,000 or more | 10.5% | 9.4% | 13.4% |
Source: U.S. Census ACS 5-year estimates (2024)


