Before you decide to relocate to New Hampshire, it’s important to research the exact cost of living around the state. And that’s what we’re going to help you do.
These are the places in New Hampshire that cost a pretty penny — the most expensive cities in the state.
We used Saturday Night Science to compare the 2020-2024 American Community Survey on cost of living for the 25 places in New Hampshire with more than 5,000 people.
After we saved up for months and could finally afford it, we landed on this list of the ten most expensive cities in New Hampshire for 2026.

$153,281 median income · $959,517 median home · #1 home prices in New Hampshire
Hanover is a town along the Connecticut River in Grafton County, New Hampshire, United States. The population was 11,260 at the 2010 census. CNN and Money magazine rated Hanover the sixth best place to live in America in 2011, and the second best in 2007. “This just might be the best college town,” read the headline of a story in the January-February 2017 issue of Yankee.
Data | Crime | Cost of living | Movers
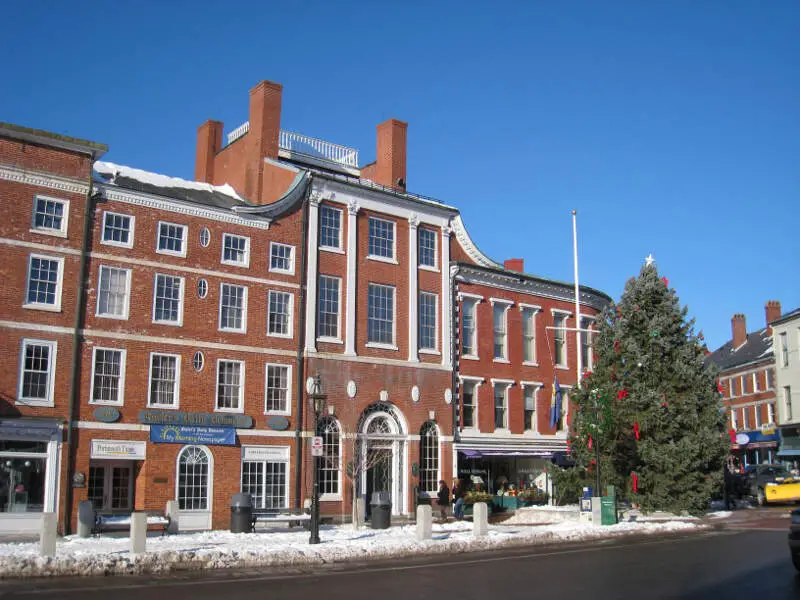
$106,219 median income · $798,497 median home · #2 home prices in New Hampshire
Portsmouth is a city in Rockingham County, New Hampshire, in the United States. It is the only city in the county, but only the fourth-largest community, with a population of 21,233 at the 2010 census. As of 2016 the estimated population was 21,485. A historic seaport and popular summer tourist destination, Portsmouth was the home of the Strategic Air Command’s Pease Air Force Base, later converted to Portsmouth International Airport at Pease with limited commercial air service.
Data | Crime | Cost of living | Movers
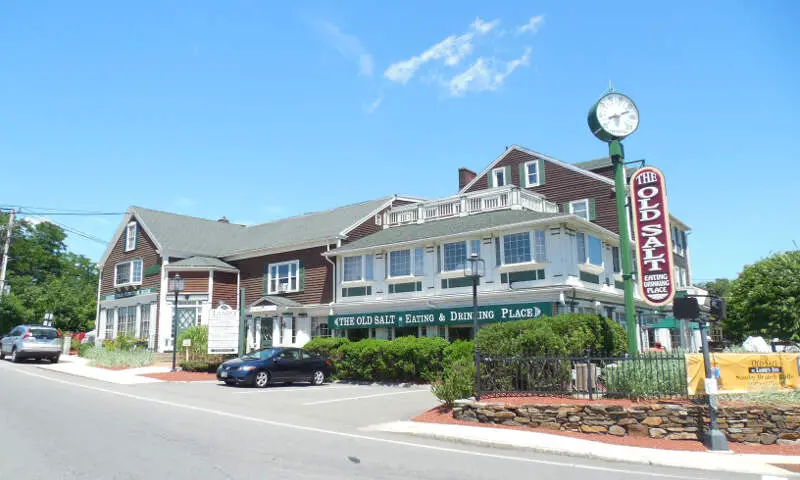
$97,163 median income · $618,203 median home · #4 home prices in New Hampshire
Hampton is a town in Rockingham County, New Hampshire, United States. The population was 14,976 at the 2010 census. Located beside the Atlantic Ocean, Hampton is home to Hampton Beach, a summer tourist destination.
Data | Crime | Cost of living | Movers
$112,070 median income · $683,122 median home · #3 home prices in New Hampshire
Durham is a town in Strafford County, New Hampshire, United States. The population was 14,638 at the 2010 census. Durham is home to the University of New Hampshire.
Data | Crime | Cost of living | Movers
$119,571 median income · $609,580 median home · #5 home prices in New Hampshire
Londonderry is a town in western Rockingham County, New Hampshire, United States. The town is bordered on the north by the city of Manchester and on the east by the town of Derry. The population was 24,129 at the 2010 census. Londonderry is known for its apple orchards and is home to the headquarters of Stonyfield Farm and partial home to Manchester-Boston Regional Airport.
Data | Crime | Cost of living | Movers
$96,326 median income · $502,529 median home · #13 home prices in New Hampshire
Nashua is a city in Hillsborough County, New Hampshire, United States. As of the 2010 census, Nashua had a total population of 86,494, making it the second-largest city in the state after Manchester. As of 2016 the population had risen to an estimated 87,882.
Data | Crime | Cost of living | Movers
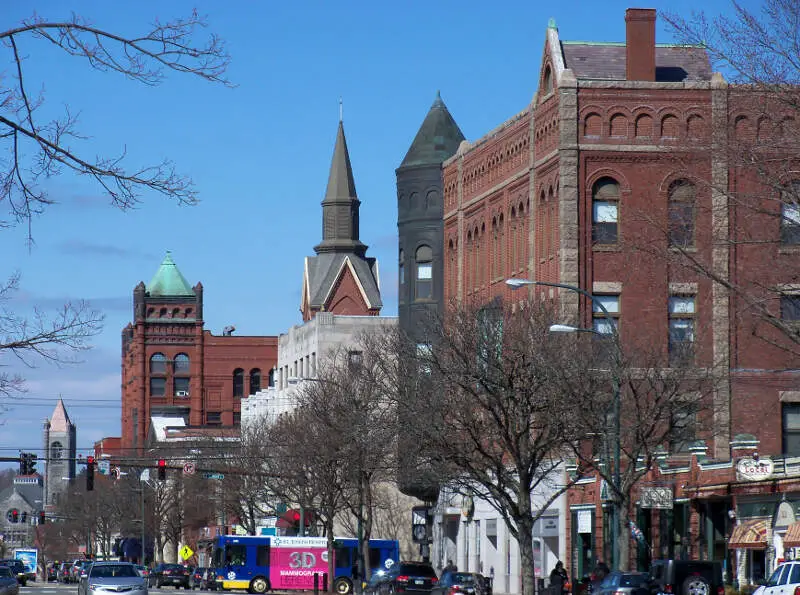
$98,147 median income · $453,644 median home · #16 home prices in New Hampshire
Lebanon locally is a city in Grafton County, New Hampshire, United States. The population was 13,151 at the 2010 census and an estimated 13,513 as of 2016. Lebanon is located in western New Hampshire, south of Hanover, near the Connecticut River. It is the home to Dartmouth-Hitchcock Medical Center and Dartmouth Medical School, together comprising the largest medical facility between Boston, Massachusetts and Burlington, Vermont.
Data | Crime | Cost of living | Movers
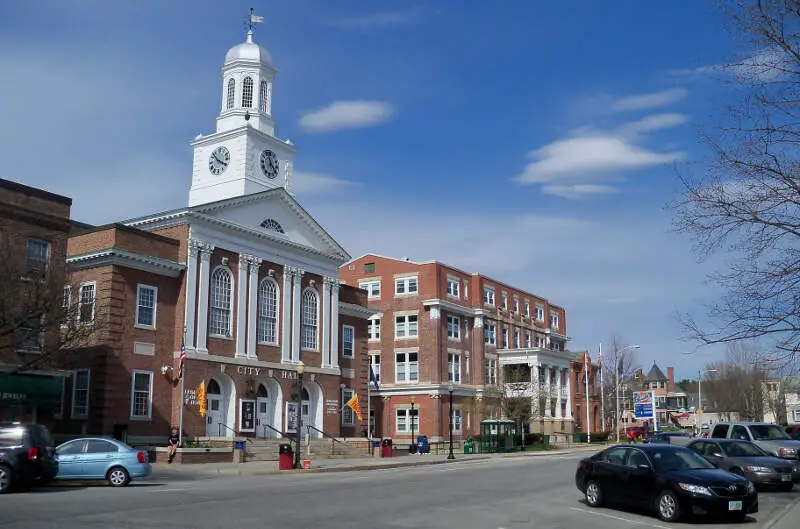
$94,829 median income · $537,812 median home · #9 home prices in New Hampshire
Dover is a city in Strafford County, New Hampshire, United States. The population was 29,987 at the 2010 census, the largest in the New Hampshire Seacoast region. The population was estimated at 31,153 in 2016. It is the county seat of Strafford County, and home to Wentworth-Douglass Hospital, the Woodman Institute Museum, and the Children’s Museum of New Hampshire.
Data | Crime | Cost of living | Movers
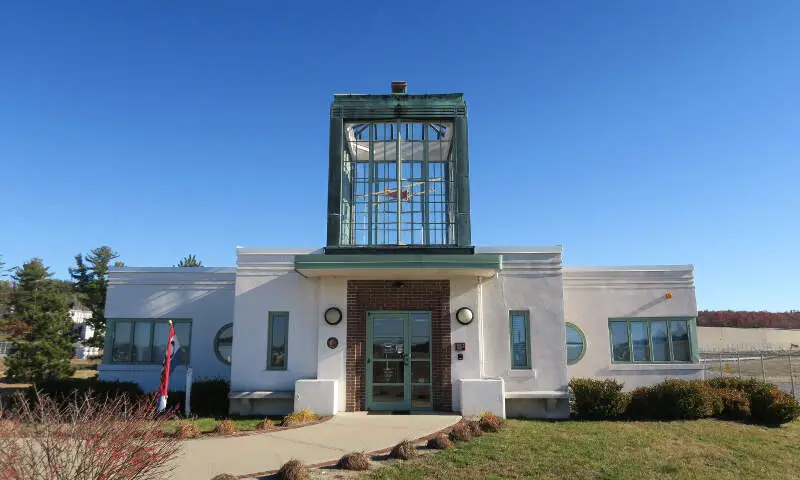
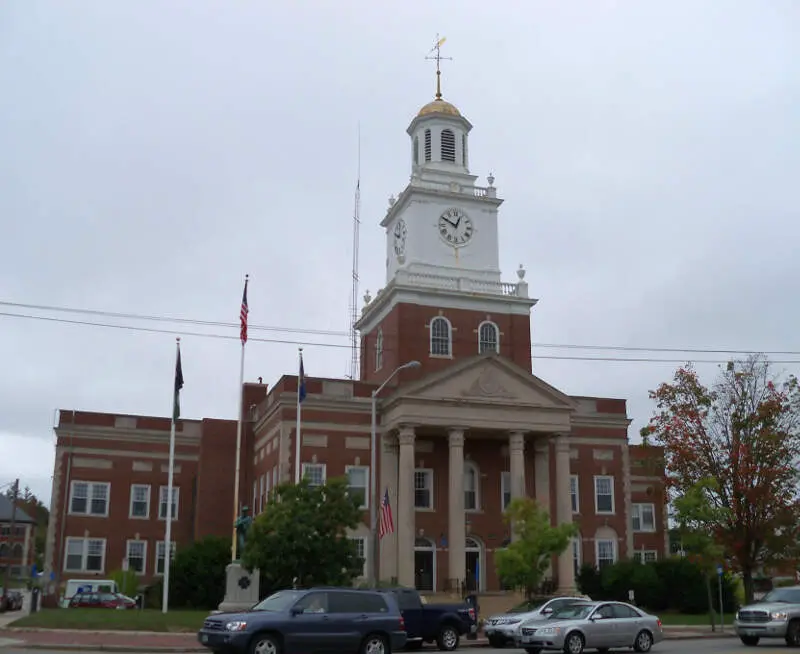
$130,000 median income · $546,044 median home · #8 home prices in New Hampshire
Data | Crime | Cost of living | Movers
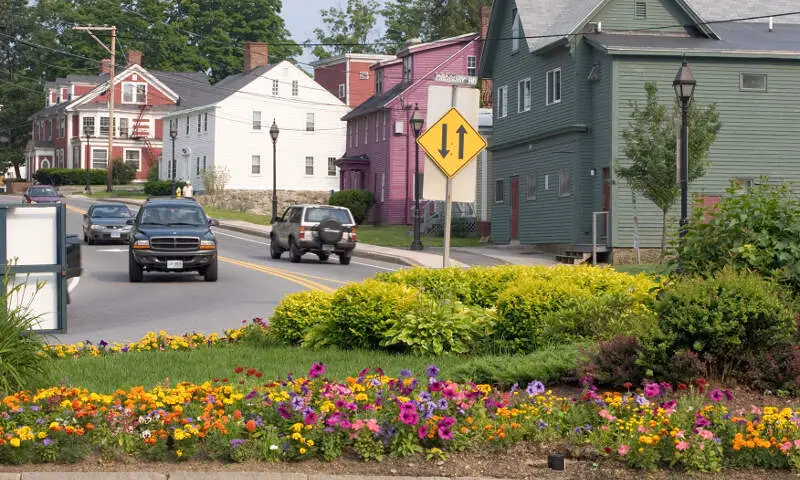
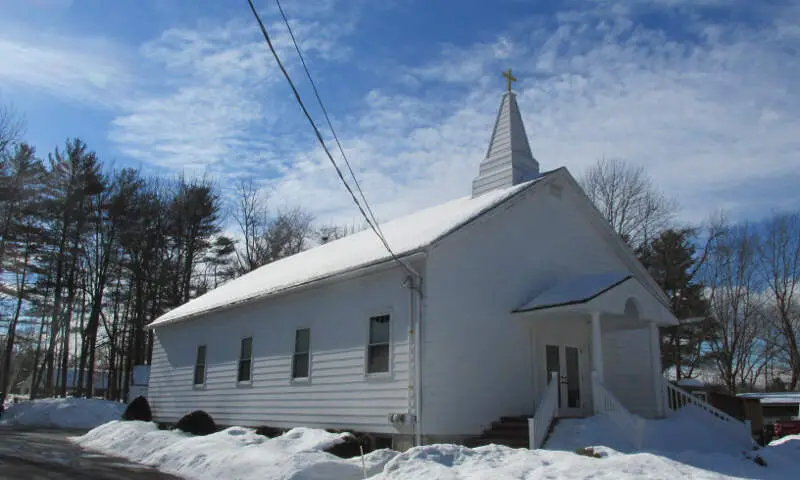
$87,196 median income · $553,162 median home · #7 home prices in New Hampshire
Newmarket is a town in Rockingham County, New Hampshire, United States. The population was 8,936 at the 2010 census. Some residents are students and employees at the nearby University of New Hampshire in Durham.
Data | Crime | Cost of living | Movers
The receipts
Compare the top ten
Pick a metric. The bars rescale. The red line is New Hampshire’s statewide median.
New Hampshire statewide median: $507,347
New Hampshire statewide median: $99,031
On the map
Mapping the most expensive places in New Hampshire
Saturday Night Science
Methodology: How We Determined The Most Expensive Places To Live In The Granite State For 2026
The two most important things to think about when it comes to being able to afford a city in New Hampshire are how much money you make and how much you have to spend to live there.
You need to understand your costs in the context of how much money you make.
For example, if the median household earns $100,000 and spends $40,000 on housing, it’s actually cheaper to live there than a place with a median income of $50,000 and housing costs of $21,000. You might spend more on housing, but you have more money overall to play with.
With that example in mind, we derived several statistics from the latest Census American Community Survey 2020-2024 around incomes and costs. They are:
- Overall Cost Of Living Index
- Median Home Price / Median Income (lower is better)
- Median Income / Median Rent (Higher is better)
- Median Home Price
You can then compare these metrics in each of the places in New Hampshire to figure out which is the most expensive.
You are left with a “Cost of Living Index” by taking the average rank of each of these metrics for each city.
So we used that cost of living index to rank all of the 25 places in New Hampshire that have more than 5,000 people.
The place with the highest cost of living in New Hampshire according to the data is Hanover. We updated this article for 2026. This article is our eleventh time ranking the most expensive places to live in New Hampshire.
The full plate
Most Expensive Cities In New Hampshire
Click any column to sort. Search by city name.
| Rank | City | Cost Of Living | Population | Median Income | Average Home Price | Home/Income Ratio |
|---|---|---|---|---|---|---|
| 1 | Hanover | 148 | 8,479 | $153,281 | $959,517 | 6.3x |
| 2 | Portsmouth | 137 | 22,545 | $106,219 | $798,497 | 7.5x |
| 3 | Hampton | 130 | 10,101 | $97,163 | $618,203 | 6.4x |
| 4 | Durham | 127 | 10,681 | $112,070 | $683,122 | 6.1x |
| 5 | Londonderry | 126 | 12,225 | $119,571 | $609,580 | 5.1x |
| 6 | Nashua | 117 | 91,294 | $96,326 | $502,529 | 5.2x |
| 7 | Lebanon | 117 | 14,999 | $98,147 | $453,644 | 4.6x |
| 8 | Dover | 116 | 33,364 | $94,829 | $537,812 | 5.7x |
| 9 | South Hooksett | 116 | 5,902 | $130,000 | $546,044 | 4.2x |
| 10 | Newmarket | 115 | 5,679 | $87,196 | $553,162 | 6.3x |
| 11 | Derry | 114 | 21,339 | $91,673 | $493,914 | 5.4x |
| 12 | Exeter | 114 | 9,964 | $87,346 | $607,124 | 7.0x |
| 13 | Milford | 113 | 8,956 | $78,684 | $508,126 | 6.5x |
| 14 | Manchester | 112 | 115,643 | $81,007 | $435,334 | 5.4x |
| 15 | Hudson | 112 | 7,469 | $95,842 | $534,266 | 5.6x |
| 16 | Hooksett | 111 | 5,876 | $101,053 | $522,158 | 5.2x |
| 17 | Concord | 110 | 44,375 | $84,902 | $445,979 | 5.3x |
| 18 | Somersworth | 110 | 12,111 | $74,504 | $439,895 | 5.9x |
| 19 | East Merrimack | 110 | 5,081 | $87,311 | $367,433 | 4.2x |
| 20 | Keene | 108 | 22,939 | $78,445 | $341,420 | 4.4x |
| 21 | Suncook | 106 | 5,432 | $79,836 | $455,163 | 5.7x |
| 22 | Laconia | 105 | 17,085 | $73,218 | $434,892 | 5.9x |
| 23 | Franklin | 104 | 8,799 | $71,648 | $376,959 | 5.3x |
| 24 | Rochester | 103 | 33,144 | $80,836 | $398,492 | 4.9x |
| 25 | Berlin | 90 | 9,383 | $45,180 | $178,877 | 4.0x |
Source: U.S. Census ACS 2020-2024, Zillow research. 25 places with more than 5,000 residents.
Summary
Summary: Taking A Chunk Out Of Your Paycheck In New Hampshire For 2026
Well, there you have it, the places in New Hampshire that have the highest cost of living, with Hanover ranking as the most expensive city in the Granite State.
The most expensive cities in New Hampshire are Hanover, Portsmouth, Hampton, Durham, Londonderry, Nashua, Lebanon, Dover, South Hooksett, and Newmarket.


