Most Hispanic/Latino cities in Rhode Island research summary. We used Saturday Night Science to analyze Rhode Island’s most recent Census data to determine the most Hispanic/Latino cities based on the percentage of Hispanic/Latino residents. Here are the results of our analysis:
-
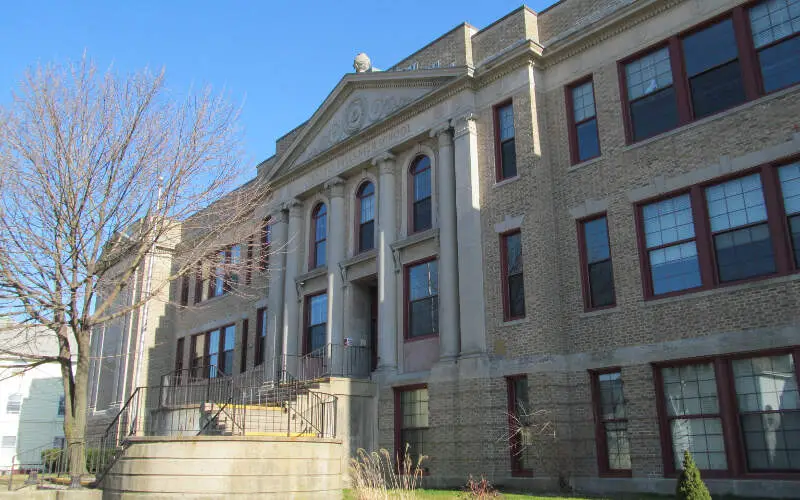
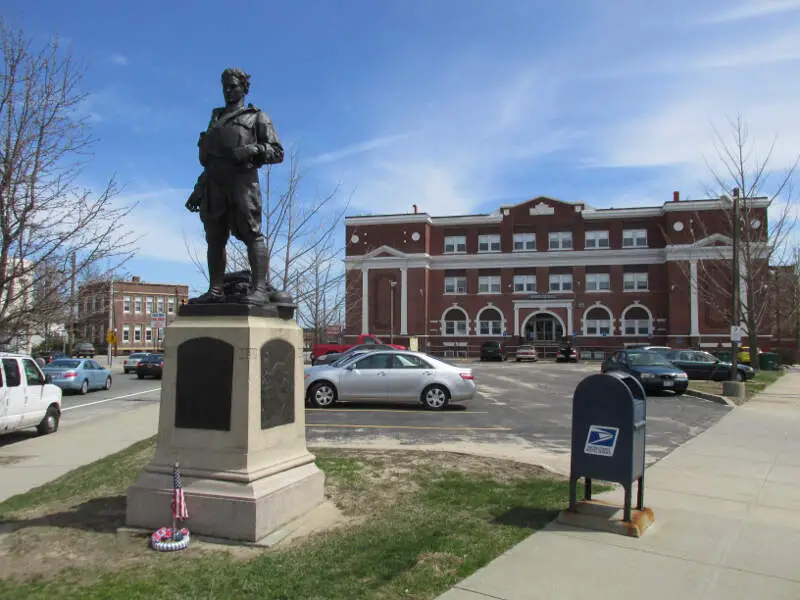
The most Hispanic/Latino city in Rhode Island is Central Falls, based on the most recent Census data.
-
Central Falls is 69.1% Hispanic/Latino.
-
The least Hispanic/Latino city in Rhode Island is Westerly.
-
Westerly is 3.26% Hispanic/Latino.
-
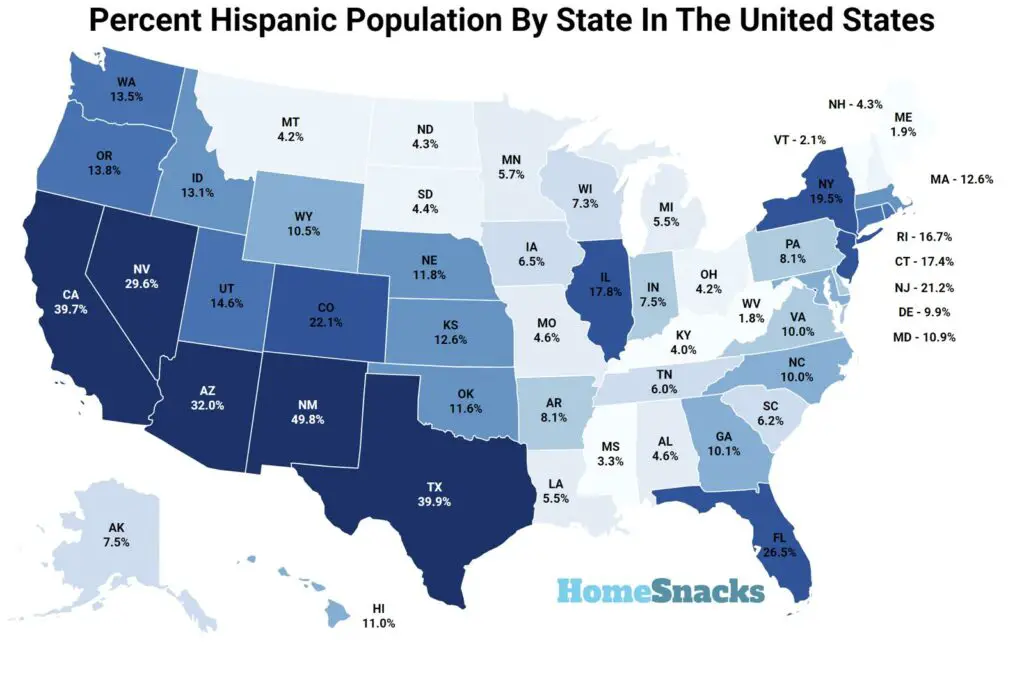
Rhode Island is 17.7% Hispanic/Latino.
-
Rhode Island is the 12th most Hispanic/Latino state in the United States.
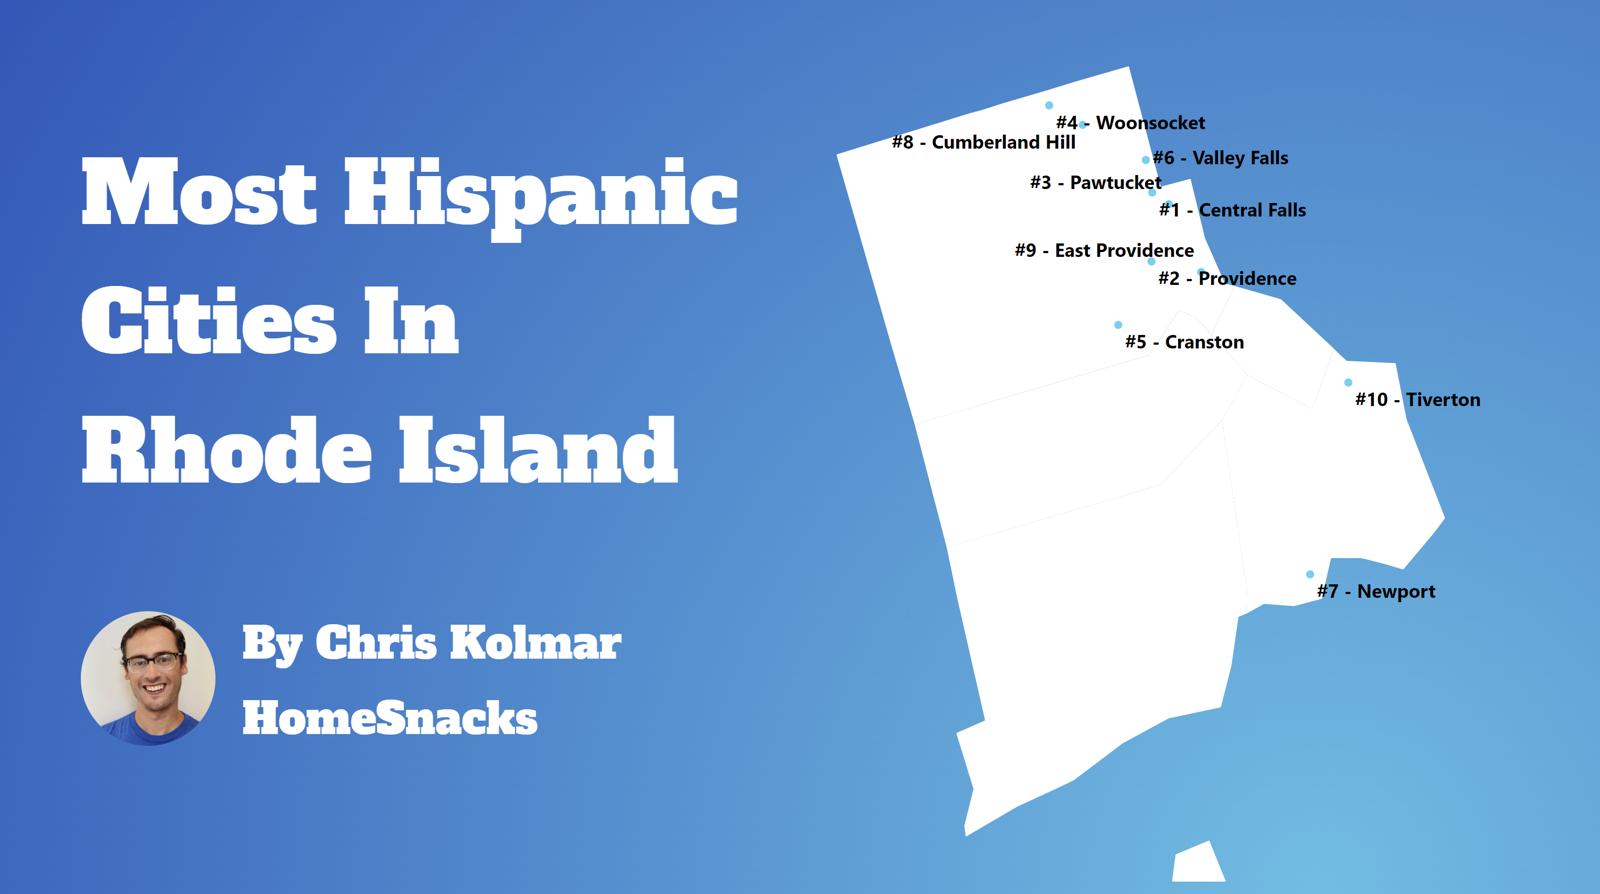
Table Of Contents: Top Ten | Methodology | Summary | Table
The 10 Cities In Rhode Island With The Largest Hispanic Population For 2026
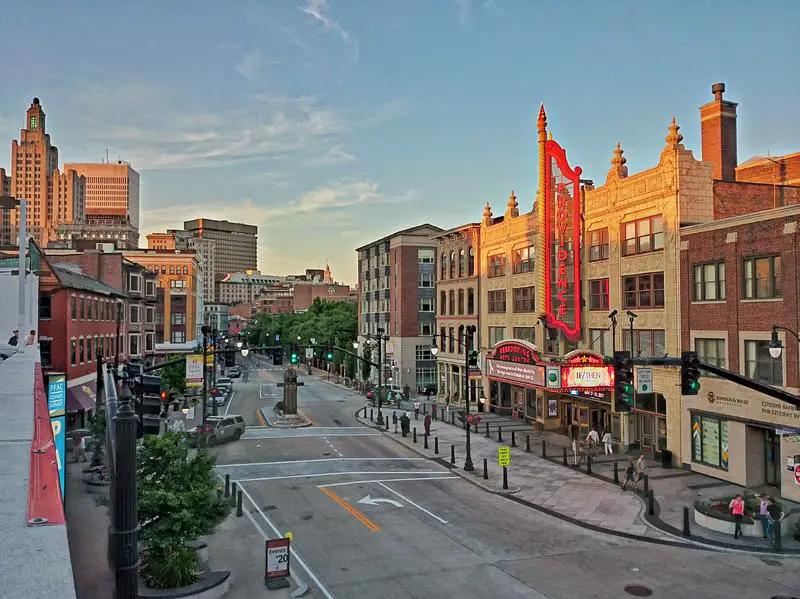
What’s the city in Rhode Island with the largest Hispanic/Latino population? Central Falls took the number one overall spot for the largest Hispanic population in Rhode Island for 2026.
Continue below to see how we crunched the numbers and how your town ranked.
To see where Rhode Island ranked as a state on diversity, we have a ranking of the most diverse states in America.
And if you already knew these places were Hispanic, check out the best places to live in Rhode Island or the safest places in Rhode Island.

/10
Population: 22,701
# Of Hispanic/Latino Residents: 15,686
% Hispanic/Latino: 69.1%
More on Central Falls: Data | Crime | Cost Of Living | Movers

/10
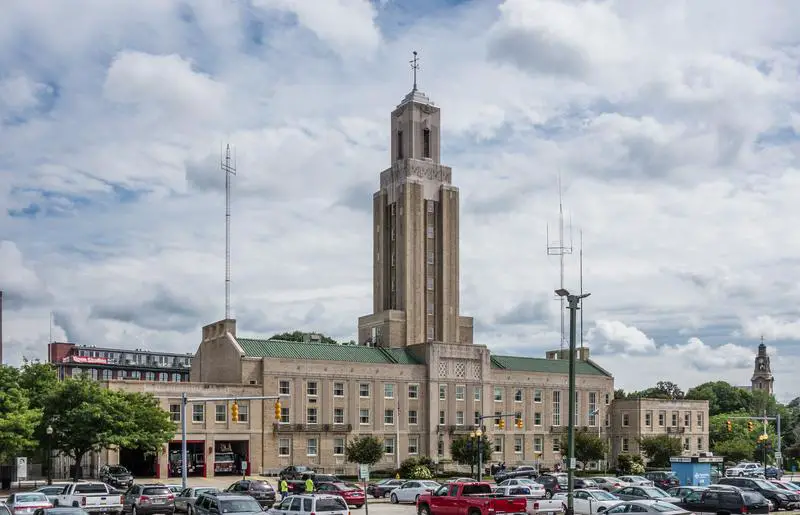
Population: 191,767
# Of Hispanic/Latino Residents: 86,835
% Hispanic/Latino: 45.28%
More on Providence: Data | Crime | Cost Of Living | Movers

/10
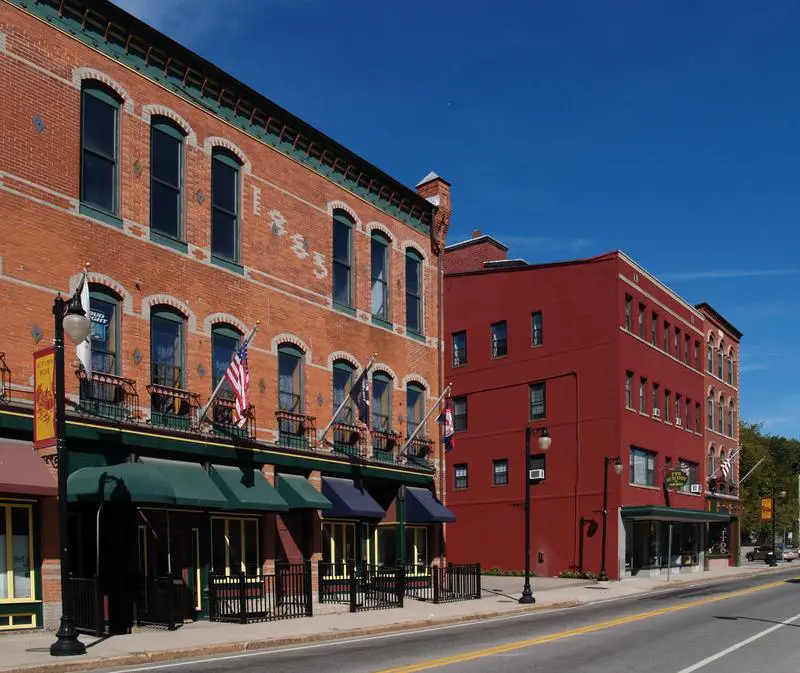
Population: 75,893
# Of Hispanic/Latino Residents: 20,336
% Hispanic/Latino: 26.8%
More on Pawtucket: Data | Crime | Cost Of Living | Movers

/10
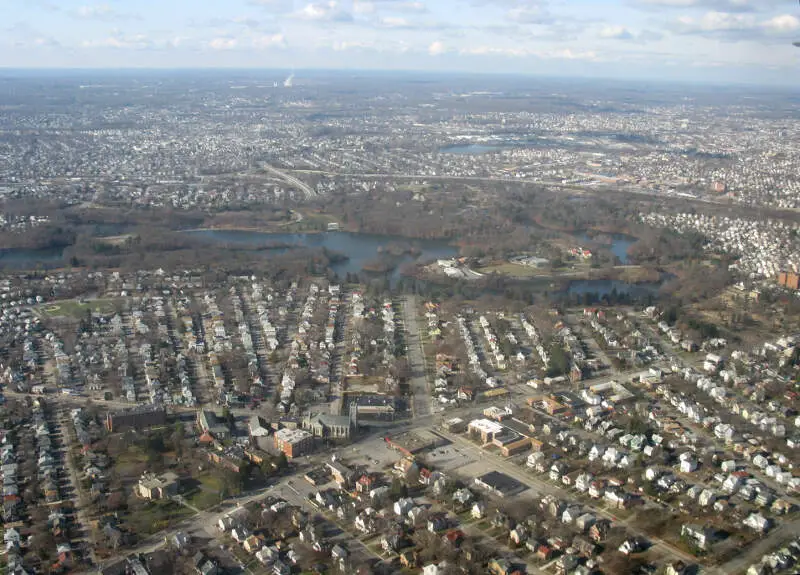
Population: 43,521
# Of Hispanic/Latino Residents: 11,115
% Hispanic/Latino: 25.54%
More on Woonsocket: Data | Crime | Cost Of Living | Movers

/10
Population: 83,250
# Of Hispanic/Latino Residents: 15,613
% Hispanic/Latino: 18.75%
More on Cranston: Data | Crime | Cost Of Living | Movers


/10
Population: 24,874
# Of Hispanic/Latino Residents: 2,608
% Hispanic/Latino: 10.48%
More on Newport: Data | Crime | Cost Of Living | Movers

/10
Population: 47,281
# Of Hispanic/Latino Residents: 4,440
% Hispanic/Latino: 9.39%
More on East Providence: Data | Crime | Cost Of Living | Movers

/10
Population: 7,332
# Of Hispanic/Latino Residents: 680
% Hispanic/Latino: 9.27%
More on Kingston: Data | Cost Of Living | Movers

/10
Population: 12,657
# Of Hispanic/Latino Residents: 1,159
% Hispanic/Latino: 9.16%
More on Valley Falls: Data | Cost Of Living | Movers

/10
Population: 11,069
# Of Hispanic/Latino Residents: 954
% Hispanic/Latino: 8.62%
More on Newport East: Data | Cost Of Living | Movers
Methodology: How We Determined The Cities In Rhode Island With The Largest Hispanic Population For 2026
We used Saturday Night Science to compare data on race from the US Census for every city in Rhode Island.
Rhode Island’s most recently available data comes from the 2020-2024 American Community Survey.
Specifically, we looked at table B03002: Hispanic OR LATINO ORIGIN BY RACE. Here are the category names as defined by the Census:
- Hispanic or Latino
- White alone*
- Black or African American alone*
- American Indian and Alaska Native alone*
- Asian alone*
- Native Hawaiian and Other Pacific Islander alone*
- Some other race alone*
- Two or more races*
Our particular column of interest here was the number of people who identified as Hispanic or Latino.
We limited our analysis to places in Rhode Island with a population greater than 7,000 people. That left us with 15 cities.
We then calculated the percentage of Hispanic or Latino residents in each Rhode Island city. The percentages ranked from 69.1% to 3.3%.
Finally, we ranked each city based on the percentage of the Hispanic or Latino population, with a higher score being more Hispanic or Latino than a lower score. Central Falls was the most Hispanic or Latino, while Westerly was the least Hispanic or Latino city.
We updated this article for 2026. This article represents our eleventh time ranking the cities in Rhode Island with the largest Hispanic/Latino population.
Read on for more information on how the cities in Rhode Island ranked by population of Hispanic or Latino residents or, for a more general take on diversity in America, head over to our ranking of the most diverse cities in America.
Summary: Hispanic or Latino Populations Across Rhode Island
According to the most recent data, this is an accurate list if you’re looking for a breakdown of Latino populations for each place across Rhode Island.
The most Hispanic/Latino cities in Rhode Island are Central Falls, Providence, Pawtucket, Woonsocket, Cranston, Newport, East Providence, Kingston, Valley Falls, and Newport East.
If you’re curious enough, here are the least Hispanic or Latino places in Rhode Island:
- Westerly
- Cumberland Hill
- Tiverton
For more Rhode Island reading, check out:
- Best Places To Live In Rhode Island
- Best Places To Raise A Family In Rhode Island
- Safest Places In Rhode Island
Most Hispanic Cities In Rhode Island
| Rank | City | Population | Hispanic Pop. | % Hispanic |
|---|---|---|---|---|
| 1 | Central Falls | 22,701 | 15,686 | 69.1% |
| 2 | Providence | 191,767 | 86,835 | 45.28% |
| 3 | Pawtucket | 75,893 | 20,336 | 26.8% |
| 4 | Woonsocket | 43,521 | 11,115 | 25.54% |
| 5 | Cranston | 83,250 | 15,613 | 18.75% |
| 6 | Newport | 24,874 | 2,608 | 10.48% |
| 7 | East Providence | 47,281 | 4,440 | 9.39% |
| 8 | Kingston | 7,332 | 680 | 9.27% |
| 9 | Valley Falls | 12,657 | 1,159 | 9.16% |
| 10 | Newport East | 11,069 | 954 | 8.62% |
| 11 | Warwick | 83,175 | 5,699 | 6.85% |
| 12 | Greenville | 8,296 | 407 | 4.91% |
| 13 | Tiverton | 8,091 | 384 | 4.75% |
| 14 | Cumberland Hill | 8,648 | 325 | 3.76% |
| 15 | Westerly | 18,411 | 601 | 3.26% |