Most Native American places in Oklahoma research summary. We used Saturday Night Science to research the Oklahoma cities with the highest percentage of Native American residents for 2026. The data comes from the American Community Survey 2020-2024 vintage, which breaks down race by origin.
The city with the highest percentage of Native Americans is Anadarko. 31.62% of people in Anadarko are Native Americans.
The city with the lowest percentage of Native Americans is Elk City. 0.62% of people in Elk City are Native American.
The city with the most Native Americans is Tulsa. 14,962 people in Tulsa are Native American.
The city with the fewest Native Americans is Elk City. 70 people in Elk City are Native American.
The United States has 1,698,432 Native Americans and is 0.51% Native American.
Which city in Oklahoma had the largest Native American population? The place with the largest Native American population in Oklahoma for 2026 is Anadarko. 31.62% of Anadarko identify as Native American.
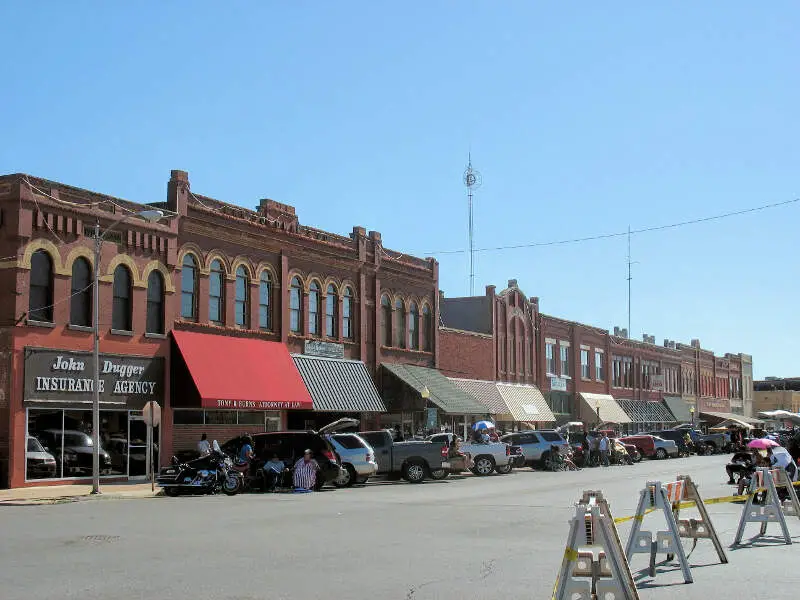
31.6% Native American · 1,762 Native American residents
Anadarko is a city in Caddo County, Oklahoma, United States. This city is fifty miles southwest of Oklahoma City. The population was 6,762 at the 2010 census, a 1.8 percent gain from 6,645 at the 2000 census. It is the county seat of Caddo County.
Data | Crime | Cost of living | Movers
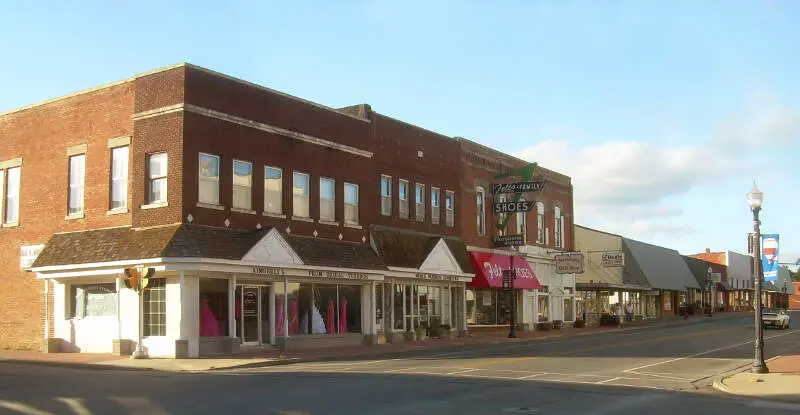
29.4% Native American · 4,980 Native American residents
Tahlequah is a city in Cherokee County, Oklahoma, United States located at the foothills of the Ozark Mountains. It is part of the Green Country region of Oklahoma and was established as a capital of the 19th-century Cherokee Nation in 1839, as part of the new settlement in Indian Territory after the Cherokee Native Americans were forced west from the American Southeast on the Trail of Tears.
Data | Crime | Cost of living | Movers
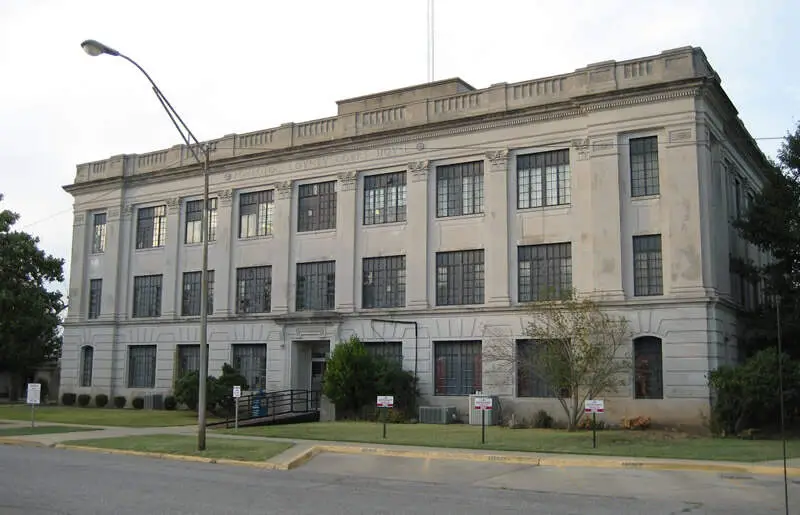
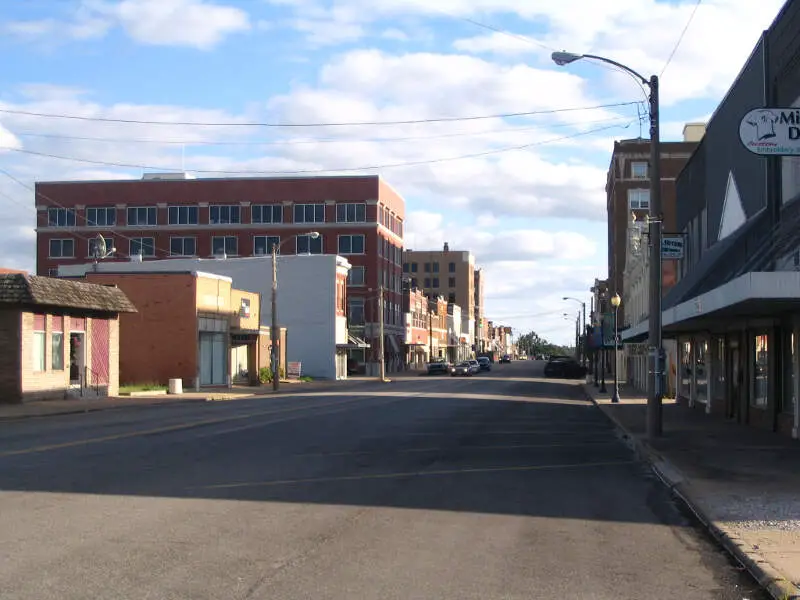
19.1% Native American · 3,171 Native American residents
Ada is a city in and the county seat of Pontotoc County, Oklahoma, United States. The population was 16,810 at the 2010 census, an increase of 7.1 percent from 15,691 at the 2000 census. The city was named for Ada Reed, the daughter of an early settler, and was incorporated in 1901. Ada is home to East Central University, and is the headquarters of the Chickasaw Nation.
Data | Crime | Cost of living | Movers
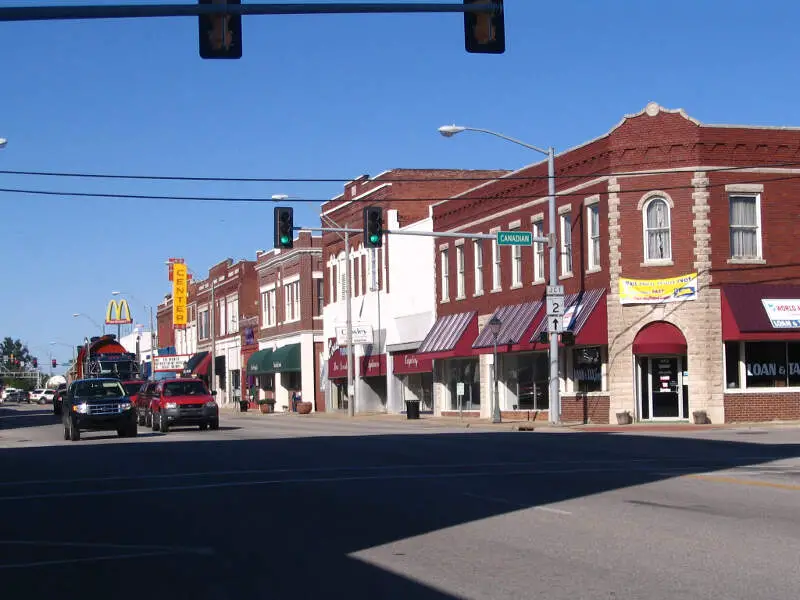
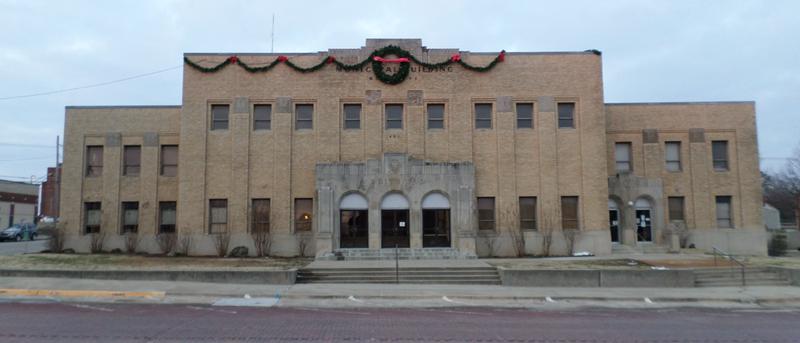
18.9% Native American · 1,001 Native American residents
Vinita is a city in south-central Craig County, in northeastern Oklahoma, United States. It is the county seat of Craig County. As of the 2010 census, the population was 5,743, a decrease of 11.22 percent from 6,469 at the 2000 census.
Data | Crime | Cost of living | Movers
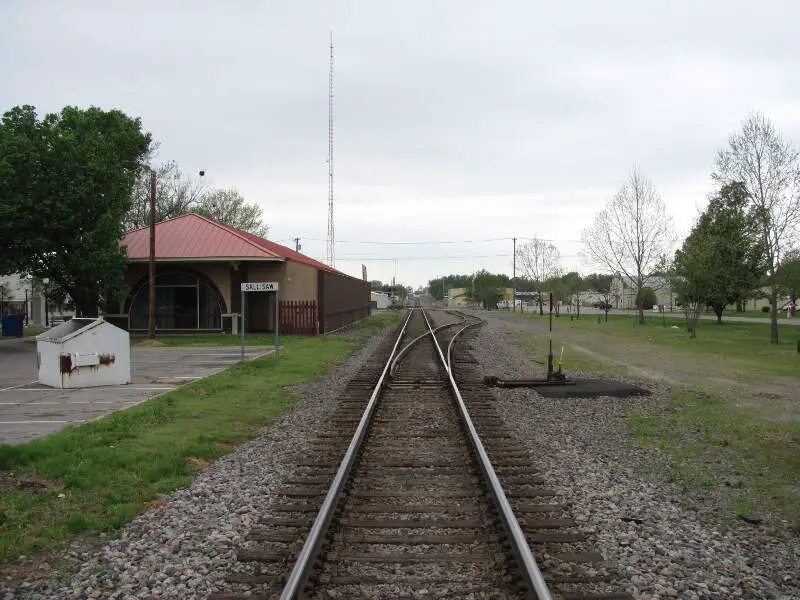
18.7% Native American · 1,612 Native American residents
Sallisaw is a city and county seat of Sequoyah County. The population was 8,880 at the 2010 Census, an 11.2 percent increase from 7,891 at the 2000 census. Sallisaw is part of the Fort Smith, Arkansas-Oklahoma Metropolitan Statistical Area.
Data | Crime | Cost of living | Movers
18.7% Native American · 1,342 Native American residents
Seminole is a city in Seminole County, Oklahoma, United States. The population was 6,899 at the 2000 census. Seminole experienced a large population growth in the 1920s due to an oil boom.
Data | Crime | Cost of living | Movers
18.6% Native American · 2,399 Native American residents
Miami is a city in and county seat of Ottawa County, Oklahoma, United States, founded in 1891. Lead and zinc mining established by 1918, caused it to boom. It is the capital of the Miami Tribe of Oklahoma, after which it is named, the Modoc Tribe of Oklahoma, Ottawa Tribe of Oklahoma, Peoria Tribe of Indians and Shawnee Tribe. As of the 2010 census, it had 13,570 inhabitants a one percent decline since 2000.
Data | Crime | Cost of living | Movers
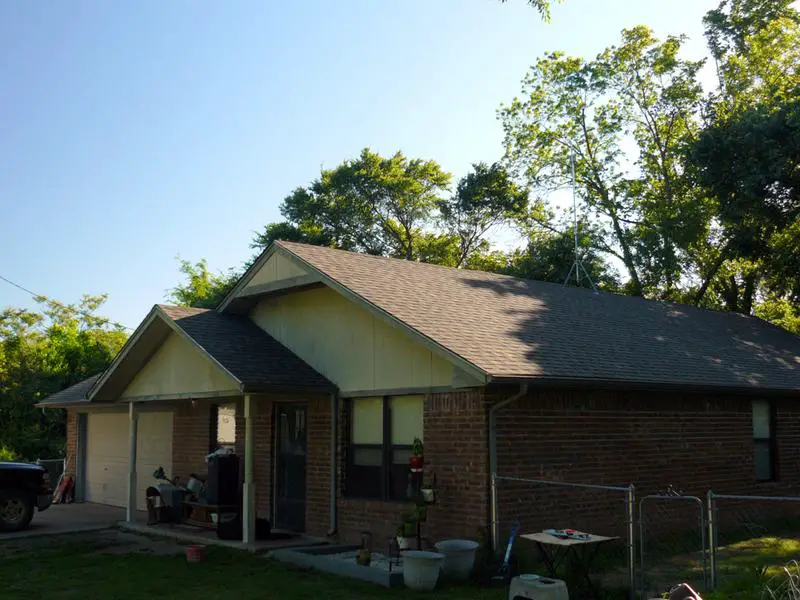
17.4% Native American · 974 Native American residents
Henryetta is a city in Okmulgee County, Oklahoma, United States. The population was 5,510 at the 2010 census, down 9.6 percent from 6,096 at the 2000 census.
Data | Crime | Cost of living | Movers
16.7% Native American · 988 Native American residents
Holdenville is a city in and county seat of Hughes County, Oklahoma, United States. The population was 5,771 at the 2010 census, an increase of 22 percent from 4,732 at the 2000 census.
Data | Crime | Cost of living | Movers
16.6% Native American · 3,349 Native American residents
Claremore is a city and the county seat of Rogers County in northeastern Oklahoma, United States. The population was 18,581 at the 2010 census, a 17.1 percent increase from 15,873 at the 2000 census. Located in the Ozark Mountains foothills, the city is part of the Tulsa Metropolitan Area and home to Rogers State University. It is best known as the birthplace and home of early 20th-century entertainer Will Rogers.
Data | Crime | Cost of living | Movers
The receipts
Compare the top ten
Pick a metric. The bars rescale. The red line is Oklahoma’s statewide median.
On the map
Where Oklahoma’s Native American population is concentrated
Saturday Night Science
Methodology: How We Determined The Cities In Oklahoma With The Largest Native American Population For 2026
We still believe in the accuracy of data — especially from the Census. So that’s where we went to get the race breakdown across Oklahoma.
We used Saturday Night Science to analyze the Census’s most recently available data, the 2020-2024 American Community Survey data.
Specifically, we looked at table B03002: Hispanic OR LATINO ORIGIN BY RACE. Here are the category names as defined by the Census:
- Hispanic or Latino
- White alone
- Black or African American alone
- American Indian and Alaska Native alone
- Asian alone
- Native Hawaiian and Other Pacific Islander alone
- Some other race alone
- Two or more races
Our particular column of interest here was the number of people identifying as American Indian and Alaska Native alone.
We limited our analysis to places with a population greater than 5,000 people. That left us with 71 cities.
We then calculated the percentage of residents that are American Indian and Alaska Native. The percentages ranked from 31.62 to 0.62.
Finally, we ranked each city based on the percentage of the American Indian and Alaska Native population, with a higher score being more American Indian and Alaska Native than a lower score. Anadarko took the distinction of being the most American Indian and Alaska Native, while Elk City was the least Native American city.
We updated this article for 2026. This article is our eleventh time ranking the cities in Oklahoma with the largest Native American population.
The full plate
Most Native American Places In Oklahoma
Click any column to sort. Search by city name.
| Rank | City | Population | Native American Population | % Native American |
|---|---|---|---|---|
| 1 | Anadarko | 5,572 | 1,762 | 31.6% |
| 2 | Tahlequah | 16,935 | 4,980 | 29.4% |
| 3 | Ada | 16,575 | 3,171 | 19.1% |
| 4 | Vinita | 5,300 | 1,001 | 18.9% |
| 5 | Sallisaw | 8,605 | 1,612 | 18.7% |
| 6 | Seminole | 7,194 | 1,342 | 18.7% |
| 7 | Miami | 12,926 | 2,399 | 18.6% |
| 8 | Henryetta | 5,608 | 974 | 17.4% |
| 9 | Holdenville | 5,902 | 988 | 16.7% |
| 10 | Claremore | 20,166 | 3,349 | 16.6% |
| 11 | Pryor Creek | 9,569 | 1,489 | 15.6% |
| 12 | Okmulgee | 11,348 | 1,661 | 14.6% |
| 13 | Tecumseh | 6,332 | 921 | 14.5% |
| 14 | Hugo | 5,182 | 752 | 14.5% |
| 15 | Catoosa | 7,496 | 1,078 | 14.4% |
| 16 | Muskogee | 36,758 | 5,206 | 14.2% |
| 17 | Durant | 19,746 | 2,630 | 13.3% |
| 18 | Sapulpa | 22,570 | 2,596 | 11.5% |
| 19 | Shawnee | 31,671 | 3,603 | 11.4% |
| 20 | Wagoner | 8,082 | 884 | 10.9% |
| 21 | Grove | 7,176 | 753 | 10.5% |
| 22 | McAlester | 18,111 | 1,681 | 9.3% |
| 23 | Coweta | 10,433 | 922 | 8.8% |
| 24 | Poteau | 8,959 | 762 | 8.5% |
| 25 | Glenpool | 14,151 | 1,115 | 7.9% |
| 26 | Collinsville | 8,878 | 690 | 7.8% |
| 27 | Sand Springs | 20,117 | 1,388 | 6.9% |
| 28 | El Reno | 18,557 | 1,278 | 6.9% |
| 29 | Ardmore | 24,877 | 1,689 | 6.8% |
| 30 | Cushing | 8,367 | 562 | 6.7% |
| 31 | Ponca City | 24,326 | 1,601 | 6.6% |
| 32 | Purcell | 6,803 | 425 | 6.2% |
| 33 | Owasso | 40,151 | 2,490 | 6.2% |
| 34 | Bartlesville | 37,878 | 2,321 | 6.1% |
| 35 | Idabel | 6,987 | 397 | 5.7% |
| 36 | Noble | 7,493 | 366 | 4.9% |
| 37 | Bixby | 30,155 | 1,460 | 4.8% |
| 38 | Harrah | 6,684 | 316 | 4.7% |
| 39 | Jenks | 27,102 | 1,248 | 4.6% |
| 40 | Tuttle | 8,040 | 370 | 4.6% |
| 41 | Newcastle | 13,001 | 597 | 4.6% |
| 42 | Chickasha | 16,539 | 741 | 4.5% |
| 43 | Clinton | 8,388 | 364 | 4.3% |
| 44 | Broken Arrow | 118,180 | 5,087 | 4.3% |
| 45 | Weatherford | 12,004 | 462 | 3.8% |
| 46 | Norman | 129,672 | 4,818 | 3.7% |
| 47 | Del City | 21,494 | 797 | 3.7% |
| 48 | Tulsa | 413,794 | 14,962 | 3.6% |
| 49 | Blackwell | 6,042 | 218 | 3.6% |
| 50 | Blanchard | 9,215 | 324 | 3.5% |
| 51 | Lawton | 90,595 | 3,016 | 3.3% |
| 52 | Stillwater | 49,269 | 1,517 | 3.1% |
| 53 | Woodward | 11,882 | 365 | 3.1% |
| 54 | Pauls Valley | 6,062 | 178 | 2.9% |
| 55 | Mustang | 22,192 | 631 | 2.8% |
| 56 | Duncan | 22,958 | 623 | 2.7% |
| 57 | Midwest City | 58,297 | 1,577 | 2.7% |
| 58 | Guthrie | 11,243 | 303 | 2.7% |
| 59 | Moore | 63,420 | 1,703 | 2.7% |
| 60 | Choctaw | 12,303 | 281 | 2.3% |
| 61 | Oklahoma City | 697,125 | 14,939 | 2.1% |
| 62 | Piedmont | 8,342 | 174 | 2.1% |
| 63 | The Village | 9,447 | 185 | 2.0% |
| 64 | Yukon | 25,529 | 426 | 1.7% |
| 65 | Bethany | 20,560 | 323 | 1.6% |
| 66 | Warr Acres | 10,466 | 124 | 1.2% |
| 67 | Edmond | 96,825 | 1,123 | 1.2% |
| 68 | Enid | 50,653 | 525 | 1.0% |
| 69 | Guymon | 12,539 | 110 | 0.9% |
| 70 | Altus | 18,646 | 163 | 0.9% |
| 71 | Elk City | 11,361 | 70 | 0.6% |
Source: U.S. Census ACS 2020-2024, table B03002. 71 Oklahoma cities with more than 5,000 residents.
Summary
Summary: Native American Populations Across Oklahoma
If you’re looking for a breakdown of Native American populations across Oklahoma according to the most recent data, this is an accurate list.
The most Native American cities in Oklahoma are Anadarko, Tahlequah, Ada, Vinita, Sallisaw, Seminole, Miami, Henryetta, Holdenville, and Claremore.


