Ardmore SnackAbility
Overall SnackAbility
Crime in Ardmore summary. We use data from the FBI to determine the crime rates in Ardmore. Key points include:
There were 1,057 total crimes in Ardmore in the last reporting year.
The overall crime rate per 100,000 people in Ardmore is 4,247.4 / 100k people.
The violent crime rate per 100,000 people in Ardmore is 1,141.2 / 100k people.
The property crime rate per 100,000 people in Ardmore is 3,106.2 / 100k people.
Overall, crime in Ardmore is 100.42% above the national average.
Total Crimes
Above National Average
Crime In Ardmore Comparison Table
| Statistic | Count Raw |
Ardmore / 100k People |
Oklahoma / 100k People |
National / 100k People |
|---|---|---|---|---|
| Total Crimes Per 100K | 1,057 | 4,247.4 | 2,400.6 | 2,119.2 |
| Violent Crime | 284 | 1,141.2 | 422.8 | 359.0 |
| Murder | 2 | 8.0 | 6.3 | 5.0 |
| Robbery | 6 | 24.1 | 38.2 | 61.0 |
| Aggravated Assault | 257 | 1,032.7 | 318.7 | 256.0 |
| Property Crime | 773 | 3,106.2 | 1,977.7 | 1,760.0 |
| Burglary | 107 | 430.0 | 411.4 | 229.0 |
| Larceny | 592 | 2,378.8 | 1,343.7 | 1,272.0 |
| Car Theft | 74 | 297.4 | 222.6 | 259.0 |
Source: FBI Uniform Crime Reporting (2024)
Cost of living in Ardmore summary. We use data on the cost of living to determine how expensive it is to live in Ardmore. Real estate prices drive most of the variance in cost of living around Oklahoma. Key points include:
The cost of living in Ardmore is 92 with 100 being average.
The cost of living in Ardmore is 0.9x lower than the national average.
The median home value in Ardmore is $152,584.
The median income in Ardmore is $53,900.
Ardmore's Overall Cost Of Living
Lower Than The National Average
Cost Of Living In Ardmore Comparison Table
| Living Expense | Ardmore | Oklahoma | National Average |
|---|---|---|---|
| Overall | 92 | 88 | 100 |
| Services | 99 | 96 | 100 |
| Groceries | 100 | 95 | 100 |
| Health | 70 | 69 | 100 |
| Housing | 97 | 98 | 100 |
| Transportation | 98 | 96 | 100 |
| Utilities | 99 | 92 | 100 |
Source: Cost of living index, normalized to US average = 100
Ardmore, OK Weather
The average high in Ardmore is 74.1° and the average low is 52.0°.
There are 53.0 days of precipitation each year.
Expect an average of 37.6 inches of precipitation each year with 3.2 inches of snow.
| Stat | Ardmore |
|---|---|
| Average Annual High | 74.1 |
| Average Annual Low | 52.0 |
| Annual Precipitation Days | 53.0 |
| Average Annual Precipitation | 37.6 |
| Average Annual Snowfall | 3.2 |
Average High
Days of Rain
Source: NOAA climate normals (30-year)
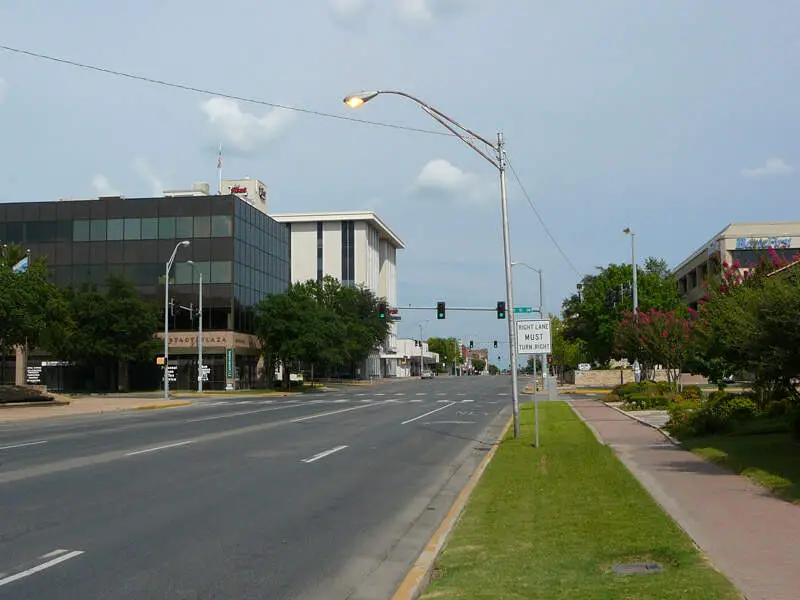
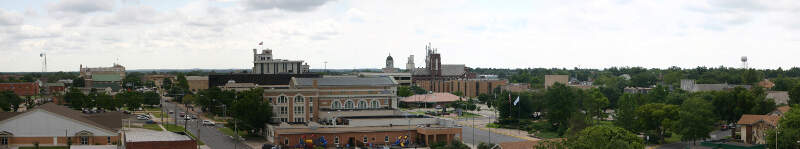
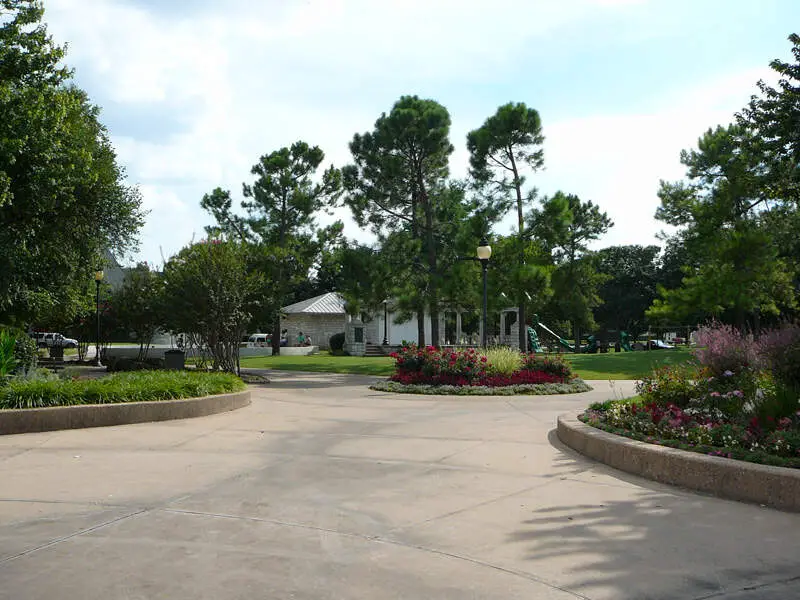
Ardmore, OK Photos
2 Reviews & Comments About Ardmore

Ardmore is a great place and I know I'm from Oklahoma
I understand. I live in Ardmore. I'm a single mom. I have a vocational certificate and some collage education. I grew up in Tennessee and when you say that to people they look down at your feet. They say you mean you actually wear shoes there. I reply yes with a smile on my face.
Every city, no matter how big or small, has educated and uneducated citizens and crime. It's just life. I enjoy living here on the outskirts of Ardmore. It's a beautiful city with much to offer.
Rankings & Articles For Ardmore


Locations Around Ardmore
Map Of Ardmore, OK
Best Places Around Ardmore
Gainesville, TX
Population 17,883
Sherman, TX
Population 46,397
Denison, TX
Population 25,778
Lone Grove, OK
Population 5,125
Ada, OK
Population 16,575
Sulphur, OK
Population 4,874
Pauls Valley, OK
Population 6,062
Durant, OK
Population 19,746
Ardmore Demographics And Statistics
Population over time in Ardmore
The current population in Ardmore is 24,877. The population has increased 3.0% from 2010.
| Year | Population | % Change |
|---|---|---|
| 2024 | 24,877 | 0.5% |
| 2023 | 24,757 | -0.1% |
| 2022 | 24,784 | -0.2% |
| 2021 | 24,829 | -0.0% |
| 2020 | 24,834 | 0.1% |
| 2019 | 24,821 | -0.3% |
| 2018 | 24,892 | -0.1% |
| 2017 | 24,927 | -0.4% |
| 2016 | 25,027 | 0.3% |
| 2015 | 24,955 | 0.3% |
| 2014 | 24,877 | 1.3% |
| 2013 | 24,553 | 0.7% |
| 2012 | 24,392 | 0.6% |
| 2011 | 24,246 | 0.4% |
| 2010 | 24,145 | - |
Race / Ethnicity in Ardmore
See the full breakdown
Ardmore is:
60.2% White with 14,979 White residents.
8.9% African American with 2,202 African American residents.
6.8% American Indian with 1,689 American Indian residents.
1.9% Asian with 469 Asian residents.
0.0% Hawaiian with 0 Hawaiian residents.
0.7% Other with 180 Other residents.
10.1% Two Or More with 2,524 Two Or More residents.
11.4% Hispanic with 2,834 Hispanic residents.
| Race | Ardmore | OK | USA |
|---|---|---|---|
| White | 60.2% | 62.1% | 57.4% |
| African American | 8.9% | 6.8% | 11.9% |
| American Indian | 6.8% | 6.6% | 0.5% |
| Asian | 1.9% | 2.4% | 5.9% |
| Hawaiian | 0.0% | 0.2% | 0.2% |
| Other | 0.7% | 0.3% | 0.6% |
| Two Or More | 10.1% | 8.9% | 4.3% |
| Hispanic | 11.4% | 12.7% | 19.3% |
Gender in Ardmore
See the full breakdown
Ardmore is 51.7% female with 12,870 female residents.
Ardmore is 48.3% male with 12,006 male residents.
| Gender | Ardmore | OK | USA |
|---|---|---|---|
| Female | 51.7% | 50.2% | 50.5% |
| Male | 48.3% | 49.8% | 49.5% |
Highest level of educational attainment in Ardmore for adults over 25
See the full breakdown
3.0% of adults in Ardmore completed < 9th grade.
10.0% of adults in Ardmore completed 9-12th grade.
35.0% of adults in Ardmore completed high school / ged.
22.0% of adults in Ardmore completed some college.
8.0% of adults in Ardmore completed associate's degree.
14.0% of adults in Ardmore completed bachelor's degree.
6.0% of adults in Ardmore completed master's degree.
1.0% of adults in Ardmore completed professional degree.
1.0% of adults in Ardmore completed doctorate degree.
| Education | Ardmore | OK | USA |
|---|---|---|---|
| < 9th Grade | 3.0% | 4.0% | 4.0% |
| 9-12th Grade | 10.0% | 7.0% | 6.0% |
| High School / GED | 35.0% | 31.0% | 26.0% |
| Some College | 22.0% | 22.0% | 19.0% |
| Associate's Degree | 8.0% | 8.0% | 9.0% |
| Bachelor's Degree | 14.0% | 18.0% | 22.0% |
| Master's Degree | 6.0% | 7.0% | 10.0% |
| Professional Degree | 1.0% | 2.0% | 2.0% |
| Doctorate Degree | 1.0% | 1.0% | 2.0% |
Household Income For Ardmore, Oklahoma
See the full breakdown
6.0% of households in Ardmore earn Less than $10,000.
4.9% of households in Ardmore earn $10,000 to $14,999.
9.4% of households in Ardmore earn $15,000 to $24,999.
10.8% of households in Ardmore earn $25,000 to $34,999.
15.2% of households in Ardmore earn $35,000 to $49,999.
19.4% of households in Ardmore earn $50,000 to $74,999.
11.0% of households in Ardmore earn $75,000 to $99,999.
12.8% of households in Ardmore earn $100,000 to $149,999.
5.1% of households in Ardmore earn $150,000 to $199,999.
5.4% of households in Ardmore earn $200,000 or more.
| Income | Ardmore | OK | USA |
|---|---|---|---|
| Less than $10,000 | 6.0% | 5.9% | 5.0% |
| $10,000 to $14,999 | 4.9% | 4.1% | 3.4% |
| $15,000 to $24,999 | 9.4% | 7.6% | 6.3% |
| $25,000 to $34,999 | 10.8% | 8.8% | 6.6% |
| $35,000 to $49,999 | 15.2% | 12.1% | 10.1% |
| $50,000 to $74,999 | 19.4% | 18.0% | 15.5% |
| $75,000 to $99,999 | 11.0% | 13.1% | 12.6% |
| $100,000 to $149,999 | 12.8% | 16.1% | 17.5% |
| $150,000 to $199,999 | 5.1% | 7.2% | 9.6% |
| $200,000 or more | 5.4% | 7.2% | 13.4% |
Source: U.S. Census ACS 5-year estimates (2024)


