Ada SnackAbility
Overall SnackAbility
Crime in Ada summary. We use data from the FBI to determine the crime rates in Ada. Key points include:
There were 399 total crimes in Ada in the last reporting year.
The overall crime rate per 100,000 people in Ada is 2,395.7 / 100k people.
The violent crime rate per 100,000 people in Ada is 468.3 / 100k people.
The property crime rate per 100,000 people in Ada is 1,927.3 / 100k people.
Overall, crime in Ada is 13.04% above the national average.
Total Crimes
Above National Average
Crime In Ada Comparison Table
| Statistic | Count Raw |
Ada / 100k People |
Oklahoma / 100k People |
National / 100k People |
|---|---|---|---|---|
| Total Crimes Per 100K | 399 | 2,395.7 | 2,400.6 | 2,119.2 |
| Violent Crime | 78 | 468.3 | 422.8 | 359.0 |
| Murder | 1 | 6.0 | 6.3 | 5.0 |
| Robbery | 4 | 24.0 | 38.2 | 61.0 |
| Aggravated Assault | 61 | 366.3 | 318.7 | 256.0 |
| Property Crime | 321 | 1,927.3 | 1,977.7 | 1,760.0 |
| Burglary | 73 | 438.3 | 411.4 | 229.0 |
| Larceny | 225 | 1,350.9 | 1,343.7 | 1,272.0 |
| Car Theft | 23 | 138.1 | 222.6 | 259.0 |
Source: FBI Uniform Crime Reporting (2024)
Cost of living in Ada summary. We use data on the cost of living to determine how expensive it is to live in Ada. Real estate prices drive most of the variance in cost of living around Oklahoma. Key points include:
The cost of living in Ada is 85 with 100 being average.
The cost of living in Ada is 0.8x lower than the national average.
The median home value in Ada is $180,731.
The median income in Ada is $53,507.
Ada's Overall Cost Of Living
Lower Than The National Average
Cost Of Living In Ada Comparison Table
| Living Expense | Ada | Oklahoma | National Average |
|---|---|---|---|
| Overall | 85 | 88 | 100 |
| Services | 100 | 96 | 100 |
| Groceries | 99 | 95 | 100 |
| Health | 65 | 69 | 100 |
| Housing | 99 | 98 | 100 |
| Transportation | 98 | 96 | 100 |
| Utilities | 97 | 92 | 100 |
Source: Cost of living index, normalized to US average = 100
Ada, OK Weather
The average high in Ada is 73.0° and the average low is 50.2°.
There are 58.9 days of precipitation each year.
Expect an average of 41.2 inches of precipitation each year with 4.1 inches of snow.
| Stat | Ada |
|---|---|
| Average Annual High | 73.0 |
| Average Annual Low | 50.2 |
| Annual Precipitation Days | 58.9 |
| Average Annual Precipitation | 41.2 |
| Average Annual Snowfall | 4.1 |
Average High
Days of Rain
Source: NOAA climate normals (30-year)
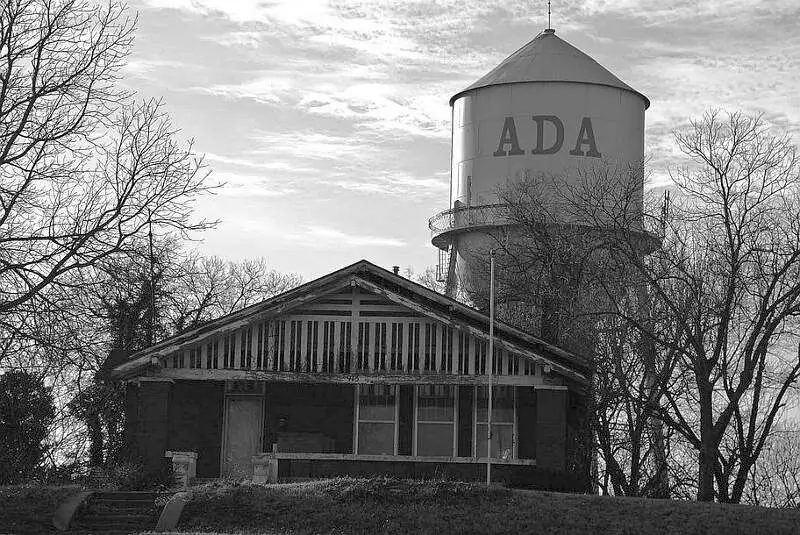
Ada, OK Photos


1 Reviews & Comments About Ada

I used to like Ada, now I don't. The crime has been climbing due to drugs. People say its because we are a college town. This place used to be like a really nice small town feel. Rich people have been moving in and now its growing and its lost that. Doctors are plentiful but they seem to be not so good and very inexperienced. It has a movie theater and lots of fast food and a nice park but thats all there is to do.
The park stood out. It used to have a zoo type place. For a small town it even had monkeys. they let the monkeys die and the petting zoo is closed. The park is surrounded by a small lake which is the favorite of mine. The city keeps it clean.
Rankings & Articles For Ada


Locations Around Ada
Map Of Ada, OK
Best Places Around Ada
Noble, OK
Population 7,493
Slaughterville, OK
Population 4,251
Purcell, OK
Population 6,803
Sulphur, OK
Population 4,874
Pauls Valley, OK
Population 6,062
Tecumseh, OK
Population 6,332
Holdenville, OK
Population 5,902
Shawnee, OK
Population 31,671
Ardmore, OK
Population 24,877
Seminole, OK
Population 7,194
Ada Demographics And Statistics
Population over time in Ada
The current population in Ada is 16,575. The population has increased 0.2% from 2010.
| Year | Population | % Change |
|---|---|---|
| 2024 | 16,575 | 0.2% |
| 2023 | 16,536 | -0.0% |
| 2022 | 16,537 | -1.6% |
| 2021 | 16,804 | -3.4% |
| 2020 | 17,399 | 0.8% |
| 2019 | 17,260 | -0.1% |
| 2018 | 17,276 | 0.1% |
| 2017 | 17,262 | 0.1% |
| 2016 | 17,240 | 0.5% |
| 2015 | 17,149 | 0.5% |
| 2014 | 17,061 | 0.5% |
| 2013 | 16,978 | 0.7% |
| 2012 | 16,852 | 1.0% |
| 2011 | 16,679 | 0.8% |
| 2010 | 16,543 | - |
Race / Ethnicity in Ada
See the full breakdown
Ada is:
58.2% White with 9,640 White residents.
5.1% African American with 847 African American residents.
19.1% American Indian with 3,171 American Indian residents.
1.5% Asian with 249 Asian residents.
0.1% Hawaiian with 16 Hawaiian residents.
0.0% Other with 0 Other residents.
7.9% Two Or More with 1,317 Two Or More residents.
8.1% Hispanic with 1,335 Hispanic residents.
| Race | Ada | OK | USA |
|---|---|---|---|
| White | 58.2% | 62.1% | 57.4% |
| African American | 5.1% | 6.8% | 11.9% |
| American Indian | 19.1% | 6.6% | 0.5% |
| Asian | 1.5% | 2.4% | 5.9% |
| Hawaiian | 0.1% | 0.2% | 0.2% |
| Other | 0.0% | 0.3% | 0.6% |
| Two Or More | 7.9% | 8.9% | 4.3% |
| Hispanic | 8.1% | 12.7% | 19.3% |
Gender in Ada
See the full breakdown
Ada is 52.0% female with 8,627 female residents.
Ada is 48.0% male with 7,948 male residents.
| Gender | Ada | OK | USA |
|---|---|---|---|
| Female | 52.0% | 50.2% | 50.5% |
| Male | 48.0% | 49.8% | 49.5% |
Highest level of educational attainment in Ada for adults over 25
See the full breakdown
5.0% of adults in Ada completed < 9th grade.
7.0% of adults in Ada completed 9-12th grade.
30.0% of adults in Ada completed high school / ged.
19.0% of adults in Ada completed some college.
9.0% of adults in Ada completed associate's degree.
18.0% of adults in Ada completed bachelor's degree.
9.0% of adults in Ada completed master's degree.
1.0% of adults in Ada completed professional degree.
2.0% of adults in Ada completed doctorate degree.
| Education | Ada | OK | USA |
|---|---|---|---|
| < 9th Grade | 5.0% | 4.0% | 4.0% |
| 9-12th Grade | 7.0% | 7.0% | 6.0% |
| High School / GED | 30.0% | 31.0% | 26.0% |
| Some College | 19.0% | 22.0% | 19.0% |
| Associate's Degree | 9.0% | 8.0% | 9.0% |
| Bachelor's Degree | 18.0% | 18.0% | 22.0% |
| Master's Degree | 9.0% | 7.0% | 10.0% |
| Professional Degree | 1.0% | 2.0% | 2.0% |
| Doctorate Degree | 2.0% | 1.0% | 2.0% |
Household Income For Ada, Oklahoma
See the full breakdown
4.5% of households in Ada earn Less than $10,000.
7.4% of households in Ada earn $10,000 to $14,999.
8.3% of households in Ada earn $15,000 to $24,999.
12.6% of households in Ada earn $25,000 to $34,999.
14.7% of households in Ada earn $35,000 to $49,999.
18.7% of households in Ada earn $50,000 to $74,999.
10.4% of households in Ada earn $75,000 to $99,999.
14.4% of households in Ada earn $100,000 to $149,999.
4.8% of households in Ada earn $150,000 to $199,999.
4.0% of households in Ada earn $200,000 or more.
| Income | Ada | OK | USA |
|---|---|---|---|
| Less than $10,000 | 4.5% | 5.9% | 5.0% |
| $10,000 to $14,999 | 7.4% | 4.1% | 3.4% |
| $15,000 to $24,999 | 8.3% | 7.6% | 6.3% |
| $25,000 to $34,999 | 12.6% | 8.8% | 6.6% |
| $35,000 to $49,999 | 14.7% | 12.1% | 10.1% |
| $50,000 to $74,999 | 18.7% | 18.0% | 15.5% |
| $75,000 to $99,999 | 10.4% | 13.1% | 12.6% |
| $100,000 to $149,999 | 14.4% | 16.1% | 17.5% |
| $150,000 to $199,999 | 4.8% | 7.2% | 9.6% |
| $200,000 or more | 4.0% | 7.2% | 13.4% |
Source: U.S. Census ACS 5-year estimates (2024)


