Claremore SnackAbility
Overall SnackAbility
Crime in Claremore summary. We use data from the FBI to determine the crime rates in Claremore. Key points include:
There were 395 total crimes in Claremore in the last reporting year.
The overall crime rate per 100,000 people in Claremore is 1,913.3 / 100k people.
The violent crime rate per 100,000 people in Claremore is 290.6 / 100k people.
The property crime rate per 100,000 people in Claremore is 1,622.7 / 100k people.
Overall, crime in Claremore is -9.72% below the national average.
Total Crimes
Below National Average
Crime In Claremore Comparison Table
| Statistic | Count Raw |
Claremore / 100k People |
Oklahoma / 100k People |
National / 100k People |
|---|---|---|---|---|
| Total Crimes Per 100K | 395 | 1,913.3 | 2,400.6 | 2,119.2 |
| Violent Crime | 60 | 290.6 | 422.8 | 359.0 |
| Murder | 0 | 0.0 | 6.3 | 5.0 |
| Robbery | 0 | 0.0 | 38.2 | 61.0 |
| Aggravated Assault | 46 | 222.8 | 318.7 | 256.0 |
| Property Crime | 335 | 1,622.7 | 1,977.7 | 1,760.0 |
| Burglary | 62 | 300.3 | 411.4 | 229.0 |
| Larceny | 256 | 1,240.0 | 1,343.7 | 1,272.0 |
| Car Theft | 17 | 82.3 | 222.6 | 259.0 |
Source: FBI Uniform Crime Reporting (2024)
Cost of living in Claremore summary. We use data on the cost of living to determine how expensive it is to live in Claremore. Real estate prices drive most of the variance in cost of living around Oklahoma. Key points include:
The cost of living in Claremore is 88 with 100 being average.
The cost of living in Claremore is 0.9x lower than the national average.
The median home value in Claremore is $257,871.
The median income in Claremore is $58,685.
Claremore's Overall Cost Of Living
Lower Than The National Average
Cost Of Living In Claremore Comparison Table
| Living Expense | Claremore | Oklahoma | National Average |
|---|---|---|---|
| Overall | 88 | 88 | 100 |
| Services | 98 | 96 | 100 |
| Groceries | 96 | 95 | 100 |
| Health | 77 | 69 | 100 |
| Housing | 99 | 98 | 100 |
| Transportation | 96 | 96 | 100 |
| Utilities | 94 | 92 | 100 |
Source: Cost of living index, normalized to US average = 100
Claremore, OK Weather
The average high in Claremore is 70.4° and the average low is 47.9°.
There are 64.6 days of precipitation each year.
Expect an average of 43.9 inches of precipitation each year with 9.2 inches of snow.
| Stat | Claremore |
|---|---|
| Average Annual High | 70.4 |
| Average Annual Low | 47.9 |
| Annual Precipitation Days | 64.6 |
| Average Annual Precipitation | 43.9 |
| Average Annual Snowfall | 9.2 |
Average High
Days of Rain
Source: NOAA climate normals (30-year)
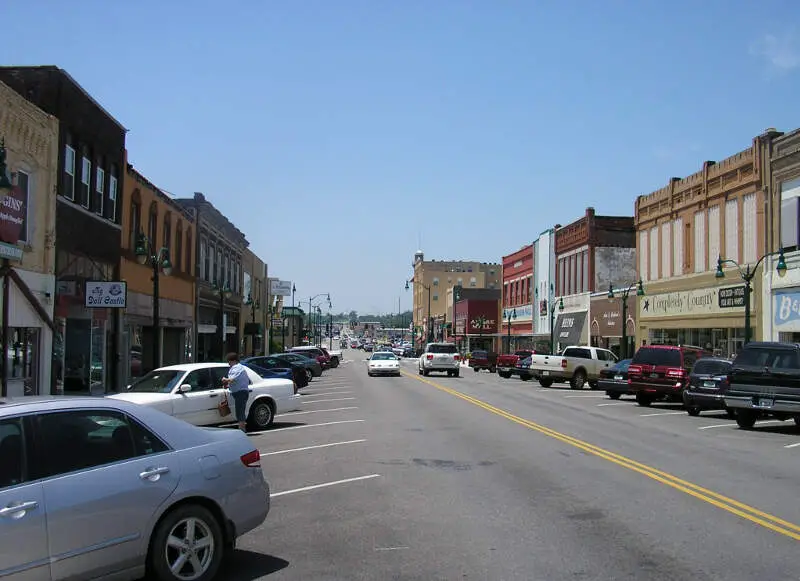
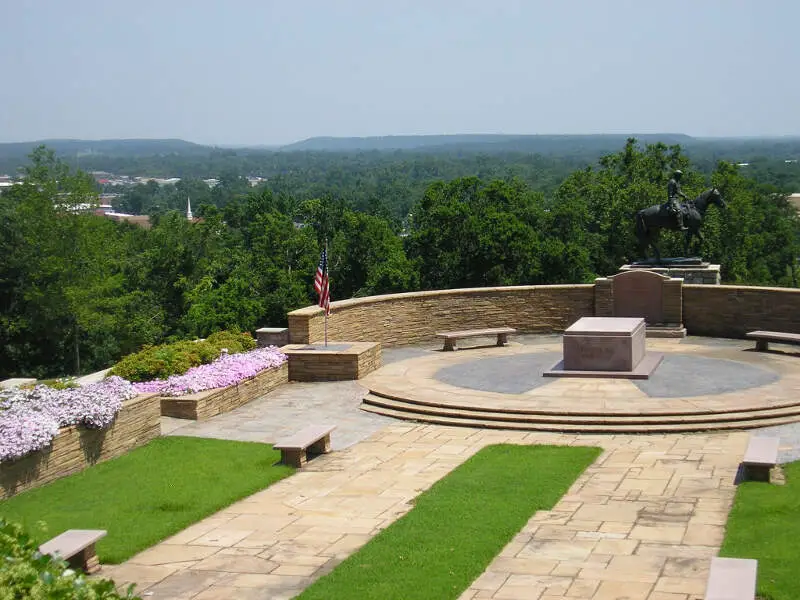
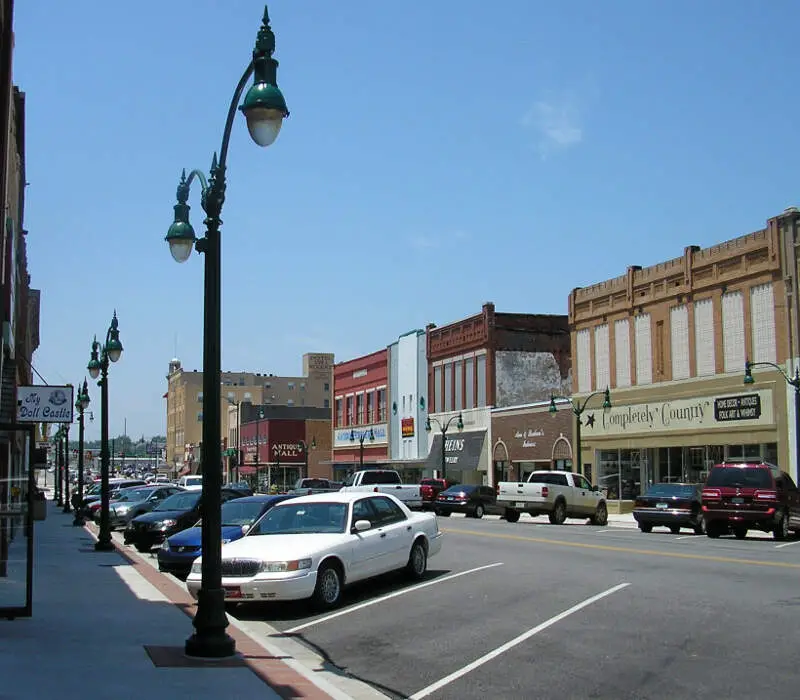
Claremore, OK Photos
1 Reviews & Comments About Claremore

Crime is relatively low. Most people think very black and white. Good luck finding thought provoking conversation. It usually doesn't happen. There's a college in town that's okay. People are usually nice to your face. A few great people and a lot of backwards people. Not much to do here Definitely not the best in Oklahoma, but definitely not the worst.
Mainstreet Tavern, J Farley's, The Belvidere Mansion, Claremore Lake. That's about it.
Rankings & Articles For Claremore


Locations Around Claremore
Map Of Claremore, OK
Best Places Around Claremore
Owasso, OK
Population 40,151
Catoosa, OK
Population 7,496
Collinsville, OK
Population 8,878
Pryor Creek, OK
Population 9,569
Claremore Demographics And Statistics
Population over time in Claremore
The current population in Claremore is 20,166. The population has increased 9.5% from 2010.
| Year | Population | % Change |
|---|---|---|
| 2024 | 20,166 | 1.2% |
| 2023 | 19,921 | 1.0% |
| 2022 | 19,724 | 2.9% |
| 2021 | 19,173 | 1.6% |
| 2020 | 18,875 | 0.7% |
| 2019 | 18,753 | -0.1% |
| 2018 | 18,780 | 0.0% |
| 2017 | 18,777 | -1.2% |
| 2016 | 18,999 | 0.4% |
| 2015 | 18,922 | 0.4% |
| 2014 | 18,849 | 0.4% |
| 2013 | 18,777 | 0.6% |
| 2012 | 18,669 | 0.7% |
| 2011 | 18,548 | 0.7% |
| 2010 | 18,416 | - |
Race / Ethnicity in Claremore
See the full breakdown
Claremore is:
64.0% White with 12,908 White residents.
2.1% African American with 419 African American residents.
16.6% American Indian with 3,349 American Indian residents.
0.7% Asian with 142 Asian residents.
0.1% Hawaiian with 14 Hawaiian residents.
0.2% Other with 44 Other residents.
8.6% Two Or More with 1,744 Two Or More residents.
7.7% Hispanic with 1,546 Hispanic residents.
| Race | Claremore | OK | USA |
|---|---|---|---|
| White | 64.0% | 62.1% | 57.4% |
| African American | 2.1% | 6.8% | 11.9% |
| American Indian | 16.6% | 6.6% | 0.5% |
| Asian | 0.7% | 2.4% | 5.9% |
| Hawaiian | 0.1% | 0.2% | 0.2% |
| Other | 0.2% | 0.3% | 0.6% |
| Two Or More | 8.6% | 8.9% | 4.3% |
| Hispanic | 7.7% | 12.7% | 19.3% |
Gender in Claremore
See the full breakdown
Claremore is 52.2% female with 10,528 female residents.
Claremore is 47.8% male with 9,638 male residents.
| Gender | Claremore | OK | USA |
|---|---|---|---|
| Female | 52.2% | 50.2% | 50.5% |
| Male | 47.8% | 49.8% | 49.5% |
Highest level of educational attainment in Claremore for adults over 25
See the full breakdown
2.0% of adults in Claremore completed < 9th grade.
5.0% of adults in Claremore completed 9-12th grade.
37.0% of adults in Claremore completed high school / ged.
23.0% of adults in Claremore completed some college.
10.0% of adults in Claremore completed associate's degree.
15.0% of adults in Claremore completed bachelor's degree.
6.0% of adults in Claremore completed master's degree.
1.0% of adults in Claremore completed professional degree.
1.0% of adults in Claremore completed doctorate degree.
| Education | Claremore | OK | USA |
|---|---|---|---|
| < 9th Grade | 2.0% | 4.0% | 4.0% |
| 9-12th Grade | 5.0% | 7.0% | 6.0% |
| High School / GED | 37.0% | 31.0% | 26.0% |
| Some College | 23.0% | 22.0% | 19.0% |
| Associate's Degree | 10.0% | 8.0% | 9.0% |
| Bachelor's Degree | 15.0% | 18.0% | 22.0% |
| Master's Degree | 6.0% | 7.0% | 10.0% |
| Professional Degree | 1.0% | 2.0% | 2.0% |
| Doctorate Degree | 1.0% | 1.0% | 2.0% |
Household Income For Claremore, Oklahoma
See the full breakdown
3.7% of households in Claremore earn Less than $10,000.
3.4% of households in Claremore earn $10,000 to $14,999.
8.8% of households in Claremore earn $15,000 to $24,999.
11.8% of households in Claremore earn $25,000 to $34,999.
13.3% of households in Claremore earn $35,000 to $49,999.
22.9% of households in Claremore earn $50,000 to $74,999.
12.7% of households in Claremore earn $75,000 to $99,999.
16.0% of households in Claremore earn $100,000 to $149,999.
3.8% of households in Claremore earn $150,000 to $199,999.
3.5% of households in Claremore earn $200,000 or more.
| Income | Claremore | OK | USA |
|---|---|---|---|
| Less than $10,000 | 3.7% | 5.9% | 5.0% |
| $10,000 to $14,999 | 3.4% | 4.1% | 3.4% |
| $15,000 to $24,999 | 8.8% | 7.6% | 6.3% |
| $25,000 to $34,999 | 11.8% | 8.8% | 6.6% |
| $35,000 to $49,999 | 13.3% | 12.1% | 10.1% |
| $50,000 to $74,999 | 22.9% | 18.0% | 15.5% |
| $75,000 to $99,999 | 12.7% | 13.1% | 12.6% |
| $100,000 to $149,999 | 16.0% | 16.1% | 17.5% |
| $150,000 to $199,999 | 3.8% | 7.2% | 9.6% |
| $200,000 or more | 3.5% | 7.2% | 13.4% |
Source: U.S. Census ACS 5-year estimates (2024)


