Seminole SnackAbility
Overall SnackAbility
Crime in Seminole summary. We use data from the FBI to determine the crime rates in Seminole. Key points include:
There were 185 total crimes in Seminole in the last reporting year.
The overall crime rate per 100,000 people in Seminole is 2,531.5 / 100k people.
The violent crime rate per 100,000 people in Seminole is 369.5 / 100k people.
The property crime rate per 100,000 people in Seminole is 2,162.0 / 100k people.
Overall, crime in Seminole is 19.45% above the national average.
Total Crimes
Above National Average
Crime In Seminole Comparison Table
| Statistic | Count Raw |
Seminole / 100k People |
Oklahoma / 100k People |
National / 100k People |
|---|---|---|---|---|
| Total Crimes Per 100K | 185 | 2,531.5 | 2,400.6 | 2,119.2 |
| Violent Crime | 27 | 369.5 | 422.8 | 359.0 |
| Murder | 0 | 0.0 | 6.3 | 5.0 |
| Robbery | 0 | 0.0 | 38.2 | 61.0 |
| Aggravated Assault | 24 | 328.4 | 318.7 | 256.0 |
| Property Crime | 158 | 2,162.0 | 1,977.7 | 1,760.0 |
| Burglary | 24 | 328.4 | 411.4 | 229.0 |
| Larceny | 109 | 1,491.5 | 1,343.7 | 1,272.0 |
| Car Theft | 25 | 342.1 | 222.6 | 259.0 |
Source: FBI Uniform Crime Reporting (2024)
Cost of living in Seminole summary. We use data on the cost of living to determine how expensive it is to live in Seminole. Real estate prices drive most of the variance in cost of living around Oklahoma. Key points include:
The cost of living in Seminole is 83 with 100 being average.
The cost of living in Seminole is 0.8x lower than the national average.
The median home value in Seminole is $128,772.
The median income in Seminole is $39,121.
Seminole's Overall Cost Of Living
Lower Than The National Average
Cost Of Living In Seminole Comparison Table
| Living Expense | Seminole | Oklahoma | National Average |
|---|---|---|---|
| Overall | 83 | 88 | 100 |
| Services | 98 | 96 | 100 |
| Groceries | 96 | 95 | 100 |
| Health | 43 | 69 | 100 |
| Housing | 96 | 98 | 100 |
| Transportation | 95 | 96 | 100 |
| Utilities | 93 | 92 | 100 |
Source: Cost of living index, normalized to US average = 100
Seminole, OK Weather
The average high in Seminole is 72.7° and the average low is 49.7°.
There are 56.2 days of precipitation each year.
Expect an average of 41.8 inches of precipitation each year with 4.2 inches of snow.
| Stat | Seminole |
|---|---|
| Average Annual High | 72.7 |
| Average Annual Low | 49.7 |
| Annual Precipitation Days | 56.2 |
| Average Annual Precipitation | 41.8 |
| Average Annual Snowfall | 4.2 |
Average High
Days of Rain
Source: NOAA climate normals (30-year)
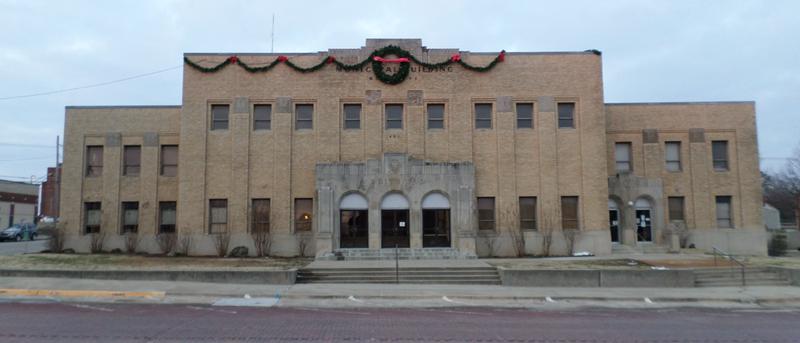
Seminole, OK Photos

3 Reviews & Comments About Seminole

Seminole is not that bad and i would know because i have family there that they say nothing ever happens and theres lots of jobs threre but i live in wynnewood and our town should be on this video
No way, i live in Seminole and actually pretty cool here
I'm from seminole plenty of work here I've never had a problem crime wise and if you don't mind fishing and lakes plenty to do plus casinos everywhere
Rankings & Articles For Seminole


Locations Around Seminole
Map Of Seminole, OK
Best Places Around Seminole
Moore, OK
Population 63,420
Norman, OK
Population 129,672
Choctaw, OK
Population 12,303
Harrah, OK
Population 6,684
Noble, OK
Population 7,493
Slaughterville, OK
Population 4,251
Purcell, OK
Population 6,803
McLoud, OK
Population 4,425
Ada, OK
Population 16,575
Henryetta, OK
Population 5,608
Seminole Demographics And Statistics
Population over time in Seminole
The current population in Seminole is 7,194. The population has decreased 1.9% from 2010.
| Year | Population | % Change |
|---|---|---|
| 2024 | 7,194 | 0.5% |
| 2023 | 7,161 | 0.2% |
| 2022 | 7,144 | 0.2% |
| 2021 | 7,131 | -0.3% |
| 2020 | 7,155 | -0.9% |
| 2019 | 7,219 | -1.5% |
| 2018 | 7,328 | -0.8% |
| 2017 | 7,384 | -1.2% |
| 2016 | 7,470 | -0.5% |
| 2015 | 7,508 | 0.2% |
| 2014 | 7,493 | 0.1% |
| 2013 | 7,485 | 0.6% |
| 2012 | 7,438 | 0.7% |
| 2011 | 7,388 | 0.7% |
| 2010 | 7,335 | - |
Race / Ethnicity in Seminole
See the full breakdown
Seminole is:
59.0% White with 4,247 White residents.
4.6% African American with 332 African American residents.
18.7% American Indian with 1,342 American Indian residents.
0.1% Asian with 10 Asian residents.
0.0% Hawaiian with 0 Hawaiian residents.
0.0% Other with 0 Other residents.
11.6% Two Or More with 833 Two Or More residents.
6.0% Hispanic with 430 Hispanic residents.
| Race | Seminole | OK | USA |
|---|---|---|---|
| White | 59.0% | 62.1% | 57.4% |
| African American | 4.6% | 6.8% | 11.9% |
| American Indian | 18.7% | 6.6% | 0.5% |
| Asian | 0.1% | 2.4% | 5.9% |
| Hawaiian | 0.0% | 0.2% | 0.2% |
| Other | 0.0% | 0.3% | 0.6% |
| Two Or More | 11.6% | 8.9% | 4.3% |
| Hispanic | 6.0% | 12.7% | 19.3% |
Gender in Seminole
See the full breakdown
Seminole is 53.7% female with 3,862 female residents.
Seminole is 46.3% male with 3,332 male residents.
| Gender | Seminole | OK | USA |
|---|---|---|---|
| Female | 53.7% | 50.2% | 50.5% |
| Male | 46.3% | 49.8% | 49.5% |
Highest level of educational attainment in Seminole for adults over 25
See the full breakdown
3.0% of adults in Seminole completed < 9th grade.
13.0% of adults in Seminole completed 9-12th grade.
34.0% of adults in Seminole completed high school / ged.
26.0% of adults in Seminole completed some college.
9.0% of adults in Seminole completed associate's degree.
11.0% of adults in Seminole completed bachelor's degree.
3.0% of adults in Seminole completed master's degree.
1.0% of adults in Seminole completed professional degree.
0.0% of adults in Seminole completed doctorate degree.
| Education | Seminole | OK | USA |
|---|---|---|---|
| < 9th Grade | 3.0% | 4.0% | 4.0% |
| 9-12th Grade | 13.0% | 7.0% | 6.0% |
| High School / GED | 34.0% | 31.0% | 26.0% |
| Some College | 26.0% | 22.0% | 19.0% |
| Associate's Degree | 9.0% | 8.0% | 9.0% |
| Bachelor's Degree | 11.0% | 18.0% | 22.0% |
| Master's Degree | 3.0% | 7.0% | 10.0% |
| Professional Degree | 1.0% | 2.0% | 2.0% |
| Doctorate Degree | 0.0% | 1.0% | 2.0% |
Household Income For Seminole, Oklahoma
See the full breakdown
6.0% of households in Seminole earn Less than $10,000.
7.9% of households in Seminole earn $10,000 to $14,999.
18.8% of households in Seminole earn $15,000 to $24,999.
12.1% of households in Seminole earn $25,000 to $34,999.
14.2% of households in Seminole earn $35,000 to $49,999.
18.6% of households in Seminole earn $50,000 to $74,999.
10.4% of households in Seminole earn $75,000 to $99,999.
8.1% of households in Seminole earn $100,000 to $149,999.
1.9% of households in Seminole earn $150,000 to $199,999.
1.9% of households in Seminole earn $200,000 or more.
| Income | Seminole | OK | USA |
|---|---|---|---|
| Less than $10,000 | 6.0% | 5.9% | 5.0% |
| $10,000 to $14,999 | 7.9% | 4.1% | 3.4% |
| $15,000 to $24,999 | 18.8% | 7.6% | 6.3% |
| $25,000 to $34,999 | 12.1% | 8.8% | 6.6% |
| $35,000 to $49,999 | 14.2% | 12.1% | 10.1% |
| $50,000 to $74,999 | 18.6% | 18.0% | 15.5% |
| $75,000 to $99,999 | 10.4% | 13.1% | 12.6% |
| $100,000 to $149,999 | 8.1% | 16.1% | 17.5% |
| $150,000 to $199,999 | 1.9% | 7.2% | 9.6% |
| $200,000 or more | 1.9% | 7.2% | 13.4% |
Source: U.S. Census ACS 5-year estimates (2024)


