Clarksdale SnackAbility
Overall SnackAbility
Cost of living in Clarksdale summary. We use data on the cost of living to determine how expensive it is to live in Clarksdale. Real estate prices drive most of the variance in cost of living around Mississippi. Key points include:
The cost of living in Clarksdale is 82 with 100 being average.
The cost of living in Clarksdale is 0.8x lower than the national average.
The median home value in Clarksdale is $42,685.
The median income in Clarksdale is $36,382.
Clarksdale's Overall Cost Of Living
Lower Than The National Average
Cost Of Living In Clarksdale Comparison Table
| Living Expense | Clarksdale | Mississippi | National Average |
|---|---|---|---|
| Overall | 82 | 88 | 100 |
| Services | 98 | 99 | 100 |
| Groceries | 95 | 97 | 100 |
| Health | 46 | 63 | 100 |
| Housing | 96 | 94 | 100 |
| Transportation | 99 | 97 | 100 |
| Utilities | 93 | 93 | 100 |
Source: Cost of living index, normalized to US average = 100
Clarksdale, MS Weather
The average high in Clarksdale is 72.6° and the average low is 52.0°.
There are 67.0 days of precipitation each year.
Expect an average of 53.4 inches of precipitation each year with 1.2 inches of snow.
| Stat | Clarksdale |
|---|---|
| Average Annual High | 72.6 |
| Average Annual Low | 52.0 |
| Annual Precipitation Days | 67.0 |
| Average Annual Precipitation | 53.4 |
| Average Annual Snowfall | 1.2 |
Average High
Days of Rain
Source: NOAA climate normals (30-year)
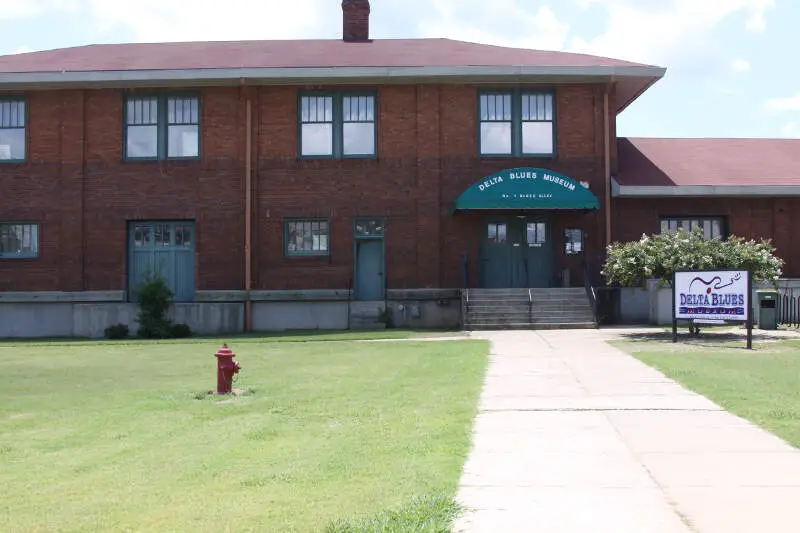
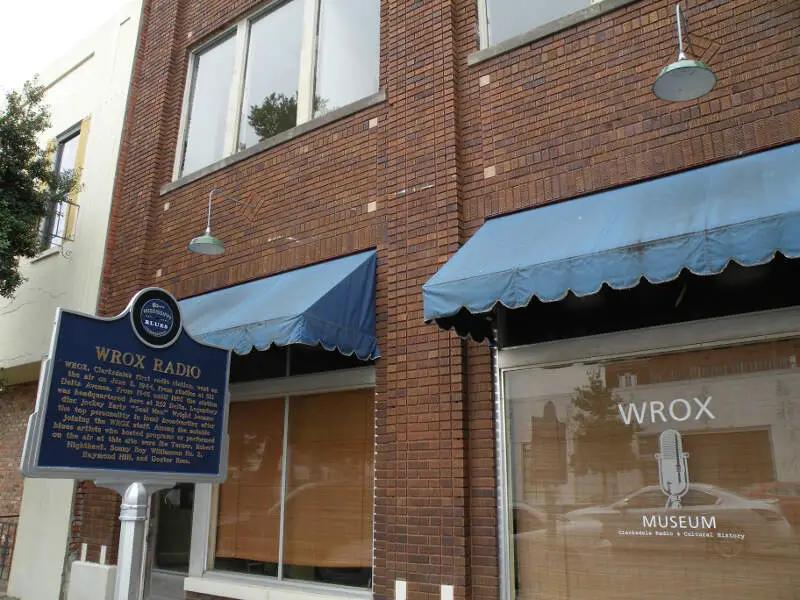
Clarksdale, MS Photos


Rankings & Articles For Clarksdale


Locations Around Clarksdale
Map Of Clarksdale, MS
Best Places Around Clarksdale
Cleveland, MS
Population 10,623
Batesville, MS
Population 7,387
Senatobia, MS
Population 8,380
Helena-West Helena, AR
Population 8,935
Clarksdale Demographics And Statistics
Population over time in Clarksdale
The current population in Clarksdale is 14,231. The population has decreased 22.1% from 2010.
| Year | Population | % Change |
|---|---|---|
| 2024 | 14,231 | -1.3% |
| 2023 | 14,423 | -2.3% |
| 2022 | 14,769 | -2.3% |
| 2021 | 15,124 | -1.4% |
| 2020 | 15,342 | -2.5% |
| 2019 | 15,734 | -2.7% |
| 2018 | 16,174 | -2.4% |
| 2017 | 16,579 | -2.4% |
| 2016 | 16,994 | -1.8% |
| 2015 | 17,314 | -1.0% |
| 2014 | 17,497 | -1.3% |
| 2013 | 17,725 | -1.0% |
| 2012 | 17,906 | -1.0% |
| 2011 | 18,092 | -1.0% |
| 2010 | 18,276 | - |
Race / Ethnicity in Clarksdale
See the full breakdown
Clarksdale is:
13.4% White with 1,908 White residents.
80.9% African American with 11,507 African American residents.
0.3% American Indian with 49 American Indian residents.
0.4% Asian with 53 Asian residents.
0.0% Hawaiian with 0 Hawaiian residents.
0.0% Other with 0 Other residents.
1.2% Two Or More with 174 Two Or More residents.
3.8% Hispanic with 540 Hispanic residents.
| Race | Clarksdale | MS | USA |
|---|---|---|---|
| White | 13.4% | 55.2% | 57.4% |
| African American | 80.9% | 36.3% | 11.9% |
| American Indian | 0.3% | 0.4% | 0.5% |
| Asian | 0.4% | 1.0% | 5.9% |
| Hawaiian | 0.0% | 0.0% | 0.2% |
| Other | 0.0% | 0.3% | 0.6% |
| Two Or More | 1.2% | 3.0% | 4.3% |
| Hispanic | 3.8% | 3.7% | 19.3% |
Gender in Clarksdale
See the full breakdown
Clarksdale is 53.3% female with 7,587 female residents.
Clarksdale is 46.7% male with 6,643 male residents.
| Gender | Clarksdale | MS | USA |
|---|---|---|---|
| Female | 53.3% | 51.5% | 50.5% |
| Male | 46.7% | 48.5% | 49.5% |
Highest level of educational attainment in Clarksdale for adults over 25
See the full breakdown
9.0% of adults in Clarksdale completed < 9th grade.
10.0% of adults in Clarksdale completed 9-12th grade.
25.0% of adults in Clarksdale completed high school / ged.
23.0% of adults in Clarksdale completed some college.
14.0% of adults in Clarksdale completed associate's degree.
11.0% of adults in Clarksdale completed bachelor's degree.
6.0% of adults in Clarksdale completed master's degree.
1.0% of adults in Clarksdale completed professional degree.
1.0% of adults in Clarksdale completed doctorate degree.
| Education | Clarksdale | MS | USA |
|---|---|---|---|
| < 9th Grade | 9.0% | 4.0% | 4.0% |
| 9-12th Grade | 10.0% | 9.0% | 6.0% |
| High School / GED | 25.0% | 30.0% | 26.0% |
| Some College | 23.0% | 21.0% | 19.0% |
| Associate's Degree | 14.0% | 11.0% | 9.0% |
| Bachelor's Degree | 11.0% | 15.0% | 22.0% |
| Master's Degree | 6.0% | 7.0% | 10.0% |
| Professional Degree | 1.0% | 2.0% | 2.0% |
| Doctorate Degree | 1.0% | 1.0% | 2.0% |
Household Income For Clarksdale, Mississippi
See the full breakdown
10.7% of households in Clarksdale earn Less than $10,000.
8.9% of households in Clarksdale earn $10,000 to $14,999.
15.7% of households in Clarksdale earn $15,000 to $24,999.
12.6% of households in Clarksdale earn $25,000 to $34,999.
18.2% of households in Clarksdale earn $35,000 to $49,999.
14.4% of households in Clarksdale earn $50,000 to $74,999.
8.8% of households in Clarksdale earn $75,000 to $99,999.
6.6% of households in Clarksdale earn $100,000 to $149,999.
1.8% of households in Clarksdale earn $150,000 to $199,999.
2.2% of households in Clarksdale earn $200,000 or more.
| Income | Clarksdale | MS | USA |
|---|---|---|---|
| Less than $10,000 | 10.7% | 7.1% | 5.0% |
| $10,000 to $14,999 | 8.9% | 6.0% | 3.4% |
| $15,000 to $24,999 | 15.7% | 10.0% | 6.3% |
| $25,000 to $34,999 | 12.6% | 9.3% | 6.6% |
| $35,000 to $49,999 | 18.2% | 12.7% | 10.1% |
| $50,000 to $74,999 | 14.4% | 16.5% | 15.5% |
| $75,000 to $99,999 | 8.8% | 12.0% | 12.6% |
| $100,000 to $149,999 | 6.6% | 14.4% | 17.5% |
| $150,000 to $199,999 | 1.8% | 6.2% | 9.6% |
| $200,000 or more | 2.2% | 5.8% | 13.4% |
Source: U.S. Census ACS 5-year estimates (2024)


