Philadelphia SnackAbility
Overall SnackAbility
Cost of living in Philadelphia summary. We use data on the cost of living to determine how expensive it is to live in Philadelphia. Real estate prices drive most of the variance in cost of living around Mississippi. Key points include:
The cost of living in Philadelphia is 82 with 100 being average.
The cost of living in Philadelphia is 0.8x lower than the national average.
The median home value in Philadelphia is $137,663.
The median income in Philadelphia is $50,788.
Philadelphia's Overall Cost Of Living
Lower Than The National Average
Cost Of Living In Philadelphia Comparison Table
| Living Expense | Philadelphia | Mississippi | National Average |
|---|---|---|---|
| Overall | 82 | 88 | 100 |
| Services | 99 | 99 | 100 |
| Groceries | 96 | 97 | 100 |
| Health | 57 | 63 | 100 |
| Housing | 98 | 94 | 100 |
| Transportation | 96 | 97 | 100 |
| Utilities | 89 | 93 | 100 |
Source: Cost of living index, normalized to US average = 100
Philadelphia, MS Weather
The average high in Philadelphia is 74.8° and the average low is 52.4°.
There are 77.9 days of precipitation each year.
Expect an average of 55.9 inches of precipitation each year with 0.8 inches of snow.
| Stat | Philadelphia |
|---|---|
| Average Annual High | 74.8 |
| Average Annual Low | 52.4 |
| Annual Precipitation Days | 77.9 |
| Average Annual Precipitation | 55.9 |
| Average Annual Snowfall | 0.8 |
Average High
Days of Rain
Source: NOAA climate normals (30-year)
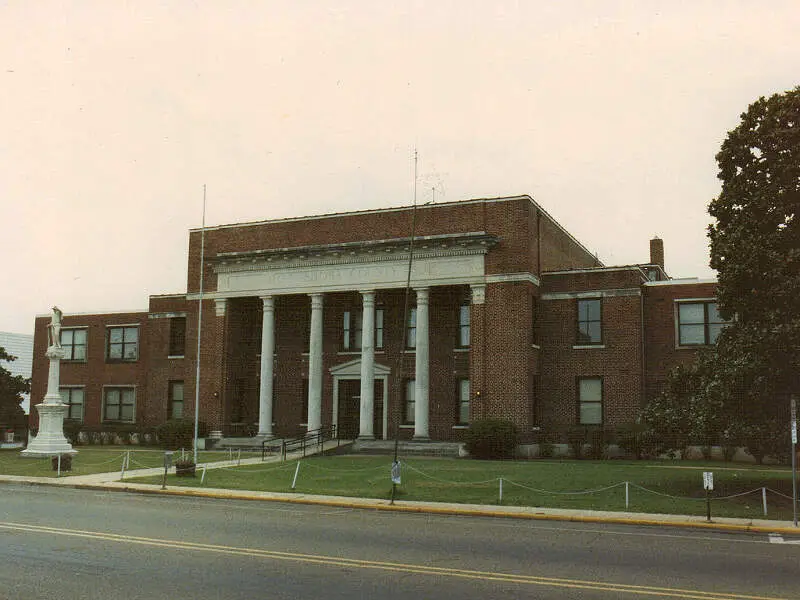
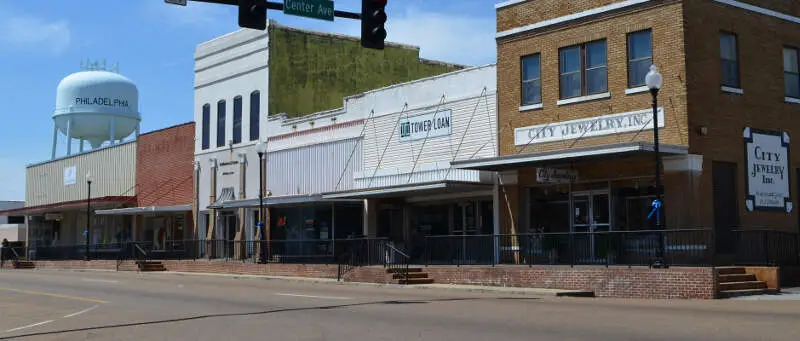
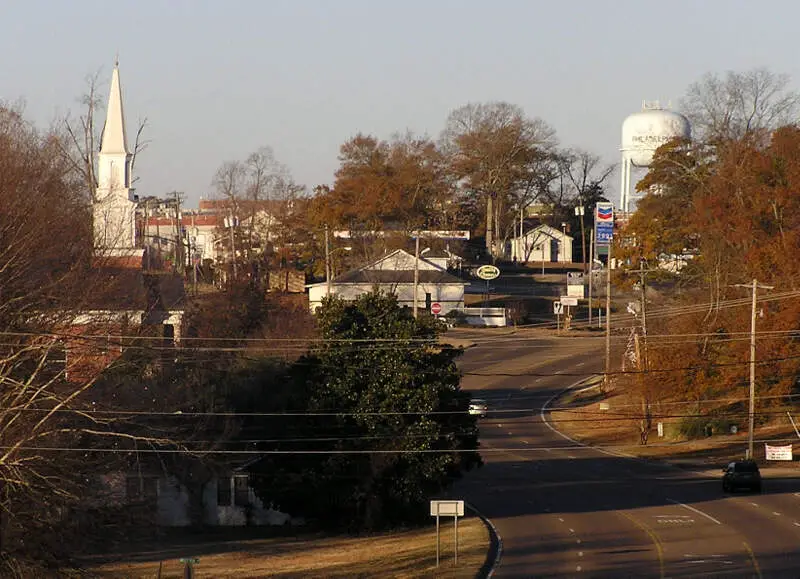
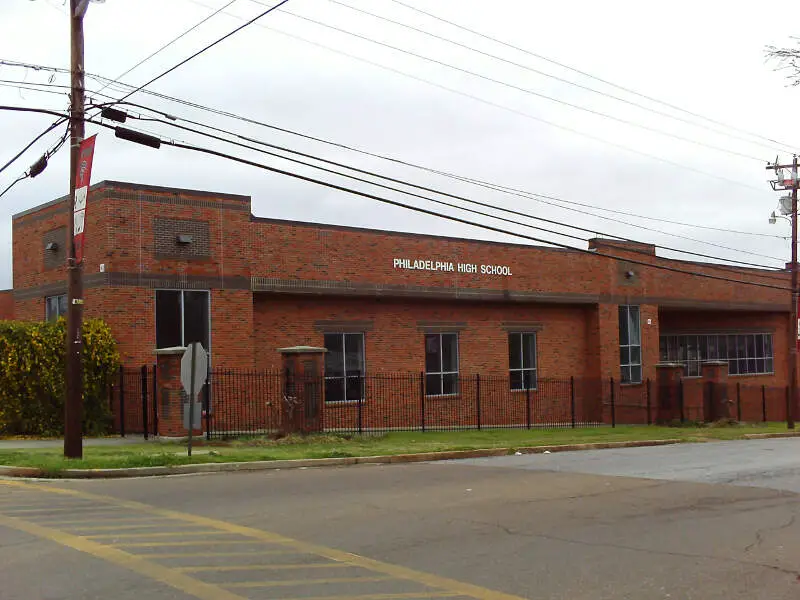
Philadelphia, MS Photos


2 Reviews & Comments About Philadelphia

As a Mississippian, I gotta say that some places are pretty bad, but not all of it is the hellhole as described. My hometown of Philadelphia was pretty racist and I almost got shived several times in elementary school though. Madison, however, is fairly nice as well as some of Rankin and a few other places. Just don't go around saying you're atheist or you might end up broken and b****y on the sidewalk.
I'm from Philadelphia Mississippi it's amazing down here. Best state in US
Rankings & Articles For Philadelphia


Locations Around Philadelphia
Map Of Philadelphia, MS
Best Places Around Philadelphia
Forest, MS
Population 5,357
Kosciusko, MS
Population 6,933
Louisville, MS
Population 5,983
Meridian, MS
Population 34,137
Carthage, MS
Population 4,866
Philadelphia Demographics And Statistics
Population over time in Philadelphia
The current population in Philadelphia is 6,996. The population has decreased 6.5% from 2010.
| Year | Population | % Change |
|---|---|---|
| 2024 | 6,996 | -0.5% |
| 2023 | 7,030 | -0.5% |
| 2022 | 7,065 | -0.6% |
| 2021 | 7,107 | -0.4% |
| 2020 | 7,137 | -1.1% |
| 2019 | 7,218 | -0.9% |
| 2018 | 7,284 | -0.7% |
| 2017 | 7,334 | -0.9% |
| 2016 | 7,399 | -0.5% |
| 2015 | 7,433 | -0.2% |
| 2014 | 7,446 | -0.5% |
| 2013 | 7,480 | -0.0% |
| 2012 | 7,483 | -0.2% |
| 2011 | 7,495 | 0.2% |
| 2010 | 7,482 | - |
Race / Ethnicity in Philadelphia
See the full breakdown
Philadelphia is:
42.3% White with 2,956 White residents.
51.6% African American with 3,610 African American residents.
1.0% American Indian with 70 American Indian residents.
0.4% Asian with 29 Asian residents.
0.0% Hawaiian with 0 Hawaiian residents.
0.0% Other with 0 Other residents.
4.0% Two Or More with 278 Two Or More residents.
0.8% Hispanic with 53 Hispanic residents.
| Race | Philadelphia | MS | USA |
|---|---|---|---|
| White | 42.3% | 55.2% | 57.4% |
| African American | 51.6% | 36.3% | 11.9% |
| American Indian | 1.0% | 0.4% | 0.5% |
| Asian | 0.4% | 1.0% | 5.9% |
| Hawaiian | 0.0% | 0.0% | 0.2% |
| Other | 0.0% | 0.3% | 0.6% |
| Two Or More | 4.0% | 3.0% | 4.3% |
| Hispanic | 0.8% | 3.7% | 19.3% |
Gender in Philadelphia
See the full breakdown
Philadelphia is 57.4% female with 4,017 female residents.
Philadelphia is 42.6% male with 2,979 male residents.
| Gender | Philadelphia | MS | USA |
|---|---|---|---|
| Female | 57.4% | 51.5% | 50.5% |
| Male | 42.6% | 48.5% | 49.5% |
Highest level of educational attainment in Philadelphia for adults over 25
See the full breakdown
2.0% of adults in Philadelphia completed < 9th grade.
13.0% of adults in Philadelphia completed 9-12th grade.
30.0% of adults in Philadelphia completed high school / ged.
19.0% of adults in Philadelphia completed some college.
10.0% of adults in Philadelphia completed associate's degree.
10.0% of adults in Philadelphia completed bachelor's degree.
13.0% of adults in Philadelphia completed master's degree.
1.0% of adults in Philadelphia completed professional degree.
2.0% of adults in Philadelphia completed doctorate degree.
| Education | Philadelphia | MS | USA |
|---|---|---|---|
| < 9th Grade | 2.0% | 4.0% | 4.0% |
| 9-12th Grade | 13.0% | 9.0% | 6.0% |
| High School / GED | 30.0% | 30.0% | 26.0% |
| Some College | 19.0% | 21.0% | 19.0% |
| Associate's Degree | 10.0% | 11.0% | 9.0% |
| Bachelor's Degree | 10.0% | 15.0% | 22.0% |
| Master's Degree | 13.0% | 7.0% | 10.0% |
| Professional Degree | 1.0% | 2.0% | 2.0% |
| Doctorate Degree | 2.0% | 1.0% | 2.0% |
Household Income For Philadelphia, Mississippi
See the full breakdown
12.0% of households in Philadelphia earn Less than $10,000.
6.9% of households in Philadelphia earn $10,000 to $14,999.
10.2% of households in Philadelphia earn $15,000 to $24,999.
11.3% of households in Philadelphia earn $25,000 to $34,999.
8.7% of households in Philadelphia earn $35,000 to $49,999.
16.5% of households in Philadelphia earn $50,000 to $74,999.
12.5% of households in Philadelphia earn $75,000 to $99,999.
14.6% of households in Philadelphia earn $100,000 to $149,999.
4.0% of households in Philadelphia earn $150,000 to $199,999.
3.1% of households in Philadelphia earn $200,000 or more.
| Income | Philadelphia | MS | USA |
|---|---|---|---|
| Less than $10,000 | 12.0% | 7.1% | 5.0% |
| $10,000 to $14,999 | 6.9% | 6.0% | 3.4% |
| $15,000 to $24,999 | 10.2% | 10.0% | 6.3% |
| $25,000 to $34,999 | 11.3% | 9.3% | 6.6% |
| $35,000 to $49,999 | 8.7% | 12.7% | 10.1% |
| $50,000 to $74,999 | 16.5% | 16.5% | 15.5% |
| $75,000 to $99,999 | 12.5% | 12.0% | 12.6% |
| $100,000 to $149,999 | 14.6% | 14.4% | 17.5% |
| $150,000 to $199,999 | 4.0% | 6.2% | 9.6% |
| $200,000 or more | 3.1% | 5.8% | 13.4% |
Source: U.S. Census ACS 5-year estimates (2024)


