Brevard SnackAbility
Overall SnackAbility
Crime in Brevard summary. We use data from the FBI to determine the crime rates in Brevard. Key points include:
There were 152 total crimes in Brevard in the last reporting year.
The overall crime rate per 100,000 people in Brevard is 1,936.8 / 100k people.
The violent crime rate per 100,000 people in Brevard is 267.6 / 100k people.
The property crime rate per 100,000 people in Brevard is 1,669.2 / 100k people.
Overall, crime in Brevard is -8.61% below the national average.
Total Crimes
Below National Average
Crime In Brevard Comparison Table
| Statistic | Count Raw |
Brevard / 100k People |
North Carolina / 100k People |
National / 100k People |
|---|---|---|---|---|
| Total Crimes Per 100K | 152 | 1,936.8 | 2,343.9 | 2,119.2 |
| Violent Crime | 21 | 267.6 | 375.8 | 359.0 |
| Murder | 0 | 0.0 | 7.5 | 5.0 |
| Robbery | 0 | 0.0 | 50.2 | 61.0 |
| Aggravated Assault | 13 | 165.6 | 290.1 | 256.0 |
| Property Crime | 131 | 1,669.2 | 1,968.1 | 1,760.0 |
| Burglary | 23 | 293.1 | 323.9 | 229.0 |
| Larceny | 106 | 1,350.7 | 1,390.2 | 1,272.0 |
| Car Theft | 2 | 25.5 | 254.1 | 259.0 |
Source: FBI Uniform Crime Reporting (2024)
Cost of living in Brevard summary. We use data on the cost of living to determine how expensive it is to live in Brevard. Real estate prices drive most of the variance in cost of living around North Carolina. Key points include:
The cost of living in Brevard is 102 with 100 being average.
The cost of living in Brevard is 1.0x higher than the national average.
The median home value in Brevard is $464,517.
The median income in Brevard is $54,103.
Brevard's Overall Cost Of Living
Higher Than The National Average
Cost Of Living In Brevard Comparison Table
| Living Expense | Brevard | North Carolina | National Average |
|---|---|---|---|
| Overall | 102 | 95 | 100 |
| Services | 100 | 98 | 100 |
| Groceries | 101 | 98 | 100 |
| Health | 111 | 89 | 100 |
| Housing | 100 | 100 | 100 |
| Transportation | 95 | 97 | 100 |
| Utilities | 104 | 101 | 100 |
Source: Cost of living index, normalized to US average = 100
Brevard, NC Weather
The average high in Brevard is 67.0° and the average low is 43.3°.
There are 95.0 days of precipitation each year.
Expect an average of 61.7 inches of precipitation each year with 7.7 inches of snow.
| Stat | Brevard |
|---|---|
| Average Annual High | 67.0 |
| Average Annual Low | 43.3 |
| Annual Precipitation Days | 95.0 |
| Average Annual Precipitation | 61.7 |
| Average Annual Snowfall | 7.7 |
Average High
Days of Rain
Source: NOAA climate normals (30-year)
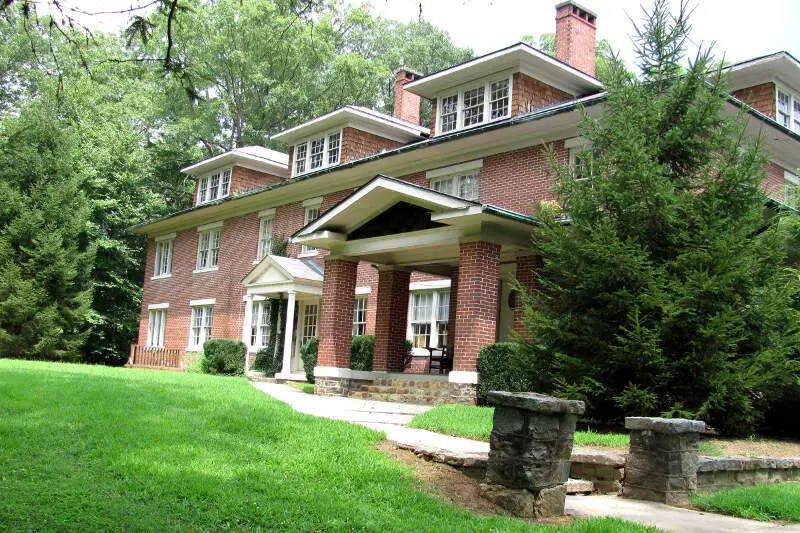
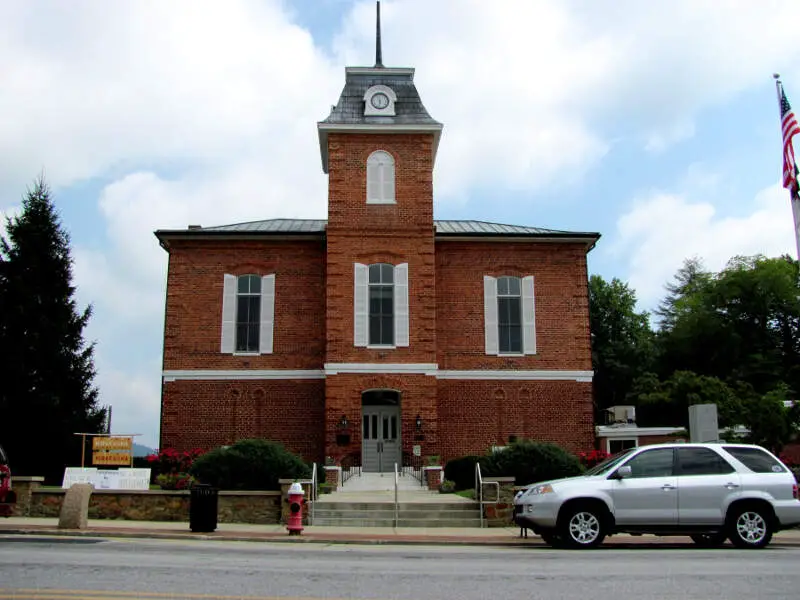
Brevard, NC Photos

Rankings & Articles For Brevard


Locations Around Brevard
Map Of Brevard, NC
Best Places Around Brevard
Asheville, NC
Population 94,535
Black Mountain, NC
Population 8,513
Mills River, NC
Population 7,281
Fletcher, NC
Population 8,098
Etowah, NC
Population 7,968
Hendersonville, NC
Population 15,408
Five Forks, SC
Population 18,656
Woodfin, NC
Population 8,048
Mauldin, SC
Population 27,055
Centerville, SC
Population 7,049
Brevard Demographics And Statistics
Population over time in Brevard
The current population in Brevard is 7,897. The population has increased 5.4% from 2010.
| Year | Population | % Change |
|---|---|---|
| 2024 | 7,897 | 1.3% |
| 2023 | 7,795 | 0.2% |
| 2022 | 7,777 | 0.8% |
| 2021 | 7,712 | -1.6% |
| 2020 | 7,841 | 0.2% |
| 2019 | 7,824 | 0.5% |
| 2018 | 7,785 | 0.3% |
| 2017 | 7,759 | 0.6% |
| 2016 | 7,710 | 0.7% |
| 2015 | 7,656 | 0.1% |
| 2014 | 7,651 | 0.3% |
| 2013 | 7,629 | 0.8% |
| 2012 | 7,566 | 0.4% |
| 2011 | 7,534 | 0.6% |
| 2010 | 7,489 | - |
Race / Ethnicity in Brevard
See the full breakdown
Brevard is:
80.7% White with 6,376 White residents.
10.3% African American with 813 African American residents.
0.4% American Indian with 35 American Indian residents.
0.3% Asian with 24 Asian residents.
0.0% Hawaiian with 0 Hawaiian residents.
0.4% Other with 29 Other residents.
4.0% Two Or More with 317 Two Or More residents.
3.8% Hispanic with 303 Hispanic residents.
| Race | Brevard | NC | USA |
|---|---|---|---|
| White | 80.7% | 60.0% | 57.4% |
| African American | 10.3% | 20.0% | 11.9% |
| American Indian | 0.4% | 0.8% | 0.5% |
| Asian | 0.3% | 3.3% | 5.9% |
| Hawaiian | 0.0% | 0.1% | 0.2% |
| Other | 0.4% | 0.5% | 0.6% |
| Two Or More | 4.0% | 4.1% | 4.3% |
| Hispanic | 3.8% | 11.3% | 19.3% |
Gender in Brevard
See the full breakdown
Brevard is 57.7% female with 4,560 female residents.
Brevard is 42.3% male with 3,337 male residents.
| Gender | Brevard | NC | USA |
|---|---|---|---|
| Female | 57.7% | 51.1% | 50.5% |
| Male | 42.3% | 48.9% | 49.5% |
Highest level of educational attainment in Brevard for adults over 25
See the full breakdown
2.0% of adults in Brevard completed < 9th grade.
4.0% of adults in Brevard completed 9-12th grade.
20.0% of adults in Brevard completed high school / ged.
23.0% of adults in Brevard completed some college.
8.0% of adults in Brevard completed associate's degree.
28.0% of adults in Brevard completed bachelor's degree.
12.0% of adults in Brevard completed master's degree.
2.0% of adults in Brevard completed professional degree.
1.0% of adults in Brevard completed doctorate degree.
| Education | Brevard | NC | USA |
|---|---|---|---|
| < 9th Grade | 2.0% | 3.0% | 4.0% |
| 9-12th Grade | 4.0% | 6.0% | 6.0% |
| High School / GED | 20.0% | 25.0% | 26.0% |
| Some College | 23.0% | 20.0% | 19.0% |
| Associate's Degree | 8.0% | 10.0% | 9.0% |
| Bachelor's Degree | 28.0% | 22.0% | 22.0% |
| Master's Degree | 12.0% | 10.0% | 10.0% |
| Professional Degree | 2.0% | 2.0% | 2.0% |
| Doctorate Degree | 1.0% | 2.0% | 2.0% |
Household Income For Brevard, North Carolina
See the full breakdown
5.0% of households in Brevard earn Less than $10,000.
8.8% of households in Brevard earn $10,000 to $14,999.
9.1% of households in Brevard earn $15,000 to $24,999.
11.6% of households in Brevard earn $25,000 to $34,999.
14.4% of households in Brevard earn $35,000 to $49,999.
16.5% of households in Brevard earn $50,000 to $74,999.
12.5% of households in Brevard earn $75,000 to $99,999.
9.3% of households in Brevard earn $100,000 to $149,999.
7.9% of households in Brevard earn $150,000 to $199,999.
4.9% of households in Brevard earn $200,000 or more.
| Income | Brevard | NC | USA |
|---|---|---|---|
| Less than $10,000 | 5.0% | 5.0% | 5.0% |
| $10,000 to $14,999 | 8.8% | 3.7% | 3.4% |
| $15,000 to $24,999 | 9.1% | 7.1% | 6.3% |
| $25,000 to $34,999 | 11.6% | 7.4% | 6.6% |
| $35,000 to $49,999 | 14.4% | 11.7% | 10.1% |
| $50,000 to $74,999 | 16.5% | 16.8% | 15.5% |
| $75,000 to $99,999 | 12.5% | 13.0% | 12.6% |
| $100,000 to $149,999 | 9.3% | 16.6% | 17.5% |
| $150,000 to $199,999 | 7.9% | 8.3% | 9.6% |
| $200,000 or more | 4.9% | 10.4% | 13.4% |
Source: U.S. Census ACS 5-year estimates (2024)


