Carolina Beach SnackAbility
Overall SnackAbility
Crime in Carolina Beach summary. We use data from the FBI to determine the crime rates in Carolina Beach. Key points include:
There were 151 total crimes in Carolina Beach in the last reporting year.
The overall crime rate per 100,000 people in Carolina Beach is 2,183.0 / 100k people.
The violent crime rate per 100,000 people in Carolina Beach is 332.5 / 100k people.
The property crime rate per 100,000 people in Carolina Beach is 1,850.5 / 100k people.
Overall, crime in Carolina Beach is 3.01% above the national average.
Total Crimes
Above National Average
Crime In Carolina Beach Comparison Table
| Statistic | Count Raw |
Carolina Beach / 100k People |
North Carolina / 100k People |
National / 100k People |
|---|---|---|---|---|
| Total Crimes Per 100K | 151 | 2,183.0 | 2,343.9 | 2,119.2 |
| Violent Crime | 23 | 332.5 | 375.8 | 359.0 |
| Murder | 1 | 14.5 | 7.5 | 5.0 |
| Robbery | 1 | 14.5 | 50.2 | 61.0 |
| Aggravated Assault | 16 | 231.3 | 290.1 | 256.0 |
| Property Crime | 128 | 1,850.5 | 1,968.1 | 1,760.0 |
| Burglary | 15 | 216.9 | 323.9 | 229.0 |
| Larceny | 104 | 1,503.5 | 1,390.2 | 1,272.0 |
| Car Theft | 9 | 130.1 | 254.1 | 259.0 |
Source: FBI Uniform Crime Reporting (2024)
Cost of living in Carolina Beach summary. We use data on the cost of living to determine how expensive it is to live in Carolina Beach. Real estate prices drive most of the variance in cost of living around North Carolina. Key points include:
The cost of living in Carolina Beach is 122 with 100 being average.
The cost of living in Carolina Beach is 1.2x higher than the national average.
The median home value in Carolina Beach is $606,035.
The median income in Carolina Beach is $94,398.
Carolina Beach's Overall Cost Of Living
Higher Than The National Average
Cost Of Living In Carolina Beach Comparison Table
| Living Expense | Carolina Beach | North Carolina | National Average |
|---|---|---|---|
| Overall | 122 | 95 | 100 |
| Services | 97 | 98 | 100 |
| Groceries | 99 | 98 | 100 |
| Health | 174 | 89 | 100 |
| Housing | 99 | 100 | 100 |
| Transportation | 101 | 97 | 100 |
| Utilities | 99 | 101 | 100 |
Source: Cost of living index, normalized to US average = 100
Carolina Beach, NC Weather
The average high in Carolina Beach is 72.3° and the average low is 54.3°.
There are 80.1 days of precipitation each year.
Expect an average of 56.9 inches of precipitation each year with 0.8 inches of snow.
| Stat | Carolina Beach |
|---|---|
| Average Annual High | 72.3 |
| Average Annual Low | 54.3 |
| Annual Precipitation Days | 80.1 |
| Average Annual Precipitation | 56.9 |
| Average Annual Snowfall | 0.8 |
Average High
Days of Rain
Source: NOAA climate normals (30-year)
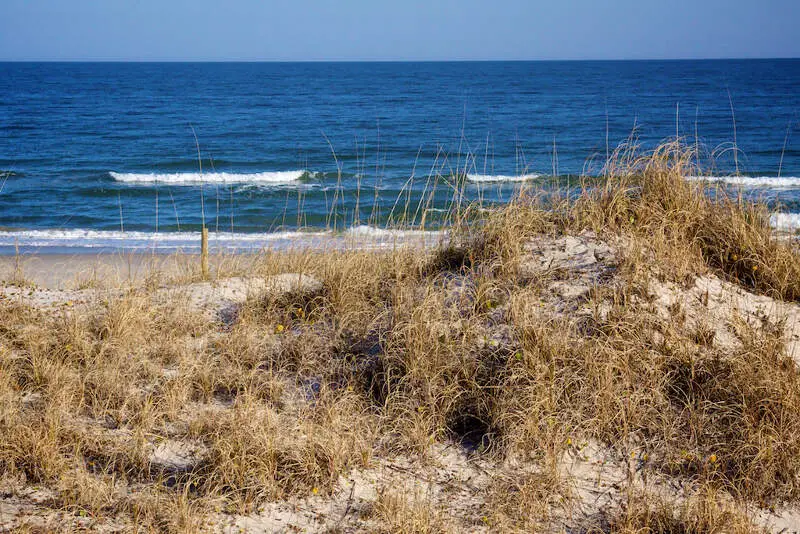
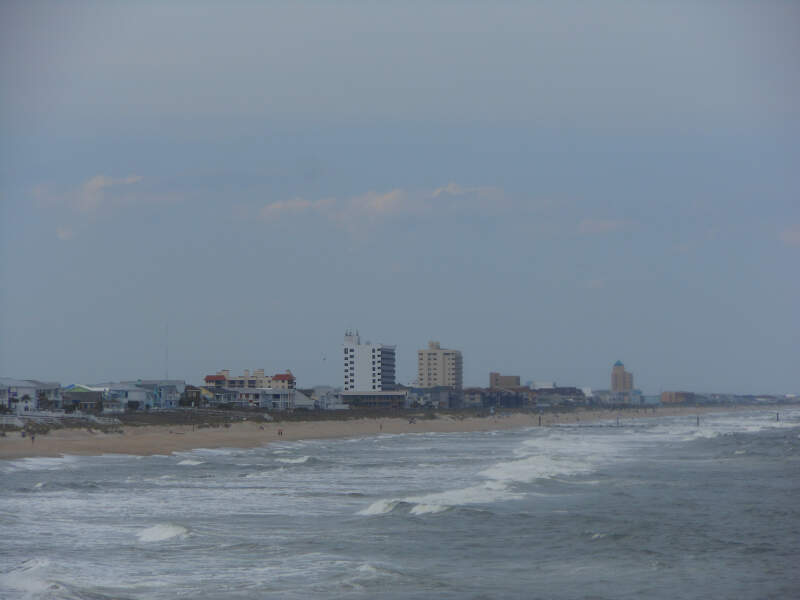
Carolina Beach, NC Photos


Rankings & Articles For Carolina Beach


Locations Around Carolina Beach
Map Of Carolina Beach, NC
Best Places Around Carolina Beach
Ogden, NC
Population 8,249
Myrtle Grove, NC
Population 12,637
Porters Neck, NC
Population 7,654
Murraysville, NC
Population 16,339
Silver Lake, NC
Population 6,563
Kings Grant, NC
Population 9,003
Wilmington, NC
Population 120,805
Boiling Spring Lakes, NC
Population 6,347
Leland, NC
Population 29,607
Carolina Beach Demographics And Statistics
Population over time in Carolina Beach
The current population in Carolina Beach is 6,745. The population has increased 19.1% from 2010.
| Year | Population | % Change |
|---|---|---|
| 2024 | 6,745 | 1.2% |
| 2023 | 6,665 | 1.2% |
| 2022 | 6,583 | 2.0% |
| 2021 | 6,456 | 2.1% |
| 2020 | 6,324 | 0.9% |
| 2019 | 6,265 | 1.1% |
| 2018 | 6,194 | 1.3% |
| 2017 | 6,116 | 1.1% |
| 2016 | 6,048 | 1.3% |
| 2015 | 5,970 | 1.4% |
| 2014 | 5,888 | 1.2% |
| 2013 | 5,817 | 1.1% |
| 2012 | 5,755 | 1.0% |
| 2011 | 5,697 | 0.6% |
| 2010 | 5,665 | - |
Race / Ethnicity in Carolina Beach
See the full breakdown
Carolina Beach is:
87.5% White with 5,902 White residents.
0.0% African American with 0 African American residents.
0.1% American Indian with 6 American Indian residents.
1.2% Asian with 78 Asian residents.
0.0% Hawaiian with 0 Hawaiian residents.
0.6% Other with 41 Other residents.
4.2% Two Or More with 284 Two Or More residents.
6.4% Hispanic with 434 Hispanic residents.
| Race | Carolina Beach | NC | USA |
|---|---|---|---|
| White | 87.5% | 60.0% | 57.4% |
| African American | 0.0% | 20.0% | 11.9% |
| American Indian | 0.1% | 0.8% | 0.5% |
| Asian | 1.2% | 3.3% | 5.9% |
| Hawaiian | 0.0% | 0.1% | 0.2% |
| Other | 0.6% | 0.5% | 0.6% |
| Two Or More | 4.2% | 4.1% | 4.3% |
| Hispanic | 6.4% | 11.3% | 19.3% |
Gender in Carolina Beach
See the full breakdown
Carolina Beach is 49.5% female with 3,336 female residents.
Carolina Beach is 50.5% male with 3,408 male residents.
| Gender | Carolina Beach | NC | USA |
|---|---|---|---|
| Female | 49.5% | 51.1% | 50.5% |
| Male | 50.5% | 48.9% | 49.5% |
Highest level of educational attainment in Carolina Beach for adults over 25
See the full breakdown
0.0% of adults in Carolina Beach completed < 9th grade.
1.0% of adults in Carolina Beach completed 9-12th grade.
22.0% of adults in Carolina Beach completed high school / ged.
17.0% of adults in Carolina Beach completed some college.
9.0% of adults in Carolina Beach completed associate's degree.
35.0% of adults in Carolina Beach completed bachelor's degree.
12.0% of adults in Carolina Beach completed master's degree.
2.0% of adults in Carolina Beach completed professional degree.
2.0% of adults in Carolina Beach completed doctorate degree.
| Education | Carolina Beach | NC | USA |
|---|---|---|---|
| < 9th Grade | 0.0% | 3.0% | 4.0% |
| 9-12th Grade | 1.0% | 6.0% | 6.0% |
| High School / GED | 22.0% | 25.0% | 26.0% |
| Some College | 17.0% | 20.0% | 19.0% |
| Associate's Degree | 9.0% | 10.0% | 9.0% |
| Bachelor's Degree | 35.0% | 22.0% | 22.0% |
| Master's Degree | 12.0% | 10.0% | 10.0% |
| Professional Degree | 2.0% | 2.0% | 2.0% |
| Doctorate Degree | 2.0% | 2.0% | 2.0% |
Household Income For Carolina Beach, North Carolina
See the full breakdown
3.3% of households in Carolina Beach earn Less than $10,000.
0.0% of households in Carolina Beach earn $10,000 to $14,999.
9.0% of households in Carolina Beach earn $15,000 to $24,999.
5.9% of households in Carolina Beach earn $25,000 to $34,999.
9.3% of households in Carolina Beach earn $35,000 to $49,999.
16.6% of households in Carolina Beach earn $50,000 to $74,999.
9.1% of households in Carolina Beach earn $75,000 to $99,999.
15.5% of households in Carolina Beach earn $100,000 to $149,999.
8.3% of households in Carolina Beach earn $150,000 to $199,999.
23.0% of households in Carolina Beach earn $200,000 or more.
| Income | Carolina Beach | NC | USA |
|---|---|---|---|
| Less than $10,000 | 3.3% | 5.0% | 5.0% |
| $10,000 to $14,999 | 0.0% | 3.7% | 3.4% |
| $15,000 to $24,999 | 9.0% | 7.1% | 6.3% |
| $25,000 to $34,999 | 5.9% | 7.4% | 6.6% |
| $35,000 to $49,999 | 9.3% | 11.7% | 10.1% |
| $50,000 to $74,999 | 16.6% | 16.8% | 15.5% |
| $75,000 to $99,999 | 9.1% | 13.0% | 12.6% |
| $100,000 to $149,999 | 15.5% | 16.6% | 17.5% |
| $150,000 to $199,999 | 8.3% | 8.3% | 9.6% |
| $200,000 or more | 23.0% | 10.4% | 13.4% |
Source: U.S. Census ACS 5-year estimates (2024)


