Wilmington SnackAbility
Overall SnackAbility
Crime in Wilmington summary. We use data from the FBI to determine the crime rates in Wilmington. Key points include:
There were 5,001 total crimes in Wilmington in the last reporting year.
The overall crime rate per 100,000 people in Wilmington is 3,997.6 / 100k people.
The violent crime rate per 100,000 people in Wilmington is 482.8 / 100k people.
The property crime rate per 100,000 people in Wilmington is 3,514.8 / 100k people.
Overall, crime in Wilmington is 88.63% above the national average.
Total Crimes
Above National Average
Crime In Wilmington Comparison Table
| Statistic | Count Raw |
Wilmington / 100k People |
North Carolina / 100k People |
National / 100k People |
|---|---|---|---|---|
| Total Crimes Per 100K | 5,001 | 3,997.6 | 2,343.9 | 2,119.2 |
| Violent Crime | 604 | 482.8 | 375.8 | 359.0 |
| Murder | 7 | 5.6 | 7.5 | 5.0 |
| Robbery | 91 | 72.7 | 50.2 | 61.0 |
| Aggravated Assault | 449 | 358.9 | 290.1 | 256.0 |
| Property Crime | 4,397 | 3,514.8 | 1,968.1 | 1,760.0 |
| Burglary | 452 | 361.3 | 323.9 | 229.0 |
| Larceny | 3,555 | 2,841.7 | 1,390.2 | 1,272.0 |
| Car Theft | 390 | 311.7 | 254.1 | 259.0 |
Source: FBI Uniform Crime Reporting (2024)
Cost of living in Wilmington summary. We use data on the cost of living to determine how expensive it is to live in Wilmington. Real estate prices drive most of the variance in cost of living around North Carolina. Key points include:
The cost of living in Wilmington is 108 with 100 being average.
The cost of living in Wilmington is 1.1x higher than the national average.
The median home value in Wilmington is $416,159.
The median income in Wilmington is $66,738.
Wilmington's Overall Cost Of Living
Higher Than The National Average
Cost Of Living In Wilmington Comparison Table
| Living Expense | Wilmington | North Carolina | National Average |
|---|---|---|---|
| Overall | 108 | 95 | 100 |
| Services | 99 | 98 | 100 |
| Groceries | 98 | 98 | 100 |
| Health | 135 | 89 | 100 |
| Housing | 98 | 100 | 100 |
| Transportation | 101 | 97 | 100 |
| Utilities | 99 | 101 | 100 |
Source: Cost of living index, normalized to US average = 100
Wilmington, NC Weather
The average high in Wilmington is 73.4° and the average low is 52.5°.
There are 77.4 days of precipitation each year.
Expect an average of 57.1 inches of precipitation each year with 1.1 inches of snow.
| Stat | Wilmington |
|---|---|
| Average Annual High | 73.4 |
| Average Annual Low | 52.5 |
| Annual Precipitation Days | 77.4 |
| Average Annual Precipitation | 57.1 |
| Average Annual Snowfall | 1.1 |
Average High
Days of Rain
Source: NOAA climate normals (30-year)
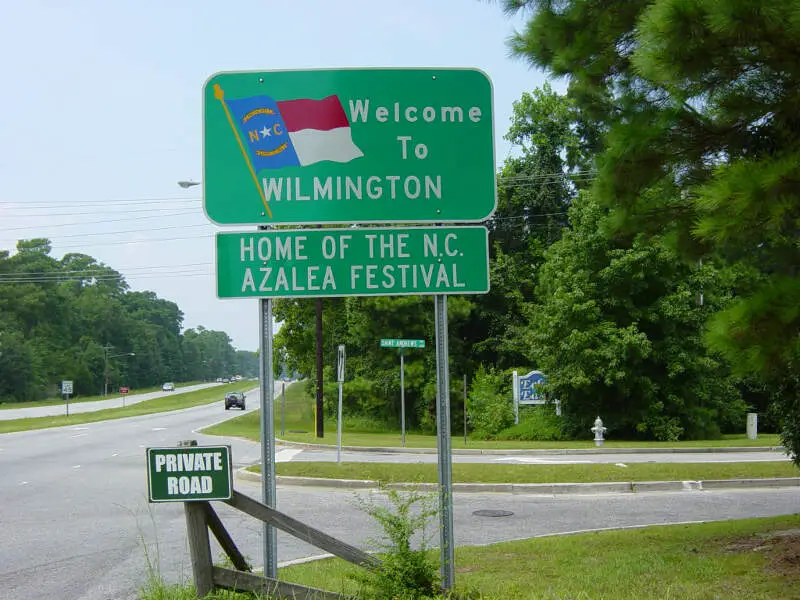
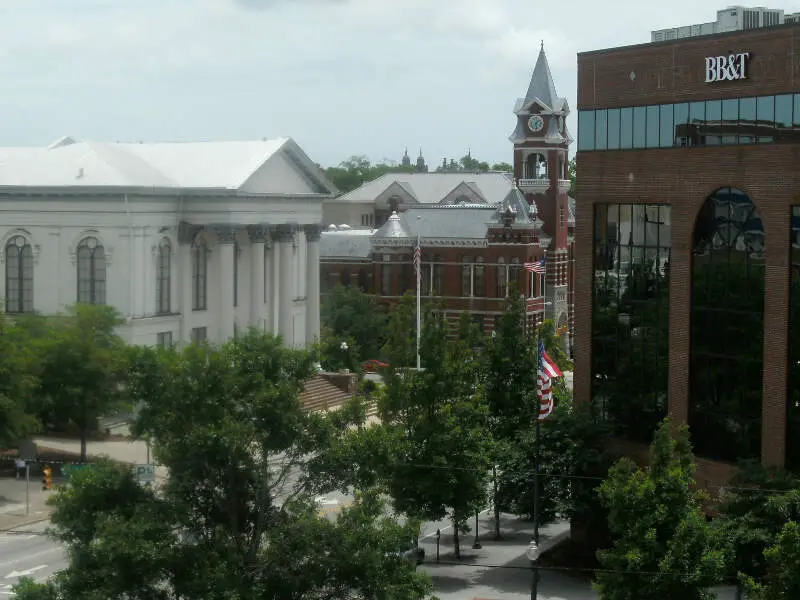
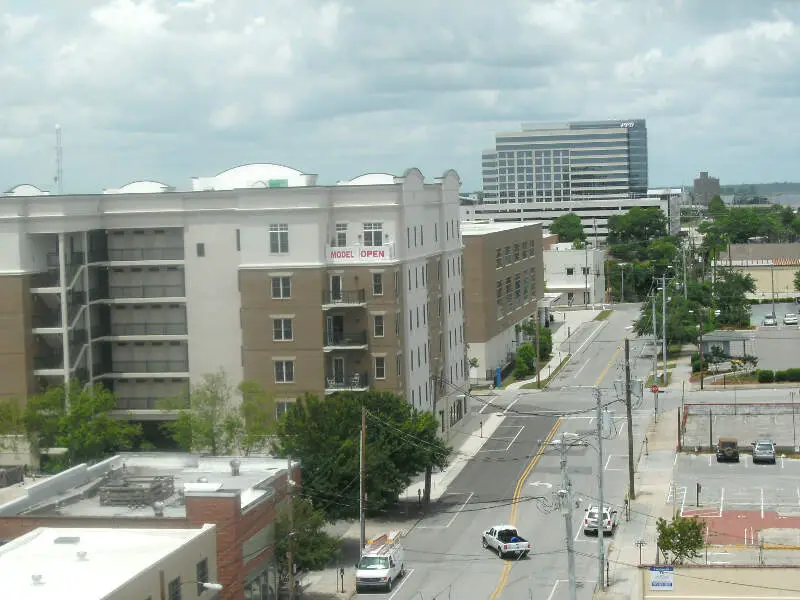
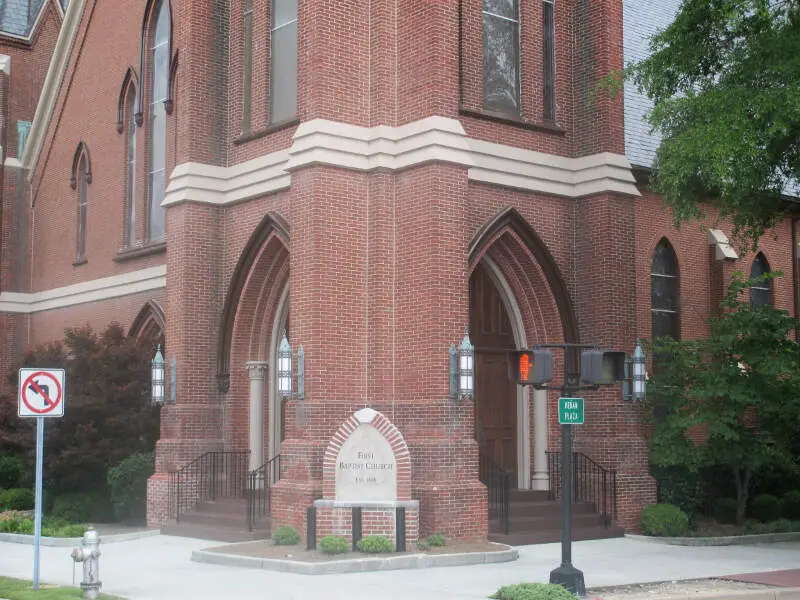
Wilmington, NC Photos


3 Reviews & Comments About Wilmington

I was born in Wilmington NC and I've lived in the Appalachian mountains now for about a year. Honestly I miss Wilmington LMAO we had a good mixture of everything on the coast lol
Wilmington is a beautiful place with lots to do. There is the river and boardwalk with restaurants and shopping. The beaches are wonderful. So many beautiful parks
My favorite thing was to take the free ferry across to Southport. Also the beaches are spotless they have strict rules on trash and so it's so beautiful and clean.
It is a small city but it is very nice to live there, its people are friendly, it has beaches, and beautiful places to visit.
my favorite places, museums for adults and children, water park, parks for children, beaches, and many more attractions.
Rankings & Articles For Wilmington


Locations Around Wilmington
Map Of Wilmington, NC
Best Places Around Wilmington
Ogden, NC
Population 8,249
Myrtle Grove, NC
Population 12,637
Porters Neck, NC
Population 7,654
Murraysville, NC
Population 16,339
Silver Lake, NC
Population 6,563
Carolina Beach, NC
Population 6,745
Kings Grant, NC
Population 9,003
Boiling Spring Lakes, NC
Population 6,347
Leland, NC
Population 29,607
Wilmington Demographics And Statistics
Population over time in Wilmington
The current population in Wilmington is 120,805. The population has increased 15.3% from 2010.
| Year | Population | % Change |
|---|---|---|
| 2024 | 120,805 | 1.9% |
| 2023 | 118,578 | 1.4% |
| 2022 | 116,933 | 0.8% |
| 2021 | 115,976 | -5.1% |
| 2020 | 122,162 | 1.6% |
| 2019 | 120,194 | 1.8% |
| 2018 | 118,094 | 2.5% |
| 2017 | 115,261 | 1.4% |
| 2016 | 113,724 | 1.5% |
| 2015 | 111,998 | 1.7% |
| 2014 | 110,100 | 1.4% |
| 2013 | 108,530 | 1.3% |
| 2012 | 107,116 | 1.1% |
| 2011 | 105,900 | 1.1% |
| 2010 | 104,730 | - |
Race / Ethnicity in Wilmington
See the full breakdown
Wilmington is:
69.9% White with 84,455 White residents.
14.4% African American with 17,422 African American residents.
0.2% American Indian with 192 American Indian residents.
1.3% Asian with 1,561 Asian residents.
0.0% Hawaiian with 42 Hawaiian residents.
0.8% Other with 959 Other residents.
4.6% Two Or More with 5,562 Two Or More residents.
8.8% Hispanic with 10,612 Hispanic residents.
| Race | Wilmington | NC | USA |
|---|---|---|---|
| White | 69.9% | 60.0% | 57.4% |
| African American | 14.4% | 20.0% | 11.9% |
| American Indian | 0.2% | 0.8% | 0.5% |
| Asian | 1.3% | 3.3% | 5.9% |
| Hawaiian | 0.0% | 0.1% | 0.2% |
| Other | 0.8% | 0.5% | 0.6% |
| Two Or More | 4.6% | 4.1% | 4.3% |
| Hispanic | 8.8% | 11.3% | 19.3% |
Gender in Wilmington
See the full breakdown
Wilmington is 53.4% female with 64,489 female residents.
Wilmington is 46.6% male with 56,316 male residents.
| Gender | Wilmington | NC | USA |
|---|---|---|---|
| Female | 53.4% | 51.1% | 50.5% |
| Male | 46.6% | 48.9% | 49.5% |
Highest level of educational attainment in Wilmington for adults over 25
See the full breakdown
3.0% of adults in Wilmington completed < 9th grade.
4.0% of adults in Wilmington completed 9-12th grade.
19.0% of adults in Wilmington completed high school / ged.
18.0% of adults in Wilmington completed some college.
10.0% of adults in Wilmington completed associate's degree.
30.0% of adults in Wilmington completed bachelor's degree.
11.0% of adults in Wilmington completed master's degree.
3.0% of adults in Wilmington completed professional degree.
2.0% of adults in Wilmington completed doctorate degree.
| Education | Wilmington | NC | USA |
|---|---|---|---|
| < 9th Grade | 3.0% | 3.0% | 4.0% |
| 9-12th Grade | 4.0% | 6.0% | 6.0% |
| High School / GED | 19.0% | 25.0% | 26.0% |
| Some College | 18.0% | 20.0% | 19.0% |
| Associate's Degree | 10.0% | 10.0% | 9.0% |
| Bachelor's Degree | 30.0% | 22.0% | 22.0% |
| Master's Degree | 11.0% | 10.0% | 10.0% |
| Professional Degree | 3.0% | 2.0% | 2.0% |
| Doctorate Degree | 2.0% | 2.0% | 2.0% |
Household Income For Wilmington, North Carolina
See the full breakdown
5.9% of households in Wilmington earn Less than $10,000.
3.5% of households in Wilmington earn $10,000 to $14,999.
8.1% of households in Wilmington earn $15,000 to $24,999.
8.0% of households in Wilmington earn $25,000 to $34,999.
12.6% of households in Wilmington earn $35,000 to $49,999.
17.1% of households in Wilmington earn $50,000 to $74,999.
12.2% of households in Wilmington earn $75,000 to $99,999.
14.9% of households in Wilmington earn $100,000 to $149,999.
7.0% of households in Wilmington earn $150,000 to $199,999.
10.8% of households in Wilmington earn $200,000 or more.
| Income | Wilmington | NC | USA |
|---|---|---|---|
| Less than $10,000 | 5.9% | 5.0% | 5.0% |
| $10,000 to $14,999 | 3.5% | 3.7% | 3.4% |
| $15,000 to $24,999 | 8.1% | 7.1% | 6.3% |
| $25,000 to $34,999 | 8.0% | 7.4% | 6.6% |
| $35,000 to $49,999 | 12.6% | 11.7% | 10.1% |
| $50,000 to $74,999 | 17.1% | 16.8% | 15.5% |
| $75,000 to $99,999 | 12.2% | 13.0% | 12.6% |
| $100,000 to $149,999 | 14.9% | 16.6% | 17.5% |
| $150,000 to $199,999 | 7.0% | 8.3% | 9.6% |
| $200,000 or more | 10.8% | 10.4% | 13.4% |
Source: U.S. Census ACS 5-year estimates (2024)


