Boulder City SnackAbility
Overall SnackAbility
Crime in Boulder City summary. We use data from the FBI to determine the crime rates in Boulder City. Key points include:
There were 133 total crimes in Boulder City in the last reporting year.
The overall crime rate per 100,000 people in Boulder City is 898.6 / 100k people.
The violent crime rate per 100,000 people in Boulder City is 182.4 / 100k people.
The property crime rate per 100,000 people in Boulder City is 716.2 / 100k people.
Overall, crime in Boulder City is -57.60% below the national average.
Total Crimes
Below National Average
Crime In Boulder City Comparison Table
| Statistic | Count Raw |
Boulder City / 100k People |
Nevada / 100k People |
National / 100k People |
|---|---|---|---|---|
| Total Crimes Per 100K | 133 | 898.6 | 2,599.0 | 2,119.2 |
| Violent Crime | 27 | 182.4 | 402.0 | 359.0 |
| Murder | 0 | 0.0 | 6.1 | 5.0 |
| Robbery | 4 | 27.0 | 63.1 | 61.0 |
| Aggravated Assault | 16 | 108.1 | 281.0 | 256.0 |
| Property Crime | 106 | 716.2 | 2,197.0 | 1,760.0 |
| Burglary | 17 | 114.9 | 364.4 | 229.0 |
| Larceny | 78 | 527.0 | 1,357.2 | 1,272.0 |
| Car Theft | 11 | 74.3 | 475.4 | 259.0 |
Source: FBI Uniform Crime Reporting (2024)
Cost of living in Boulder City summary. We use data on the cost of living to determine how expensive it is to live in Boulder City. Real estate prices drive most of the variance in cost of living around Nevada. Key points include:
The cost of living in Boulder City is 120 with 100 being average.
The cost of living in Boulder City is 1.2x higher than the national average.
The median home value in Boulder City is $470,943.
The median income in Boulder City is $74,757.
Boulder City's Overall Cost Of Living
Higher Than The National Average
Cost Of Living In Boulder City Comparison Table
| Living Expense | Boulder City | Nevada | National Average |
|---|---|---|---|
| Overall | 120 | 105 | 100 |
| Services | 104 | 103 | 100 |
| Groceries | 99 | 102 | 100 |
| Health | 149 | 101 | 100 |
| Housing | 99 | 102 | 100 |
| Transportation | 111 | 109 | 100 |
| Utilities | 109 | 103 | 100 |
Source: Cost of living index, normalized to US average = 100
Boulder City, NV Weather
The average high in Boulder City is 79.1° and the average low is 57.7°.
There are 14.4 days of precipitation each year.
Expect an average of 5.2 inches of precipitation each year with 0.0 inches of snow.
| Stat | Boulder City |
|---|---|
| Average Annual High | 79.1 |
| Average Annual Low | 57.7 |
| Annual Precipitation Days | 14.4 |
| Average Annual Precipitation | 5.2 |
| Average Annual Snowfall | 0.0 |
Average High
Days of Rain
Source: NOAA climate normals (30-year)
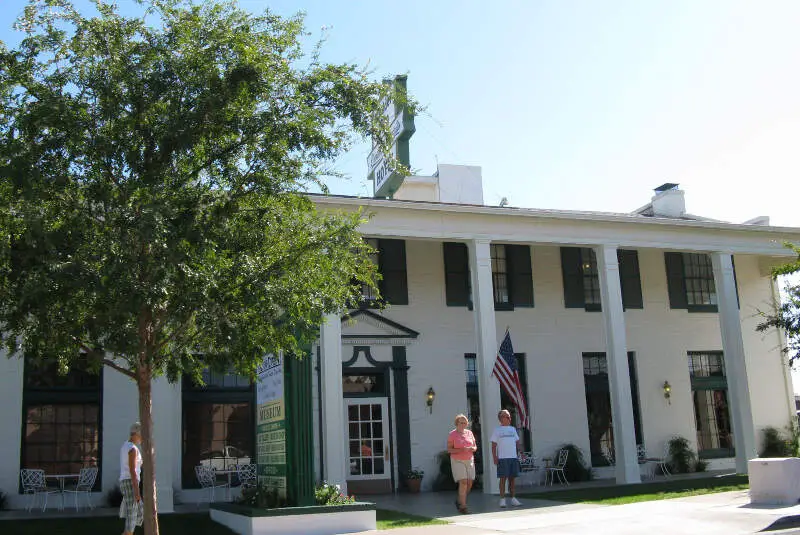
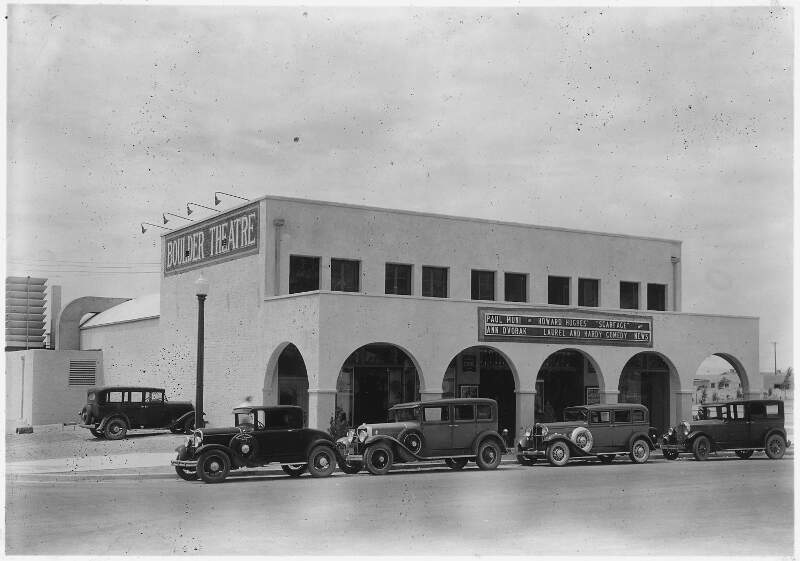
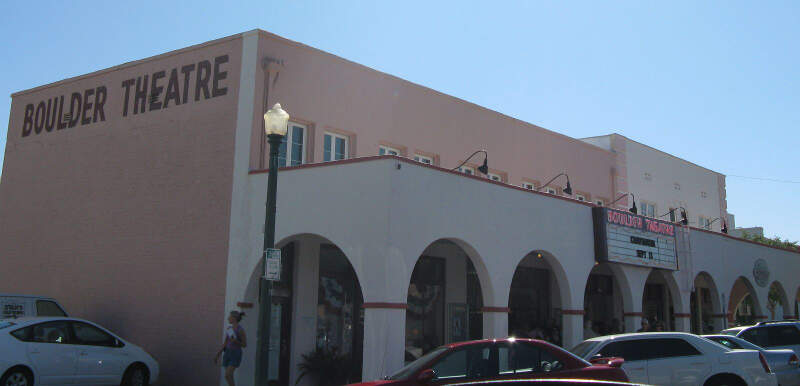
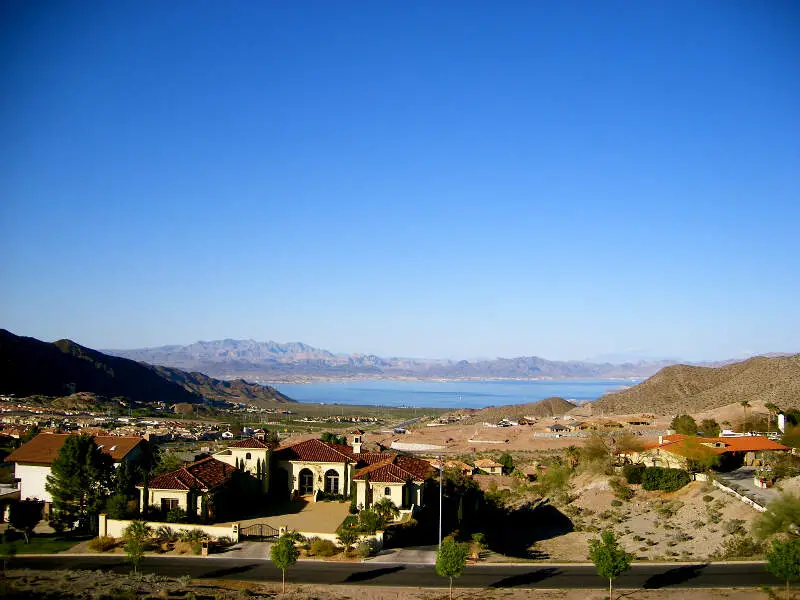
Boulder City, NV Photos

1 Reviews & Comments About Boulder City

Boulder City is a town that will remind you of where you grew up. Because it still has that small town atmosphere. Crime is the lowest in the state and the community support is there for the schools and downtown dining. There are lots of quaint vintage and antiques shops, and old fashioned ice cream & candy shop, museums, outdoor activities and a great guide to finding what interests you in The Country Register of Southern Nevada.
Favorite places are The Coffee Cup Caf, Grandma Daisies, Back in Thyme Antiques
Rankings & Articles For Boulder City


Locations Around Boulder City
Map Of Boulder City, NV
Best Places Around Boulder City
Boulder City Demographics And Statistics
Population over time in Boulder City
The current population in Boulder City is 14,919. The population has decreased 3.1% from 2010.
| Year | Population | % Change |
|---|---|---|
| 2024 | 14,919 | 0.2% |
| 2023 | 14,888 | 0.1% |
| 2022 | 14,868 | 0.0% |
| 2021 | 14,868 | -7.4% |
| 2020 | 16,048 | 1.3% |
| 2019 | 15,840 | 1.0% |
| 2018 | 15,680 | 0.2% |
| 2017 | 15,648 | 1.8% |
| 2016 | 15,373 | 0.7% |
| 2015 | 15,266 | 0.7% |
| 2014 | 15,162 | 0.3% |
| 2013 | 15,122 | -0.5% |
| 2012 | 15,194 | -0.8% |
| 2011 | 15,318 | -0.5% |
| 2010 | 15,399 | - |
Race / Ethnicity in Boulder City
See the full breakdown
Boulder City is:
84.6% White with 12,621 White residents.
0.8% African American with 124 African American residents.
0.3% American Indian with 49 American Indian residents.
0.7% Asian with 108 Asian residents.
0.2% Hawaiian with 27 Hawaiian residents.
0.0% Other with 2 Other residents.
6.3% Two Or More with 933 Two Or More residents.
7.1% Hispanic with 1,055 Hispanic residents.
| Race | Boulder City | NV | USA |
|---|---|---|---|
| White | 84.6% | 44.8% | 57.4% |
| African American | 0.8% | 9.0% | 11.9% |
| American Indian | 0.3% | 0.6% | 0.5% |
| Asian | 0.7% | 8.8% | 5.9% |
| Hawaiian | 0.2% | 0.7% | 0.2% |
| Other | 0.0% | 0.6% | 0.6% |
| Two Or More | 6.3% | 6.0% | 4.3% |
| Hispanic | 7.1% | 29.6% | 19.3% |
Gender in Boulder City
See the full breakdown
Boulder City is 49.5% female with 7,380 female residents.
Boulder City is 50.5% male with 7,539 male residents.
| Gender | Boulder City | NV | USA |
|---|---|---|---|
| Female | 49.5% | 49.6% | 50.5% |
| Male | 50.5% | 50.4% | 49.5% |
Highest level of educational attainment in Boulder City for adults over 25
See the full breakdown
2.0% of adults in Boulder City completed < 9th grade.
2.0% of adults in Boulder City completed 9-12th grade.
30.0% of adults in Boulder City completed high school / ged.
29.0% of adults in Boulder City completed some college.
6.0% of adults in Boulder City completed associate's degree.
19.0% of adults in Boulder City completed bachelor's degree.
10.0% of adults in Boulder City completed master's degree.
1.0% of adults in Boulder City completed professional degree.
1.0% of adults in Boulder City completed doctorate degree.
| Education | Boulder City | NV | USA |
|---|---|---|---|
| < 9th Grade | 2.0% | 5.0% | 4.0% |
| 9-12th Grade | 2.0% | 7.0% | 6.0% |
| High School / GED | 30.0% | 28.0% | 26.0% |
| Some College | 29.0% | 23.0% | 19.0% |
| Associate's Degree | 6.0% | 9.0% | 9.0% |
| Bachelor's Degree | 19.0% | 18.0% | 22.0% |
| Master's Degree | 10.0% | 7.0% | 10.0% |
| Professional Degree | 1.0% | 2.0% | 2.0% |
| Doctorate Degree | 1.0% | 1.0% | 2.0% |
Household Income For Boulder City, Nevada
See the full breakdown
5.4% of households in Boulder City earn Less than $10,000.
1.9% of households in Boulder City earn $10,000 to $14,999.
8.5% of households in Boulder City earn $15,000 to $24,999.
9.4% of households in Boulder City earn $25,000 to $34,999.
11.9% of households in Boulder City earn $35,000 to $49,999.
13.1% of households in Boulder City earn $50,000 to $74,999.
12.2% of households in Boulder City earn $75,000 to $99,999.
14.9% of households in Boulder City earn $100,000 to $149,999.
9.8% of households in Boulder City earn $150,000 to $199,999.
13.0% of households in Boulder City earn $200,000 or more.
| Income | Boulder City | NV | USA |
|---|---|---|---|
| Less than $10,000 | 5.4% | 5.4% | 5.0% |
| $10,000 to $14,999 | 1.9% | 2.6% | 3.4% |
| $15,000 to $24,999 | 8.5% | 5.9% | 6.3% |
| $25,000 to $34,999 | 9.4% | 6.9% | 6.6% |
| $35,000 to $49,999 | 11.9% | 10.8% | 10.1% |
| $50,000 to $74,999 | 13.1% | 16.5% | 15.5% |
| $75,000 to $99,999 | 12.2% | 13.5% | 12.6% |
| $100,000 to $149,999 | 14.9% | 18.2% | 17.5% |
| $150,000 to $199,999 | 9.8% | 9.3% | 9.6% |
| $200,000 or more | 13.0% | 10.9% | 13.4% |
Source: U.S. Census ACS 5-year estimates (2024)


