Albany SnackAbility
Overall SnackAbility
Crime in Albany summary. We use data from the FBI to determine the crime rates in Albany. Key points include:
There were 3,742 total crimes in Albany in the last reporting year.
The overall crime rate per 100,000 people in Albany is 3,665.2 / 100k people.
The violent crime rate per 100,000 people in Albany is 816.9 / 100k people.
The property crime rate per 100,000 people in Albany is 2,848.3 / 100k people.
Overall, crime in Albany is 72.95% above the national average.
Total Crimes
Above National Average
Crime In Albany Comparison Table
| Statistic | Count Raw |
Albany / 100k People |
New York / 100k People |
National / 100k People |
|---|---|---|---|---|
| Total Crimes Per 100K | 3,742 | 3,665.2 | 2,099.7 | 2,119.2 |
| Violent Crime | 834 | 816.9 | 380.2 | 359.0 |
| Murder | 9 | 8.8 | 2.7 | 5.0 |
| Robbery | 183 | 179.2 | 96.1 | 61.0 |
| Aggravated Assault | 568 | 556.3 | 259.6 | 256.0 |
| Property Crime | 2,908 | 2,848.3 | 1,719.5 | 1,760.0 |
| Burglary | 319 | 312.5 | 136.6 | 229.0 |
| Larceny | 2,298 | 2,250.8 | 1,432.8 | 1,272.0 |
| Car Theft | 291 | 285.0 | 150.2 | 259.0 |
Source: FBI Uniform Crime Reporting (2024)
Cost of living in Albany summary. We use data on the cost of living to determine how expensive it is to live in Albany. Real estate prices drive most of the variance in cost of living around New York. Key points include:
The cost of living in Albany is 110 with 100 being average.
The cost of living in Albany is 1.1x higher than the national average.
The median home value in Albany is $320,505.
The median income in Albany is $61,986.
Albany's Overall Cost Of Living
Higher Than The National Average
Cost Of Living In Albany Comparison Table
| Living Expense | Albany | New York | National Average |
|---|---|---|---|
| Overall | 110 | 121 | 100 |
| Services | 108 | 105 | 100 |
| Groceries | 112 | 108 | 100 |
| Health | 104 | 143 | 100 |
| Housing | 112 | 112 | 100 |
| Transportation | 119 | 114 | 100 |
| Utilities | 112 | 111 | 100 |
Source: Cost of living index, normalized to US average = 100
Albany, NY Weather
The average high in Albany is 58.1° and the average low is 39.2°.
There are 79.6 days of precipitation each year.
Expect an average of 40.0 inches of precipitation each year with 53.6 inches of snow.
| Stat | Albany |
|---|---|
| Average Annual High | 58.1 |
| Average Annual Low | 39.2 |
| Annual Precipitation Days | 79.6 |
| Average Annual Precipitation | 40.0 |
| Average Annual Snowfall | 53.6 |
Average High
Days of Rain
Source: NOAA climate normals (30-year)
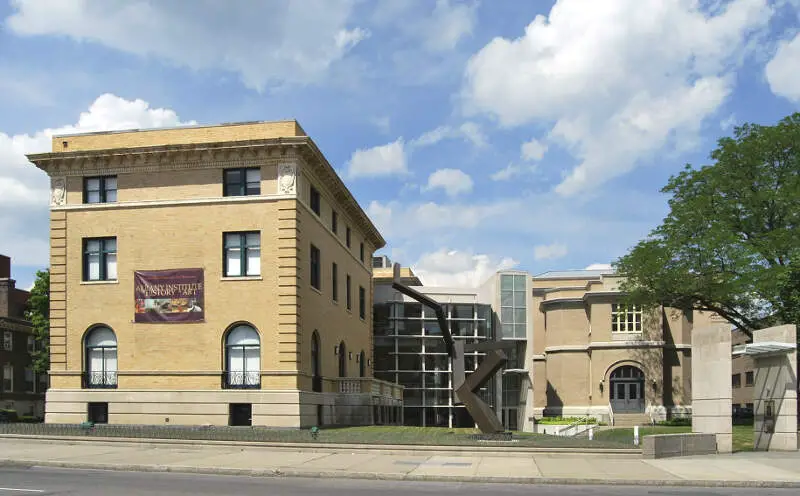
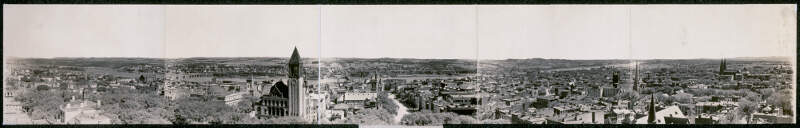
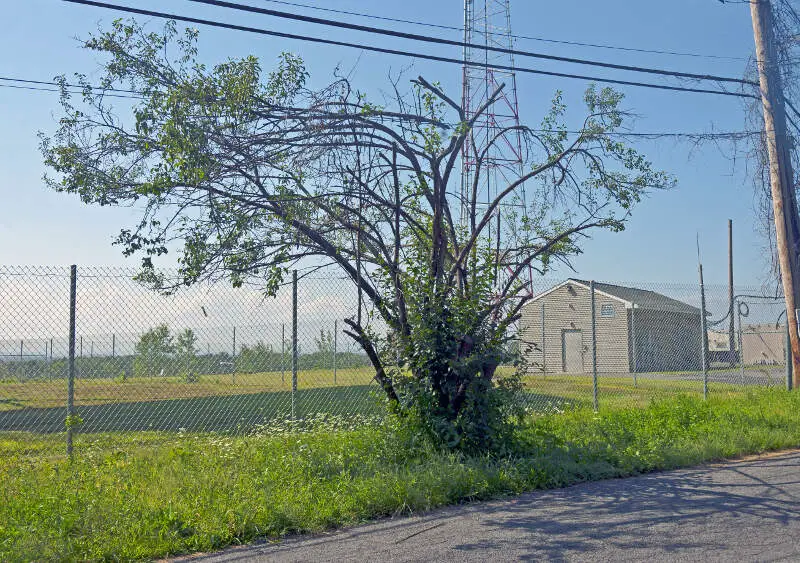
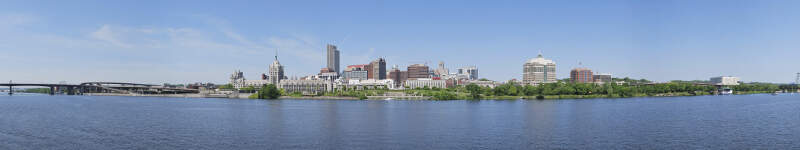
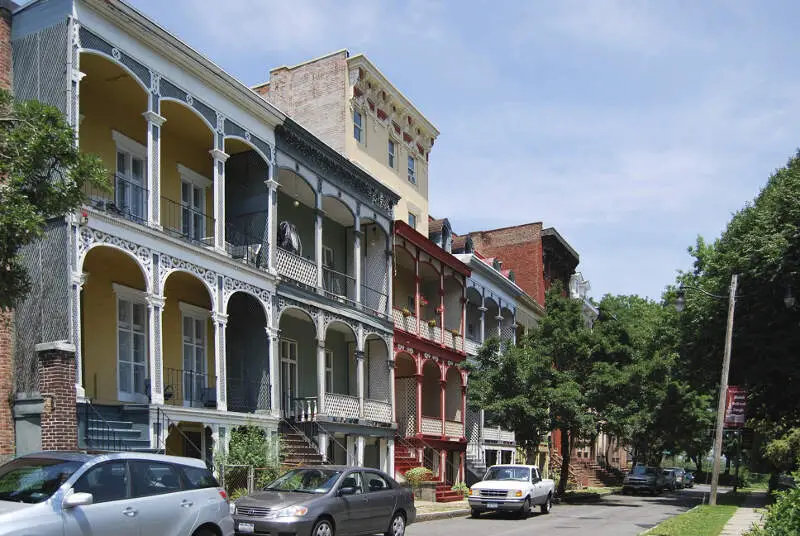
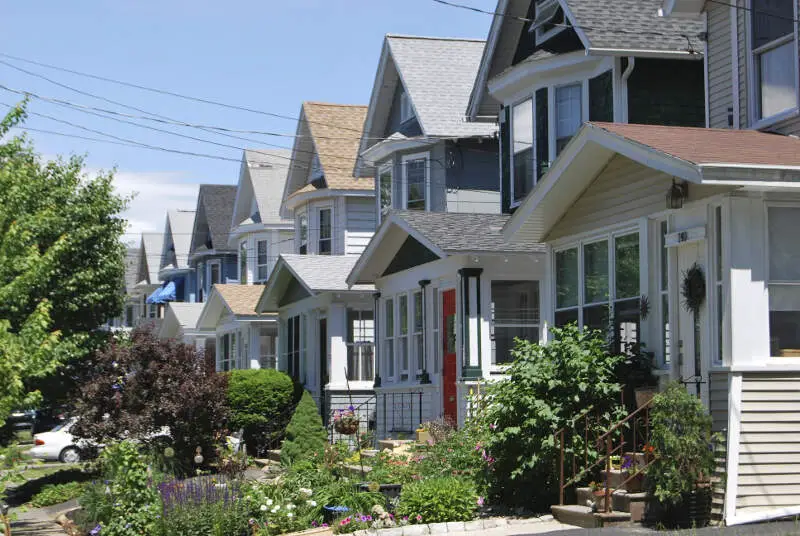
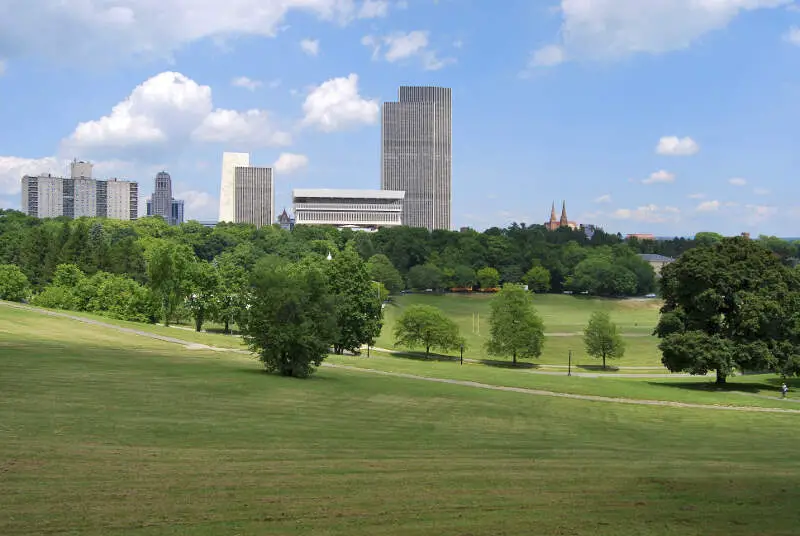
Albany, NY Photos


Rankings & Articles For Albany


Locations Around Albany
Map Of Albany, NY
Best Places Around Albany
Colonie, NY
Population 7,702
Niskayuna, NY
Population 21,227
Westmere, NY
Population 8,334
Cohoes, NY
Population 18,159
Rensselaer, NY
Population 9,287
Mechanicville, NY
Population 5,124
Scotia, NY
Population 7,264
East Glenville, NY
Population 11,914
Rotterdam, NY
Population 22,695
Troy, NY
Population 51,033
Albany Demographics And Statistics
Population over time in Albany
The current population in Albany is 100,492. The population has increased 2.6% from 2010.
| Year | Population | % Change |
|---|---|---|
| 2024 | 100,492 | 0.4% |
| 2023 | 100,081 | 0.4% |
| 2022 | 99,692 | 0.3% |
| 2021 | 99,402 | 2.6% |
| 2020 | 96,860 | -0.6% |
| 2019 | 97,478 | -0.4% |
| 2018 | 97,889 | -0.6% |
| 2017 | 98,498 | 0.1% |
| 2016 | 98,425 | -0.0% |
| 2015 | 98,468 | 0.2% |
| 2014 | 98,287 | 0.1% |
| 2013 | 98,142 | 0.3% |
| 2012 | 97,892 | 0.0% |
| 2011 | 97,879 | -0.1% |
| 2010 | 97,951 | - |
Race / Ethnicity in Albany
See the full breakdown
Albany is:
50.1% White with 50,326 White residents.
24.6% African American with 24,671 African American residents.
0.0% American Indian with 49 American Indian residents.
7.7% Asian with 7,722 Asian residents.
0.0% Hawaiian with 12 Hawaiian residents.
1.2% Other with 1,172 Other residents.
5.5% Two Or More with 5,493 Two Or More residents.
11.0% Hispanic with 11,047 Hispanic residents.
| Race | Albany | NY | USA |
|---|---|---|---|
| White | 50.1% | 52.8% | 57.4% |
| African American | 24.6% | 13.4% | 11.9% |
| American Indian | 0.0% | 0.2% | 0.5% |
| Asian | 7.7% | 9.0% | 5.9% |
| Hawaiian | 0.0% | 0.0% | 0.2% |
| Other | 1.2% | 1.0% | 0.6% |
| Two Or More | 5.5% | 3.8% | 4.3% |
| Hispanic | 11.0% | 19.8% | 19.3% |
Gender in Albany
See the full breakdown
Albany is 51.8% female with 52,070 female residents.
Albany is 48.2% male with 48,422 male residents.
| Gender | Albany | NY | USA |
|---|---|---|---|
| Female | 51.8% | 51.2% | 50.5% |
| Male | 48.2% | 48.8% | 49.5% |
Highest level of educational attainment in Albany for adults over 25
See the full breakdown
4.0% of adults in Albany completed < 9th grade.
5.0% of adults in Albany completed 9-12th grade.
21.0% of adults in Albany completed high school / ged.
16.0% of adults in Albany completed some college.
9.0% of adults in Albany completed associate's degree.
24.0% of adults in Albany completed bachelor's degree.
14.0% of adults in Albany completed master's degree.
4.0% of adults in Albany completed professional degree.
3.0% of adults in Albany completed doctorate degree.
| Education | Albany | NY | USA |
|---|---|---|---|
| < 9th Grade | 4.0% | 6.0% | 4.0% |
| 9-12th Grade | 5.0% | 6.0% | 6.0% |
| High School / GED | 21.0% | 24.0% | 26.0% |
| Some College | 16.0% | 15.0% | 19.0% |
| Associate's Degree | 9.0% | 9.0% | 9.0% |
| Bachelor's Degree | 24.0% | 22.0% | 22.0% |
| Master's Degree | 14.0% | 13.0% | 10.0% |
| Professional Degree | 4.0% | 3.0% | 2.0% |
| Doctorate Degree | 3.0% | 2.0% | 2.0% |
Household Income For Albany, New York
See the full breakdown
9.7% of households in Albany earn Less than $10,000.
6.1% of households in Albany earn $10,000 to $14,999.
8.8% of households in Albany earn $15,000 to $24,999.
5.9% of households in Albany earn $25,000 to $34,999.
10.3% of households in Albany earn $35,000 to $49,999.
17.4% of households in Albany earn $50,000 to $74,999.
11.6% of households in Albany earn $75,000 to $99,999.
15.4% of households in Albany earn $100,000 to $149,999.
8.1% of households in Albany earn $150,000 to $199,999.
6.9% of households in Albany earn $200,000 or more.
| Income | Albany | NY | USA |
|---|---|---|---|
| Less than $10,000 | 9.7% | 5.8% | 5.0% |
| $10,000 to $14,999 | 6.1% | 3.9% | 3.4% |
| $15,000 to $24,999 | 8.8% | 6.3% | 6.3% |
| $25,000 to $34,999 | 5.9% | 6.2% | 6.6% |
| $35,000 to $49,999 | 10.3% | 8.9% | 10.1% |
| $50,000 to $74,999 | 17.4% | 13.6% | 15.5% |
| $75,000 to $99,999 | 11.6% | 11.4% | 12.6% |
| $100,000 to $149,999 | 15.4% | 16.7% | 17.5% |
| $150,000 to $199,999 | 8.1% | 10.1% | 9.6% |
| $200,000 or more | 6.9% | 17.1% | 13.4% |
Source: U.S. Census ACS 5-year estimates (2024)


