It’s true what you read about New York in those fancy magazines. There are cities in the Empire State that make Beverly Hills, CA, look like the home of the middle class. Something or someone has to keep this larger-than-life state ticking. And that would be the rich New Yorkers who own it.
We’ve done the work to identify the top ten richest cities in New York for 2026. To create this list, we used Saturday Night Science to analyze the latest Census and Zillow data on incomes and home prices. We limited the analysis to 237 New York cities with more than 3,000 residents.
To live in these cities, you need to find a job that pays an average of $175,000/year. We suggest a job in banking. Someone has to help all of those wealthy New Yorkers manage their money.
Wealthy people want to live in the best cities, so it’s not lost on us that there are multiple cities on our ten best cities to live in new york for that are also on our richest list.
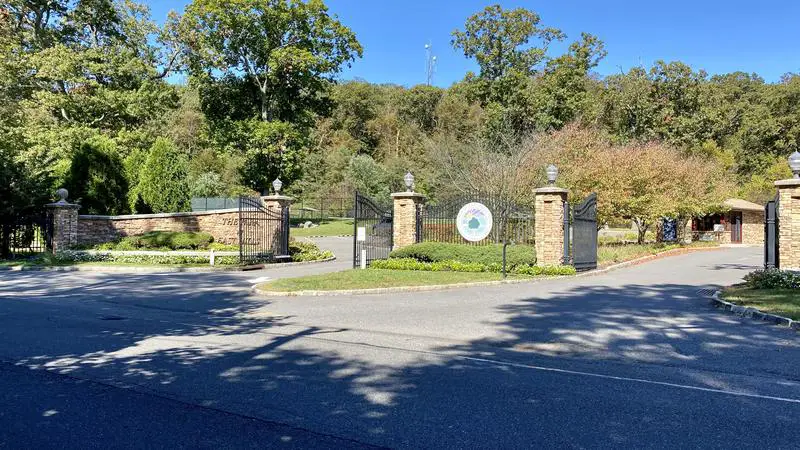
$250,001 median income · 3.2% poverty · #4 income in New York
Data | Crime | Cost of living | Movers
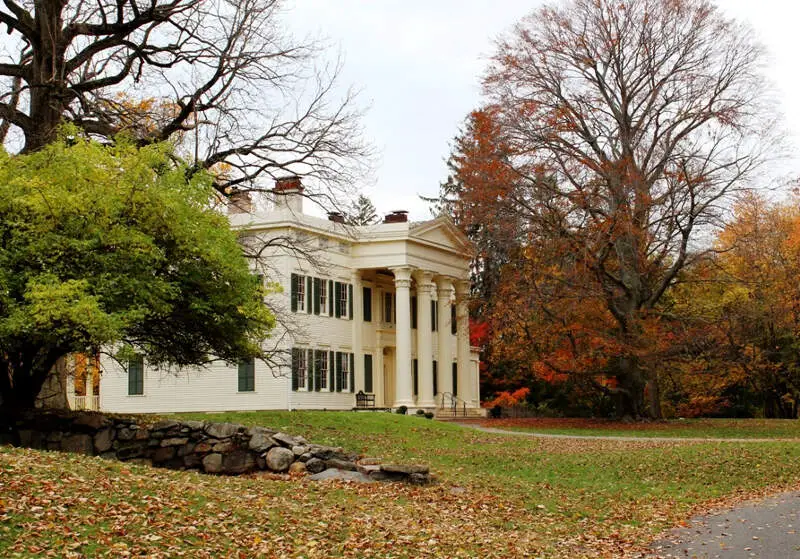
$250,001 median income · 2.9% poverty · #4 income in New York
Data | Crime | Cost of living | Movers
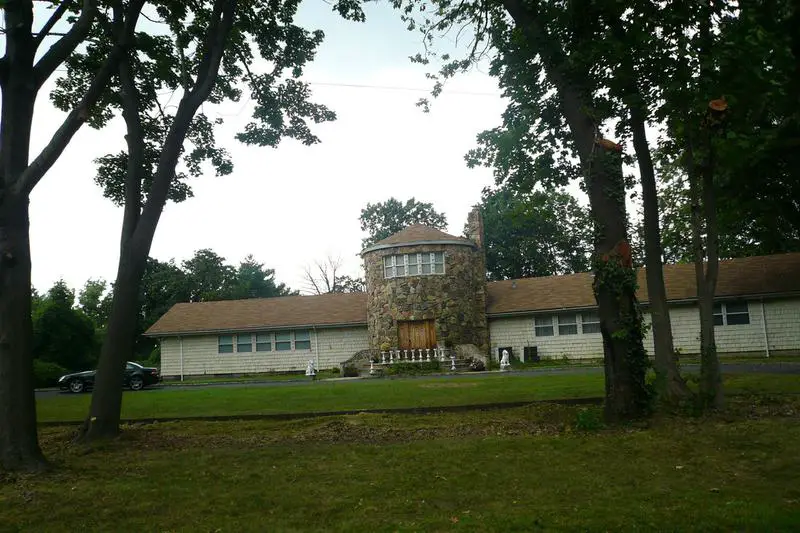
$250,001 median income · 4.0% poverty · #4 income in New York
Data | Crime | Cost of living | Movers
$250,001 median income · 2.9% poverty · #4 income in New York
Scarsdale is a town and village in Westchester County, New York. The Town of Scarsdale is coextensive with the Village of Scarsdale, but the community has opted to operate solely with a village government, one of several villages in the state that have a similar governmental situation. As of the 2010 census, Scarsdale’s population was 17,166.
Data | Crime | Cost of living | Movers
$250,001 median income · 2.1% poverty · #4 income in New York
Data | Crime | Cost of living | Movers
$250,001 median income · 2.8% poverty · #4 income in New York
East Hills is a village in Nassau County, New York on the North Shore of Long Island. It is considered part of the Greater Roslyn area, which is anchored by the Village of Roslyn. As of the United States 2010 Census, the village population was 6,955.
Data | Crime | Cost of living | Movers
$239,815 median income · 2.7% poverty · #11 income in New York
Rye is a city in Westchester County, New York, United States. It is separate from the town of Rye, which has more land area than the city. Rye city, formerly the village of Rye, was part of the town until it received its charter as a city in 1942. The population was 15,720 at the 2010 census. Rye is the youngest city in New York state. No other city has been chartered anywhere in New York state since 1942.
Data | Crime | Cost of living | Movers
$211,299 median income · 0.9% poverty · #17 income in New York
Data | Crime | Cost of living | Movers
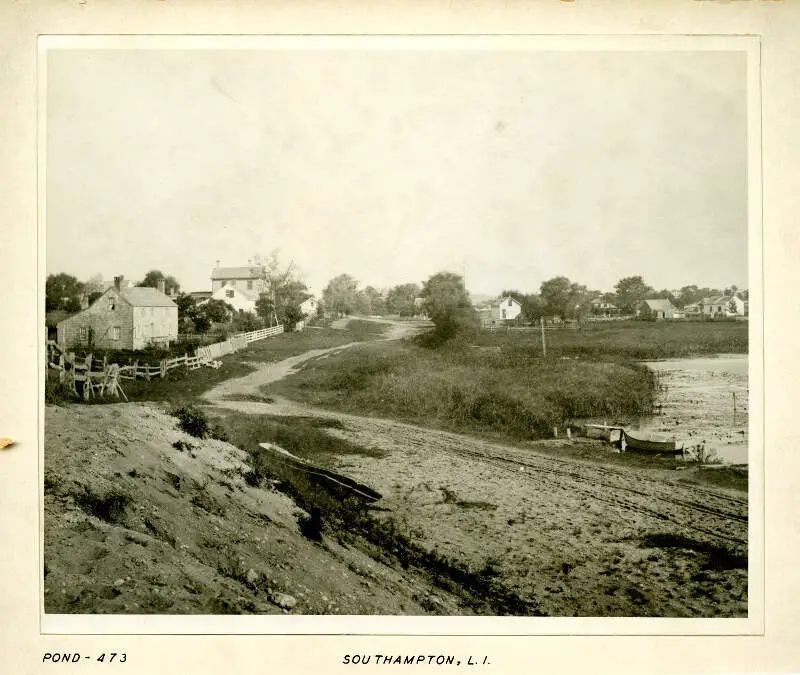
$214,032 median income · 4.8% poverty · #16 income in New York
Data | Crime | Cost of living | Movers
$237,788 median income · 5.7% poverty · #12 income in New York
The receipts
Compare the top ten
Pick a metric. The bars rescale. The red line is New York’s statewide median.
New York statewide median: $85,974
New York statewide median: $507,794
New York statewide median: 14.0%
New York statewide median: 6.4%
On the map
Where the money lives in New York
Saturday Night Science
How we determined the richest places in New York for 2026
The first thing most people reach for is personal income. After all, rich people have really high salaries. But one statistic doesn’t capture what it means to be one of the “richest places,” so we applied Saturday Night Science to two measures from the 2020-2024 American Community Survey:
- Median household income
- Median home value
Median household income is the most digestible way to understand how rich a place is, and home values are a measure of accumulated wealth. The two combine to define a “Rich City.”
After collecting the data for all 237 places in New York with more than 3,000 people, we ranked each place from 1 to 237 on both criteria, then averaged the two ranks into a “Rich Score.” The place with the lowest Rich Score, Old Westbury, is crowned the richest city in New York for 2026.
The full plate
All 100 richest cities in New York, ranked
Click any column to sort. Search by city name.
| Rank | City | Rich Score | Population | Median income | Median home value | Poverty | Unemployment |
|---|---|---|---|---|---|---|---|
| 1 | Old Westbury | 2.50 | 4,241 | $250,001 | $2,918,405 | 3.2% | 5.2% |
| 2 | Flower Hill | 3.50 | 4,803 | $250,001 | $2,367,031 | 2.9% | 5.0% |
| 3 | Mutto | 4.00 | 3,505 | $250,001 | $2,294,300 | 4.0% | 7.1% |
| 4 | Scarsdale | 5.50 | 18,010 | $250,001 | $2,157,586 | 2.9% | 4.5% |
| 5 | Lloyd Harbor | 6.50 | 3,565 | $250,001 | $2,031,896 | 2.1% | 0.9% |
| 6 | East Hills | 7.50 | 7,257 | $250,001 | $1,751,159 | 2.8% | 4.1% |
| 7 | Rye | 8.00 | 16,428 | $239,815 | $2,180,592 | 2.7% | 5.4% |
| 8 | Kings Point | 9.50 | 5,634 | $211,299 | $2,373,621 | 0.9% | 2.4% |
| 9 | Southampton | 11.00 | 4,621 | $214,032 | $2,163,751 | 4.8% | 10.0% |
| 10 | Great Neck Estates | 11.00 | 3,023 | $237,788 | $1,963,479 | 5.7% | 1.7% |
| 11 | Pelham Manor | 11.50 | 5,644 | $250,001 | $1,309,985 | 2.5% | 5.2% |
| 12 | Garden City | 13.50 | 22,941 | $244,152 | $1,338,517 | 3.0% | 3.9% |
| 13 | Rye Brook | 14.50 | 9,900 | $246,944 | $1,236,848 | 5.6% | 6.2% |
| 14 | Bronxville | 15.50 | 6,510 | $215,815 | $1,450,321 | 4.6% | 3.8% |
| 15 | Lawrence | 17.00 | 6,778 | $170,000 | $2,123,230 | 3.5% | 3.9% |
| 16 | North Hills | 18.50 | 5,415 | $173,315 | $1,472,340 | 3.0% | 1.9% |
| 17 | Pelham | 19.50 | 7,305 | $184,375 | $1,360,404 | 2.9% | 5.3% |
| 18 | Larchmont | 19.50 | 6,567 | $167,536 | $1,661,377 | 1.5% | 10.5% |
| 19 | Briarcliff Manor | 20.00 | 7,519 | $229,732 | $1,094,016 | 7.1% | 3.1% |
| 20 | Ardsley | 21.00 | 4,998 | $243,000 | $999,658 | 4.4% | 5.7% |
| 21 | Wesley Hills | 21.50 | 6,196 | $209,345 | $1,123,610 | 5.5% | 2.4% |
| 22 | Sea Cliff | 23.00 | 5,033 | $193,590 | $1,099,757 | 0.9% | 13.5% |
| 23 | Irvington | 23.00 | 6,531 | $173,248 | $1,222,448 | 1.6% | 2.1% |
| 24 | Hastings-on-Hudson | 24.50 | 8,434 | $193,621 | $1,036,677 | 2.3% | 4.1% |
| 25 | Harrison | 26.50 | 29,961 | $164,250 | $1,211,014 | 4.1% | 5.5% |
| 26 | Great Neck | 29.50 | 11,087 | $137,981 | $1,455,883 | 6.6% | 6.7% |
| 27 | Dobbs Ferry | 32.00 | 11,443 | $165,417 | $975,067 | 6.6% | 5.0% |
| 28 | Brightwaters | 32.00 | 3,179 | $218,000 | $819,935 | 0.2% | 4.4% |
| 29 | Port Washington North | 34.00 | 3,149 | $136,389 | $1,268,767 | 2.8% | 4.2% |
| 30 | Woodbury | 34.50 | 11,334 | $121,221 | $1,478,907 | 4.6% | 7.7% |
| 31 | Rockville Centre | 35.00 | 25,765 | $151,938 | $965,150 | 4.7% | 5.8% |
| 32 | Williston Park | 35.00 | 7,542 | $156,382 | $927,596 | 3.2% | 5.4% |
| 33 | Croton-on-Hudson | 37.00 | 8,202 | $191,678 | $812,905 | 3.7% | 7.2% |
| 34 | New Hyde Park | 38.00 | 10,220 | $142,927 | $974,068 | 3.6% | 4.9% |
| 35 | Montebello | 38.50 | 4,673 | $133,750 | $1,081,804 | 11.2% | 4.1% |
| 36 | Floral Park | 39.50 | 16,169 | $150,084 | $858,496 | 3.0% | 3.1% |
| 37 | Pleasantville | 40.00 | 7,371 | $136,406 | $987,582 | 5.7% | 7.7% |
| 38 | Northport | 41.50 | 7,322 | $146,921 | $850,559 | 12.2% | 0.8% |
| 39 | Bayville | 41.50 | 6,744 | $149,191 | $841,959 | 3.7% | 4.5% |
| 40 | Massapequa Park | 42.00 | 16,963 | $171,953 | $792,452 | 3.1% | 4.6% |
| 41 | New Hempstead | 43.50 | 5,472 | $126,165 | $978,445 | 12.2% | 5.5% |
| 42 | Malverne | 46.00 | 8,477 | $149,489 | $801,814 | 8.2% | 2.3% |
| 43 | Mineola | 48.00 | 21,211 | $137,739 | $815,487 | 5.3% | 3.2% |
| 44 | Long Beach | 49.00 | 34,756 | $140,739 | $805,359 | 7.6% | 3.2% |
| 45 | Westbury | 49.50 | 15,808 | $145,185 | $768,992 | 3.4% | 3.9% |
| 46 | Pomona | 50.50 | 3,996 | $156,000 | $722,364 | 2.2% | 4.2% |
| 47 | Port Jefferson | 51.00 | 8,091 | $144,912 | $756,205 | 5.6% | 3.3% |
| 48 | Mamaroneck | 51.50 | 19,826 | $120,000 | $859,344 | 10.7% | 4.1% |
| 49 | Chestnut Ridge | 53.50 | 10,557 | $111,725 | $862,819 | 8.1% | 4.0% |
| 50 | New Rochelle | 54.00 | 82,769 | $109,167 | $917,531 | 10.1% | 5.9% |
| 51 | Cedarhurst | 55.00 | 7,320 | $101,572 | $1,206,385 | 6.4% | 4.8% |
| 52 | Lynbrook | 55.50 | 20,325 | $136,696 | $745,362 | 7.5% | 4.5% |
| 53 | Babylon | 55.50 | 12,185 | $140,820 | $720,476 | 3.5% | 3.5% |
| 54 | Valley Stream | 56.00 | 40,315 | $133,190 | $756,941 | 5.5% | 2.8% |
| 55 | Sleepy Hollow | 56.00 | 10,887 | $104,313 | $1,010,737 | 8.7% | 5.5% |
| 56 | East Rockaway | 60.50 | 10,077 | $124,929 | $735,012 | 2.6% | 3.2% |
| 57 | Tarr | 60.50 | 11,784 | $107,106 | $821,122 | 7.9% | 4.8% |
| 58 | Cayuga Heights | 61.50 | 4,000 | $166,526 | $518,818 | 11.2% | 3.6% |
| 59 | Manorhaven | 62.00 | 6,958 | $105,486 | $823,279 | 6.4% | 3.9% |
| 60 | White Plains | 62.50 | 60,666 | $110,763 | $770,309 | 11.2% | 5.9% |
| 61 | Nyack | 62.50 | 7,393 | $116,649 | $748,480 | 7.3% | 8.8% |
| 62 | Farmingdale | 63.00 | 8,474 | $122,980 | $717,477 | 5.2% | 3.7% |
| 63 | Airmont | 65.50 | 10,205 | $94,972 | $963,994 | 12.5% | 5.1% |
| 64 | Cornwall-on-Hudson | 65.50 | 3,037 | $140,208 | $564,589 | 3.6% | 5.5% |
| 65 | Lake Grove | 66.00 | 11,061 | $118,311 | $713,790 | 8.1% | 5.2% |
| 66 | Tuckahoe | 66.00 | 6,973 | $104,375 | $815,213 | 5.1% | 2.2% |
| 67 | Lindenhurst | 66.50 | 27,142 | $130,128 | $600,910 | 5.7% | 6.3% |
| 68 | Elmsford | 66.50 | 5,186 | $120,179 | $678,626 | 8.7% | 3.7% |
| 69 | Freeport | 66.50 | 44,088 | $120,625 | $652,866 | 7.4% | 6.4% |
| 70 | Islandia | 71.00 | 3,600 | $116,313 | $614,891 | 7.7% | 5.5% |
| 71 | Island Park | 71.50 | 4,976 | $104,926 | $743,254 | 12.5% | 5.8% |
| 72 | Glen Cove | 75.50 | 28,112 | $92,064 | $810,612 | 13.5% | 4.4% |
| 73 | Saratoga Springs | 76.00 | 28,631 | $105,944 | $633,902 | 9.7% | 2.5% |
| 74 | Patchogue | 77.50 | 12,396 | $107,306 | $586,013 | 10.6% | 3.5% |
| 75 | Amityville | 78.50 | 9,588 | $106,285 | $587,036 | 11.2% | 3.1% |
| 76 | Sloatsburg | 79.50 | 3,038 | $108,043 | $539,236 | 5.4% | 6.3% |
| 77 | Monroe | 80.00 | 9,515 | $109,851 | $530,517 | 9.0% | 3.0% |
| 78 | Beacon | 80.50 | 14,834 | $107,859 | $538,601 | 9.0% | 7.3% |
| 79 | New York | 81.00 | 8,483,844 | $80,483 | $812,861 | 17.9% | 8.0% |
| 80 | Mount Kisco | 81.50 | 10,737 | $96,534 | $688,450 | 8.2% | 5.7% |
| 81 | Port Chester | 81.50 | 31,102 | $92,222 | $725,361 | 12.9% | 5.4% |
| 82 | Suffern | 82.00 | 11,441 | $104,607 | $576,040 | 6.1% | 5.2% |
| 83 | Goshen | 83.50 | 5,773 | $104,643 | $558,034 | 2.2% | 4.1% |
| 84 | Fayetteville | 85.00 | 4,214 | $127,559 | $395,619 | 5.2% | 1.5% |
| 85 | Hempstead | 87.50 | 58,801 | $90,420 | $627,531 | 14.4% | 9.2% |
| 86 | Highland Falls | 88.00 | 3,683 | $110,714 | $415,969 | 7.2% | 6.6% |
| 87 | Ossining | 88.00 | 26,950 | $103,573 | $538,109 | 8.6% | 6.0% |
| 88 | Yonkers | 89.50 | 209,978 | $83,549 | $680,218 | 13.8% | 7.1% |
| 89 | Chester | 90.50 | 4,033 | $100,514 | $525,192 | 6.8% | 1.2% |
| 90 | Warwick | 93.00 | 6,585 | $89,609 | $566,347 | 5.5% | 5.6% |
| 91 | Washingtonville | 94.00 | 5,707 | $95,313 | $516,964 | 8.2% | 5.6% |
| 92 | Fairport | 95.00 | 5,403 | $107,009 | $396,821 | 12.6% | 1.8% |
| 93 | East Aurora | 95.00 | 5,993 | $103,949 | $431,047 | 3.0% | 4.0% |
| 94 | Orchard Park | 95.50 | 3,072 | $99,904 | $478,558 | 14.6% | 6.0% |
| 95 | Great Neck Plaza | 96.00 | 7,593 | $92,474 | $498,568 | 8.6% | 6.2% |
| 96 | Ballston Spa | 97.00 | 5,027 | $101,667 | $422,527 | 8.5% | 1.8% |
| 97 | Montgomery | 99.00 | 3,798 | $90,214 | $488,474 | 17.4% | 6.5% |
| 98 | Mount Vernon | 99.00 | 72,427 | $78,779 | $568,431 | 14.7% | 9.3% |
| 99 | Peekskill | 100.50 | 25,625 | $85,954 | $500,840 | 11.9% | 6.7% |
| 100 | Hamburg | 100.50 | 9,792 | $112,292 | $297,871 | 3.0% | 2.6% |
Source: U.S. Census ACS 2020-2024, Zillow research. 237 cities with more than 3,000 residents.
Old Westbury is the richest place in New York for 2026
When we set out to identify the richest places in New York, we weren’t sure what we’d find, but it ended up being some of the best places to live in the state. The richest cities in New York are Old Westbury, Flower Hill, and Mutto, and when you look at the data they sit at the very top of the income ladder for everyone who lives there.
Breaking into the top ten takes a median household income of at least $211,299. If you’re curious about the other end of the ledger, the poorest places are listed to the right.