Batavia SnackAbility
Overall SnackAbility
Crime in Batavia summary. We use data from the FBI to determine the crime rates in Batavia. Key points include:
There were 336 total crimes in Batavia in the last reporting year.
The overall crime rate per 100,000 people in Batavia is 2,181.8 / 100k people.
The violent crime rate per 100,000 people in Batavia is 376.6 / 100k people.
The property crime rate per 100,000 people in Batavia is 1,805.2 / 100k people.
Overall, crime in Batavia is 2.95% above the national average.
Total Crimes
Above National Average
Crime In Batavia Comparison Table
| Statistic | Count Raw |
Batavia / 100k People |
New York / 100k People |
National / 100k People |
|---|---|---|---|---|
| Total Crimes Per 100K | 336 | 2,181.8 | 2,099.7 | 2,119.2 |
| Violent Crime | 58 | 376.6 | 380.2 | 359.0 |
| Murder | 0 | 0.0 | 2.7 | 5.0 |
| Robbery | 9 | 58.4 | 96.1 | 61.0 |
| Aggravated Assault | 43 | 279.2 | 259.6 | 256.0 |
| Property Crime | 278 | 1,805.2 | 1,719.5 | 1,760.0 |
| Burglary | 24 | 155.8 | 136.6 | 229.0 |
| Larceny | 244 | 1,584.4 | 1,432.8 | 1,272.0 |
| Car Theft | 10 | 64.9 | 150.2 | 259.0 |
Source: FBI Uniform Crime Reporting (2024)
Cost of living in Batavia summary. We use data on the cost of living to determine how expensive it is to live in Batavia. Real estate prices drive most of the variance in cost of living around New York. Key points include:
The cost of living in Batavia is 97 with 100 being average.
The cost of living in Batavia is 1.0x lower than the national average.
The median home value in Batavia is $197,339.
The median income in Batavia is $59,446.
Batavia's Overall Cost Of Living
Lower Than The National Average
Cost Of Living In Batavia Comparison Table
| Living Expense | Batavia | New York | National Average |
|---|---|---|---|
| Overall | 97 | 121 | 100 |
| Services | 109 | 105 | 100 |
| Groceries | 114 | 108 | 100 |
| Health | 64 | 143 | 100 |
| Housing | 115 | 112 | 100 |
| Transportation | 112 | 114 | 100 |
| Utilities | 113 | 111 | 100 |
Source: Cost of living index, normalized to US average = 100
Batavia, NY Weather
The average high in Batavia is 57.0° and the average low is 38.0°.
There are 112.3 days of precipitation each year.
Expect an average of 35.2 inches of precipitation each year with 79.1 inches of snow.
| Stat | Batavia |
|---|---|
| Average Annual High | 57.0 |
| Average Annual Low | 38.0 |
| Annual Precipitation Days | 112.3 |
| Average Annual Precipitation | 35.2 |
| Average Annual Snowfall | 79.1 |
Average High
Days of Rain
Source: NOAA climate normals (30-year)
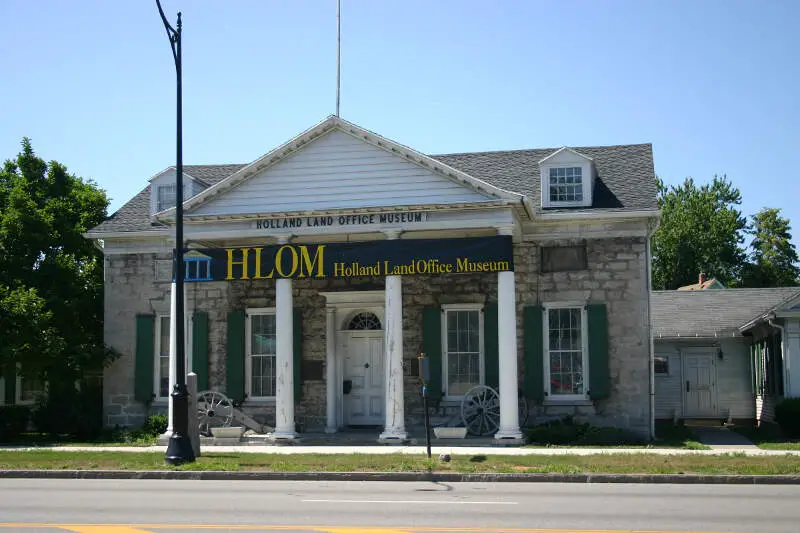
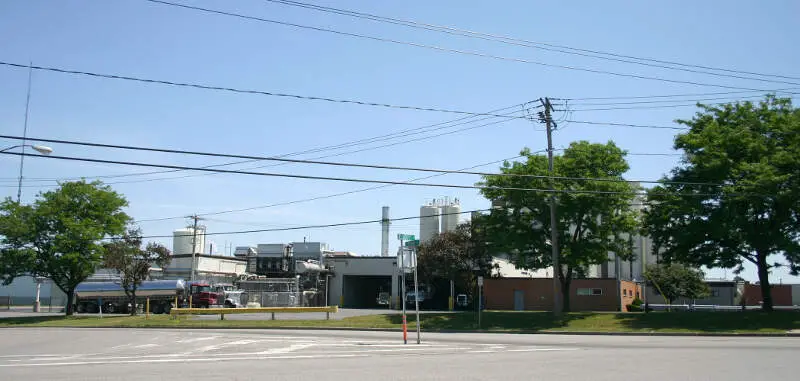
Batavia, NY Photos

Rankings & Articles For Batavia


Locations Around Batavia
Map Of Batavia, NY
Best Places Around Batavia
Hamburg, NY
Population 9,792
Brighton, NY
Population 36,834
Harris Hill, NY
Population 6,069
Fairport, NY
Population 5,403
East Aurora, NY
Population 5,993
Webster, NY
Population 5,718
Eggertsville, NY
Population 14,894
Williamsville, NY
Population 5,469
Batavia Demographics And Statistics
Population over time in Batavia
The current population in Batavia is 15,097. The population has decreased 3.1% from 2010.
| Year | Population | % Change |
|---|---|---|
| 2024 | 15,097 | -2.6% |
| 2023 | 15,494 | -0.1% |
| 2022 | 15,510 | 0.1% |
| 2021 | 15,497 | 6.9% |
| 2020 | 14,490 | -0.6% |
| 2019 | 14,578 | -1.0% |
| 2018 | 14,719 | -1.0% |
| 2017 | 14,868 | -1.0% |
| 2016 | 15,012 | -1.2% |
| 2015 | 15,188 | -0.6% |
| 2014 | 15,274 | -0.9% |
| 2013 | 15,406 | -0.4% |
| 2012 | 15,472 | -0.3% |
| 2011 | 15,523 | -0.4% |
| 2010 | 15,586 | - |
Race / Ethnicity in Batavia
See the full breakdown
Batavia is:
82.3% White with 12,431 White residents.
5.2% African American with 778 African American residents.
0.0% American Indian with 4 American Indian residents.
1.0% Asian with 144 Asian residents.
0.0% Hawaiian with 0 Hawaiian residents.
0.4% Other with 55 Other residents.
5.4% Two Or More with 821 Two Or More residents.
5.7% Hispanic with 864 Hispanic residents.
| Race | Batavia | NY | USA |
|---|---|---|---|
| White | 82.3% | 52.8% | 57.4% |
| African American | 5.2% | 13.4% | 11.9% |
| American Indian | 0.0% | 0.2% | 0.5% |
| Asian | 1.0% | 9.0% | 5.9% |
| Hawaiian | 0.0% | 0.0% | 0.2% |
| Other | 0.4% | 1.0% | 0.6% |
| Two Or More | 5.4% | 3.8% | 4.3% |
| Hispanic | 5.7% | 19.8% | 19.3% |
Gender in Batavia
See the full breakdown
Batavia is 48.4% female with 7,309 female residents.
Batavia is 51.6% male with 7,787 male residents.
| Gender | Batavia | NY | USA |
|---|---|---|---|
| Female | 48.4% | 51.2% | 50.5% |
| Male | 51.6% | 48.8% | 49.5% |
Highest level of educational attainment in Batavia for adults over 25
See the full breakdown
3.0% of adults in Batavia completed < 9th grade.
5.0% of adults in Batavia completed 9-12th grade.
37.0% of adults in Batavia completed high school / ged.
19.0% of adults in Batavia completed some college.
15.0% of adults in Batavia completed associate's degree.
11.0% of adults in Batavia completed bachelor's degree.
9.0% of adults in Batavia completed master's degree.
1.0% of adults in Batavia completed professional degree.
0.0% of adults in Batavia completed doctorate degree.
| Education | Batavia | NY | USA |
|---|---|---|---|
| < 9th Grade | 3.0% | 6.0% | 4.0% |
| 9-12th Grade | 5.0% | 6.0% | 6.0% |
| High School / GED | 37.0% | 24.0% | 26.0% |
| Some College | 19.0% | 15.0% | 19.0% |
| Associate's Degree | 15.0% | 9.0% | 9.0% |
| Bachelor's Degree | 11.0% | 22.0% | 22.0% |
| Master's Degree | 9.0% | 13.0% | 10.0% |
| Professional Degree | 1.0% | 3.0% | 2.0% |
| Doctorate Degree | 0.0% | 2.0% | 2.0% |
Household Income For Batavia, New York
See the full breakdown
5.1% of households in Batavia earn Less than $10,000.
7.4% of households in Batavia earn $10,000 to $14,999.
5.9% of households in Batavia earn $15,000 to $24,999.
9.2% of households in Batavia earn $25,000 to $34,999.
14.8% of households in Batavia earn $35,000 to $49,999.
16.5% of households in Batavia earn $50,000 to $74,999.
14.3% of households in Batavia earn $75,000 to $99,999.
13.2% of households in Batavia earn $100,000 to $149,999.
9.0% of households in Batavia earn $150,000 to $199,999.
4.7% of households in Batavia earn $200,000 or more.
| Income | Batavia | NY | USA |
|---|---|---|---|
| Less than $10,000 | 5.1% | 5.8% | 5.0% |
| $10,000 to $14,999 | 7.4% | 3.9% | 3.4% |
| $15,000 to $24,999 | 5.9% | 6.3% | 6.3% |
| $25,000 to $34,999 | 9.2% | 6.2% | 6.6% |
| $35,000 to $49,999 | 14.8% | 8.9% | 10.1% |
| $50,000 to $74,999 | 16.5% | 13.6% | 15.5% |
| $75,000 to $99,999 | 14.3% | 11.4% | 12.6% |
| $100,000 to $149,999 | 13.2% | 16.7% | 17.5% |
| $150,000 to $199,999 | 9.0% | 10.1% | 9.6% |
| $200,000 or more | 4.7% | 17.1% | 13.4% |
Source: U.S. Census ACS 5-year estimates (2024)


