Patchogue SnackAbility
Overall SnackAbility
Cost of living in Patchogue summary. We use data on the cost of living to determine how expensive it is to live in Patchogue. Real estate prices drive most of the variance in cost of living around New York. Key points include:
The cost of living in Patchogue is 132 with 100 being average.
The cost of living in Patchogue is 1.3x higher than the national average.
The median home value in Patchogue is $586,012.
The median income in Patchogue is $107,306.
Patchogue's Overall Cost Of Living
Higher Than The National Average
Cost Of Living In Patchogue Comparison Table
| Living Expense | Patchogue | New York | National Average |
|---|---|---|---|
| Overall | 132 | 121 | 100 |
| Services | 103 | 105 | 100 |
| Groceries | 107 | 108 | 100 |
| Health | 182 | 143 | 100 |
| Housing | 110 | 112 | 100 |
| Transportation | 113 | 114 | 100 |
| Utilities | 112 | 111 | 100 |
Source: Cost of living index, normalized to US average = 100
Patchogue, NY Weather
The average high in Patchogue is 60.6° and the average low is 44.0°.
There are 77.1 days of precipitation each year.
Expect an average of 47.8 inches of precipitation each year with 27.2 inches of snow.
| Stat | Patchogue |
|---|---|
| Average Annual High | 60.6 |
| Average Annual Low | 44.0 |
| Annual Precipitation Days | 77.1 |
| Average Annual Precipitation | 47.8 |
| Average Annual Snowfall | 27.2 |
Average High
Days of Rain
Source: NOAA climate normals (30-year)
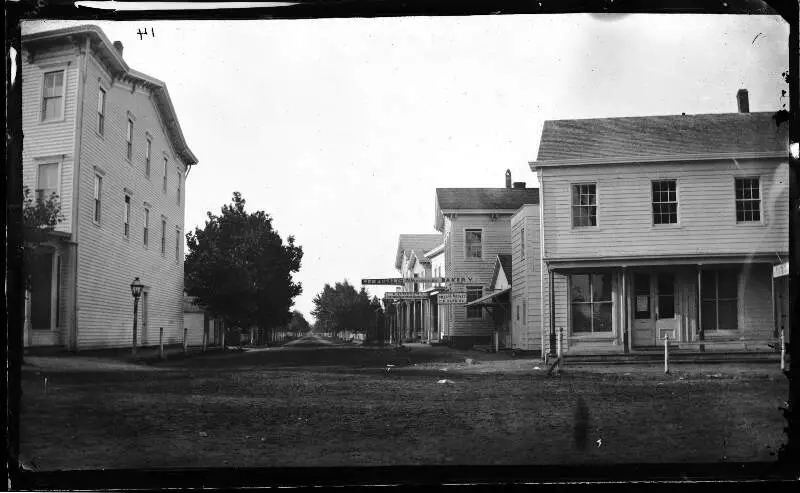
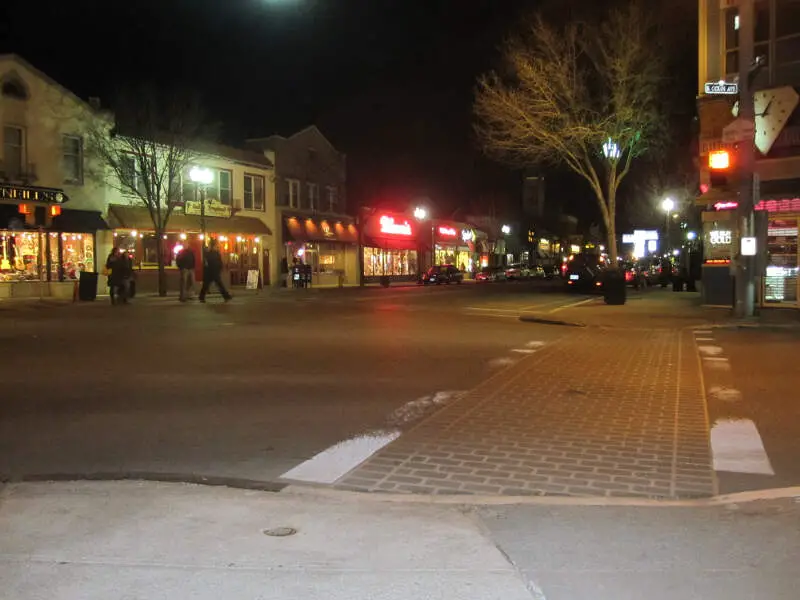
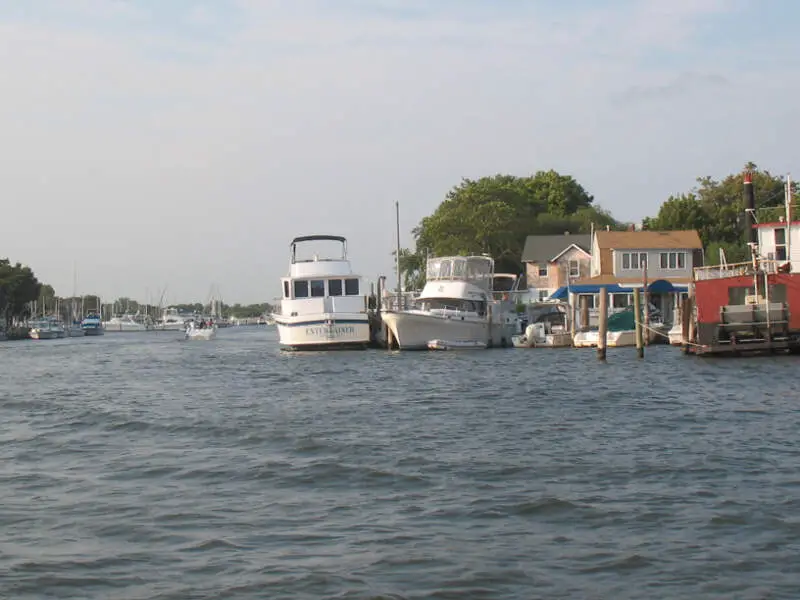
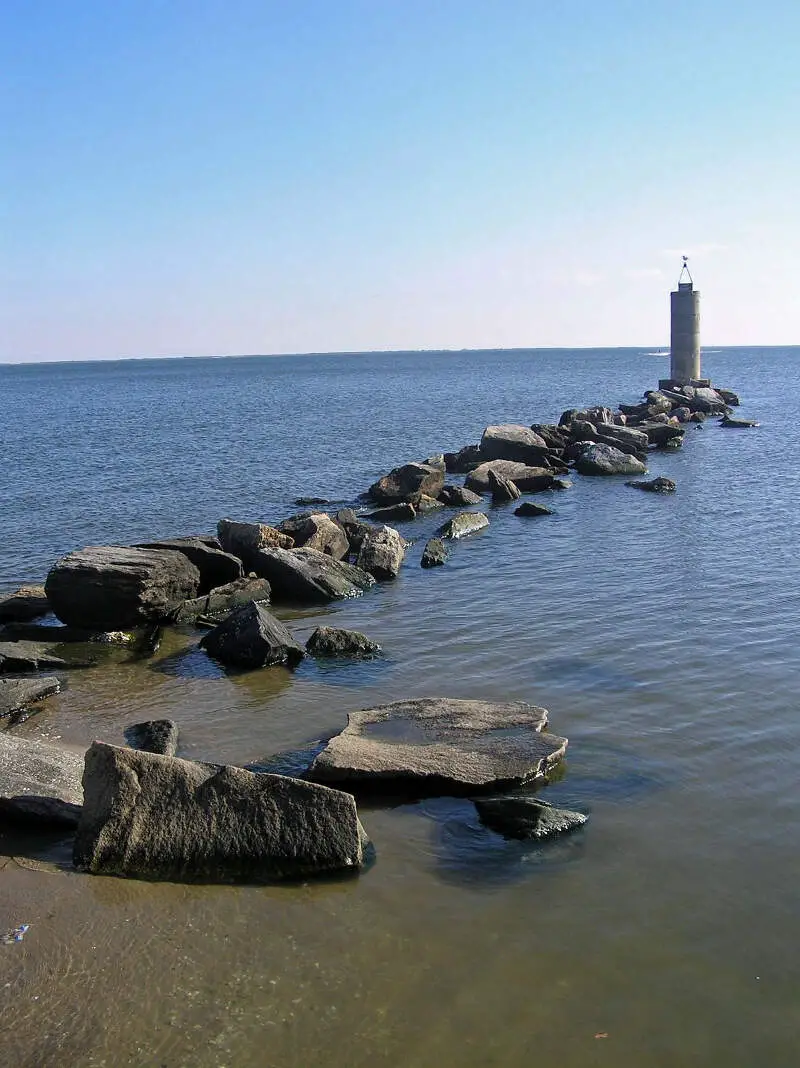
Patchogue, NY Photos


Rankings & Articles For Patchogue


Locations Around Patchogue
Map Of Patchogue, NY
Best Places Around Patchogue
Commack, NY
Population 36,558
Stony Brook, NY
Population 12,868
East Shoreham, NY
Population 7,321
West Islip, NY
Population 26,865
Northport, NY
Population 7,322
Smithtown, NY
Population 24,375
East Islip, NY
Population 13,573
Nesconset, NY
Population 13,833
Lake Grove, NY
Population 11,061
St. James, NY
Population 13,244
Patchogue Demographics And Statistics
Population over time in Patchogue
The current population in Patchogue is 12,396. The population has increased 4.7% from 2010.
| Year | Population | % Change |
|---|---|---|
| 2024 | 12,396 | 0.2% |
| 2023 | 12,368 | 0.2% |
| 2022 | 12,343 | 0.0% |
| 2021 | 12,341 | -0.4% |
| 2020 | 12,389 | 0.0% |
| 2019 | 12,384 | -0.1% |
| 2018 | 12,398 | -0.2% |
| 2017 | 12,425 | 1.1% |
| 2016 | 12,293 | 1.0% |
| 2015 | 12,173 | 1.1% |
| 2014 | 12,045 | 1.2% |
| 2013 | 11,902 | 0.6% |
| 2012 | 11,831 | 0.0% |
| 2011 | 11,826 | -0.1% |
| 2010 | 11,836 | - |
Race / Ethnicity in Patchogue
See the full breakdown
Patchogue is:
62.9% White with 7,796 White residents.
6.5% African American with 810 African American residents.
0.0% American Indian with 0 American Indian residents.
4.1% Asian with 514 Asian residents.
0.0% Hawaiian with 0 Hawaiian residents.
0.8% Other with 100 Other residents.
3.3% Two Or More with 412 Two Or More residents.
22.3% Hispanic with 2,764 Hispanic residents.
| Race | Patchogue | NY | USA |
|---|---|---|---|
| White | 62.9% | 52.8% | 57.4% |
| African American | 6.5% | 13.4% | 11.9% |
| American Indian | 0.0% | 0.2% | 0.5% |
| Asian | 4.1% | 9.0% | 5.9% |
| Hawaiian | 0.0% | 0.0% | 0.2% |
| Other | 0.8% | 1.0% | 0.6% |
| Two Or More | 3.3% | 3.8% | 4.3% |
| Hispanic | 22.3% | 19.8% | 19.3% |
Gender in Patchogue
See the full breakdown
Patchogue is 48.8% female with 6,054 female residents.
Patchogue is 51.2% male with 6,341 male residents.
| Gender | Patchogue | NY | USA |
|---|---|---|---|
| Female | 48.8% | 51.2% | 50.5% |
| Male | 51.2% | 48.8% | 49.5% |
Highest level of educational attainment in Patchogue for adults over 25
See the full breakdown
7.0% of adults in Patchogue completed < 9th grade.
5.0% of adults in Patchogue completed 9-12th grade.
20.0% of adults in Patchogue completed high school / ged.
21.0% of adults in Patchogue completed some college.
12.0% of adults in Patchogue completed associate's degree.
18.0% of adults in Patchogue completed bachelor's degree.
12.0% of adults in Patchogue completed master's degree.
3.0% of adults in Patchogue completed professional degree.
2.0% of adults in Patchogue completed doctorate degree.
| Education | Patchogue | NY | USA |
|---|---|---|---|
| < 9th Grade | 7.0% | 6.0% | 4.0% |
| 9-12th Grade | 5.0% | 6.0% | 6.0% |
| High School / GED | 20.0% | 24.0% | 26.0% |
| Some College | 21.0% | 15.0% | 19.0% |
| Associate's Degree | 12.0% | 9.0% | 9.0% |
| Bachelor's Degree | 18.0% | 22.0% | 22.0% |
| Master's Degree | 12.0% | 13.0% | 10.0% |
| Professional Degree | 3.0% | 3.0% | 2.0% |
| Doctorate Degree | 2.0% | 2.0% | 2.0% |
Household Income For Patchogue, New York
See the full breakdown
2.6% of households in Patchogue earn Less than $10,000.
5.4% of households in Patchogue earn $10,000 to $14,999.
8.9% of households in Patchogue earn $15,000 to $24,999.
2.9% of households in Patchogue earn $25,000 to $34,999.
4.1% of households in Patchogue earn $35,000 to $49,999.
12.8% of households in Patchogue earn $50,000 to $74,999.
9.0% of households in Patchogue earn $75,000 to $99,999.
25.0% of households in Patchogue earn $100,000 to $149,999.
10.6% of households in Patchogue earn $150,000 to $199,999.
18.7% of households in Patchogue earn $200,000 or more.
| Income | Patchogue | NY | USA |
|---|---|---|---|
| Less than $10,000 | 2.6% | 5.8% | 5.0% |
| $10,000 to $14,999 | 5.4% | 3.9% | 3.4% |
| $15,000 to $24,999 | 8.9% | 6.3% | 6.3% |
| $25,000 to $34,999 | 2.9% | 6.2% | 6.6% |
| $35,000 to $49,999 | 4.1% | 8.9% | 10.1% |
| $50,000 to $74,999 | 12.8% | 13.6% | 15.5% |
| $75,000 to $99,999 | 9.0% | 11.4% | 12.6% |
| $100,000 to $149,999 | 25.0% | 16.7% | 17.5% |
| $150,000 to $199,999 | 10.6% | 10.1% | 9.6% |
| $200,000 or more | 18.7% | 17.1% | 13.4% |
Source: U.S. Census ACS 5-year estimates (2024)


