Rochester SnackAbility
Overall SnackAbility
Crime in Rochester summary. We use data from the FBI to determine the crime rates in Rochester. Key points include:
There were 7,979 total crimes in Rochester in the last reporting year.
The overall crime rate per 100,000 people in Rochester is 3,871.6 / 100k people.
The violent crime rate per 100,000 people in Rochester is 582.3 / 100k people.
The property crime rate per 100,000 people in Rochester is 3,289.3 / 100k people.
Overall, crime in Rochester is 82.69% above the national average.
Total Crimes
Above National Average
Crime In Rochester Comparison Table
| Statistic | Count Raw |
Rochester / 100k People |
New York / 100k People |
National / 100k People |
|---|---|---|---|---|
| Total Crimes Per 100K | 7,979 | 3,871.6 | 2,099.7 | 2,119.2 |
| Violent Crime | 1,200 | 582.3 | 380.2 | 359.0 |
| Murder | 27 | 13.1 | 2.7 | 5.0 |
| Robbery | 316 | 153.3 | 96.1 | 61.0 |
| Aggravated Assault | 819 | 397.4 | 259.6 | 256.0 |
| Property Crime | 6,779 | 3,289.3 | 1,719.5 | 1,760.0 |
| Burglary | 834 | 404.7 | 136.6 | 229.0 |
| Larceny | 3,701 | 1,795.8 | 1,432.8 | 1,272.0 |
| Car Theft | 2,244 | 1,088.8 | 150.2 | 259.0 |
Source: FBI Uniform Crime Reporting (2024)
Cost of living in Rochester summary. We use data on the cost of living to determine how expensive it is to live in Rochester. Real estate prices drive most of the variance in cost of living around New York. Key points include:
The cost of living in Rochester is 97 with 100 being average.
The cost of living in Rochester is 1.0x lower than the national average.
The median home value in Rochester is $235,783.
The median income in Rochester is $47,213.
Rochester's Overall Cost Of Living
Lower Than The National Average
Cost Of Living In Rochester Comparison Table
| Living Expense | Rochester | New York | National Average |
|---|---|---|---|
| Overall | 97 | 121 | 100 |
| Services | 109 | 105 | 100 |
| Groceries | 113 | 108 | 100 |
| Health | 62 | 143 | 100 |
| Housing | 113 | 112 | 100 |
| Transportation | 111 | 114 | 100 |
| Utilities | 111 | 111 | 100 |
Source: Cost of living index, normalized to US average = 100
Rochester, NY Weather
The average high in Rochester is 57.4° and the average low is 39.6°.
There are 81.4 days of precipitation each year.
Expect an average of 34.0 inches of precipitation each year with 85.0 inches of snow.
| Stat | Rochester |
|---|---|
| Average Annual High | 57.4 |
| Average Annual Low | 39.6 |
| Annual Precipitation Days | 81.4 |
| Average Annual Precipitation | 34.0 |
| Average Annual Snowfall | 85.0 |
Average High
Days of Rain
Source: NOAA climate normals (30-year)
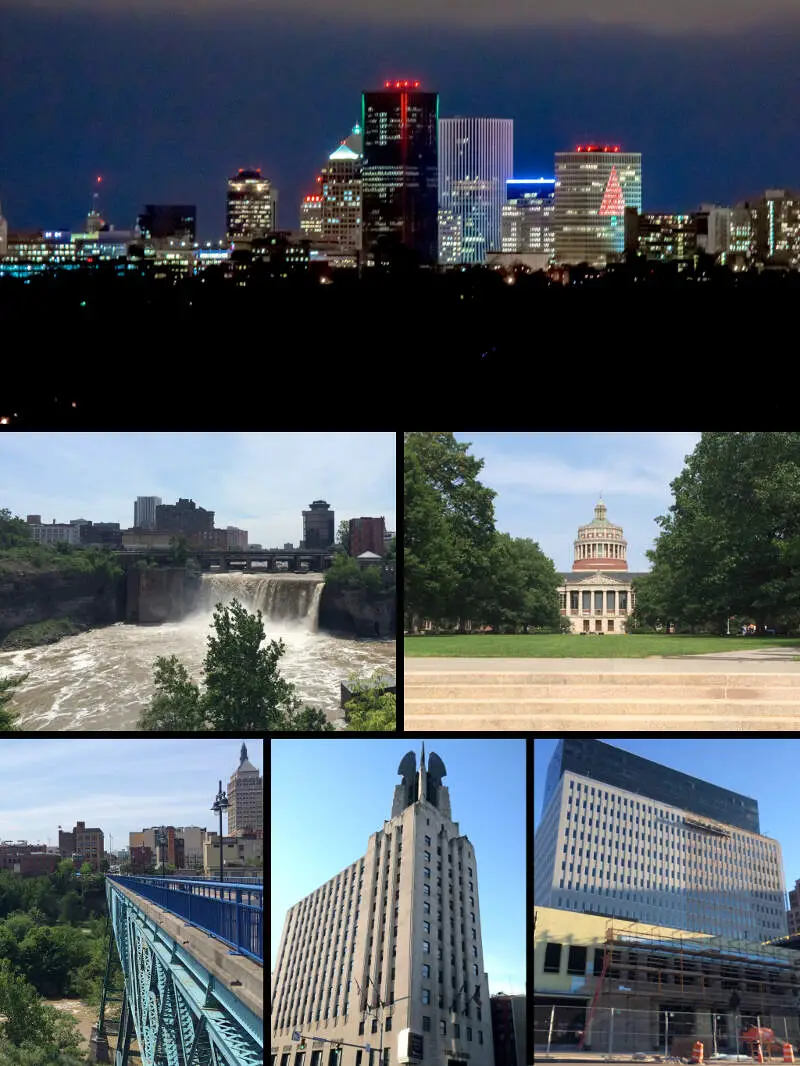
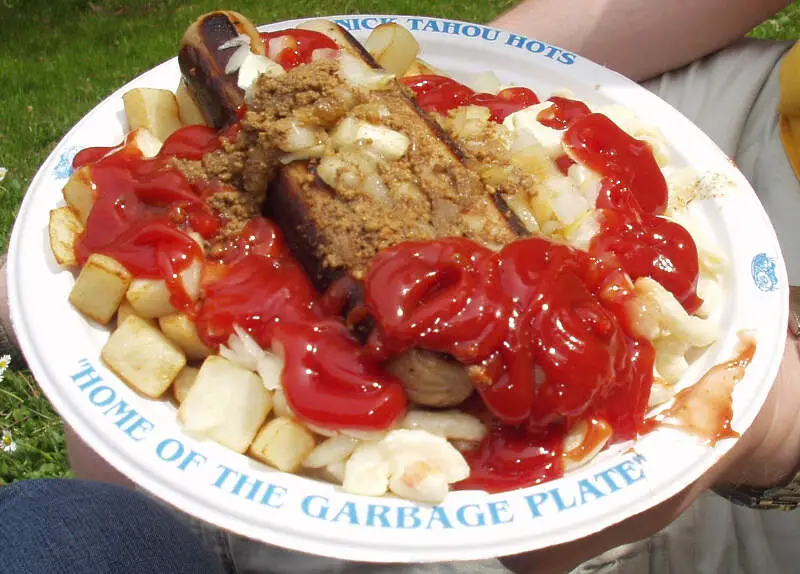
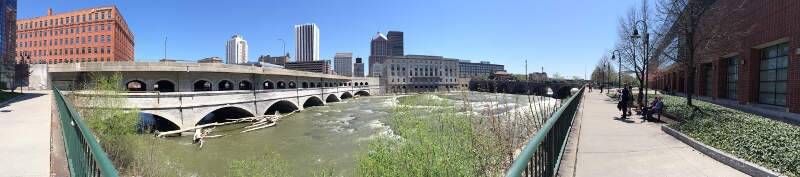
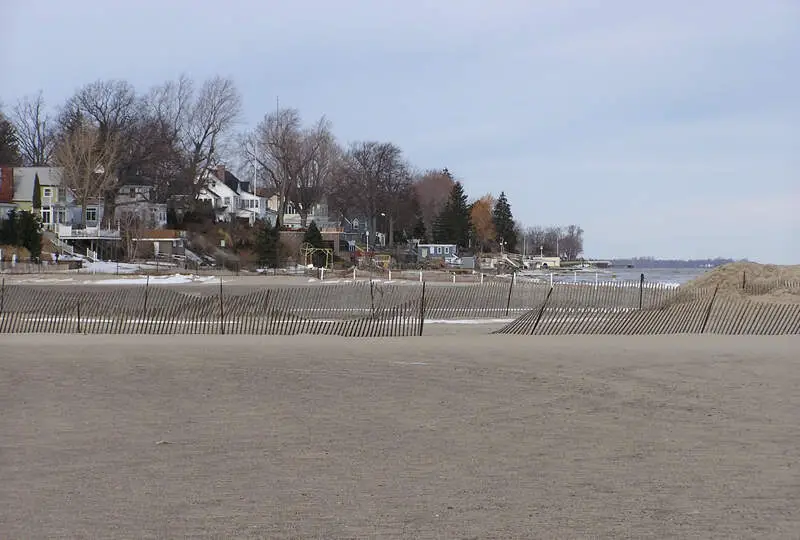
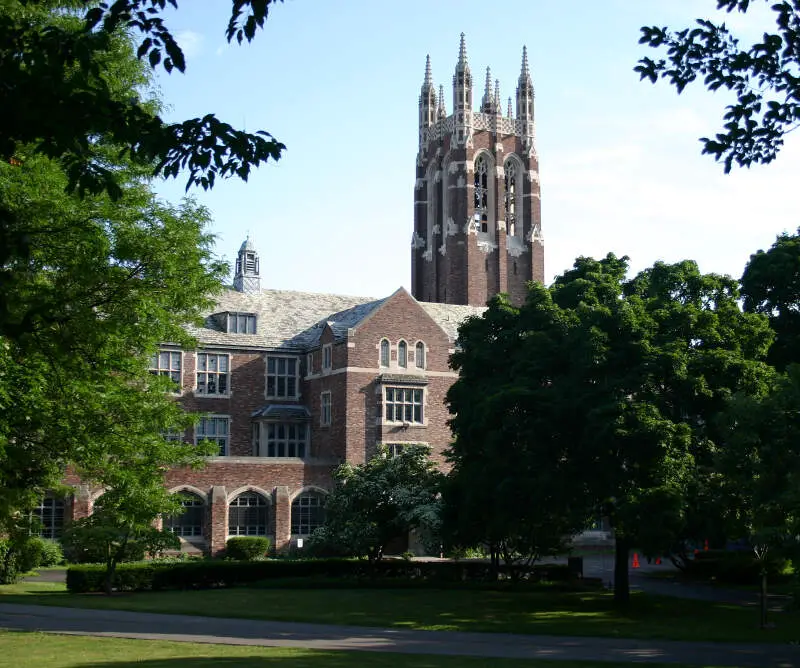
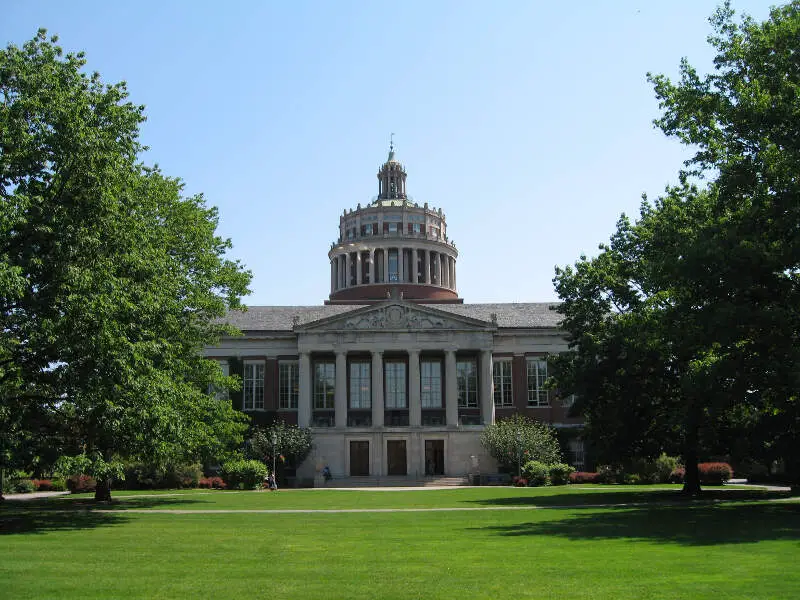
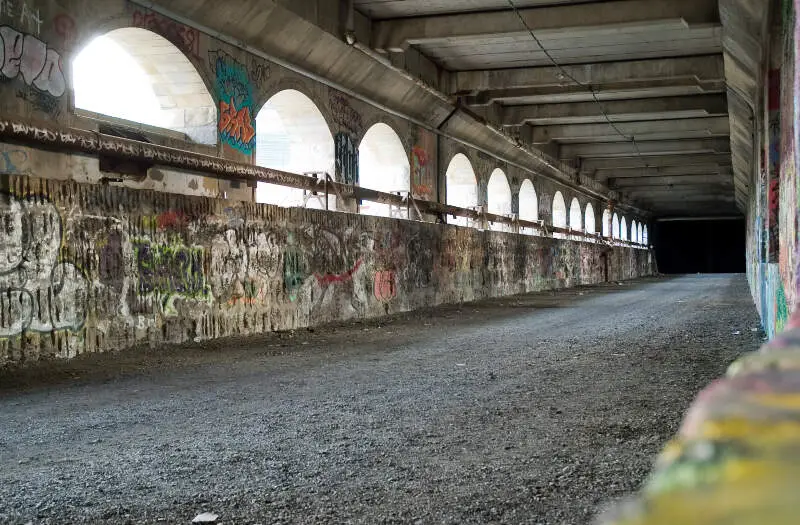
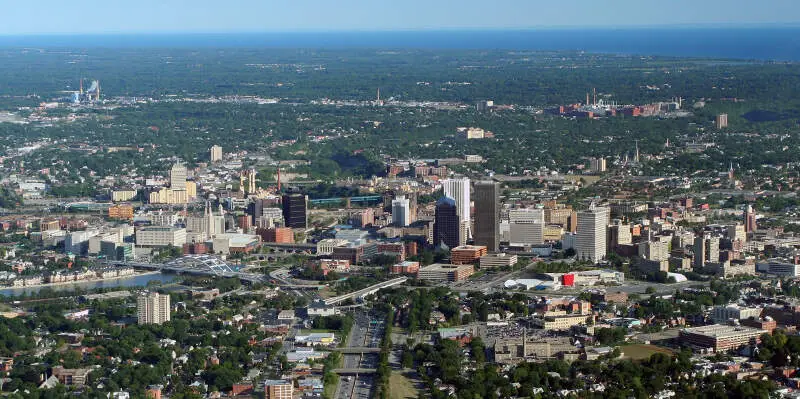
Rochester, NY Photos

6 Reviews & Comments About Rochester

"Rochester CAN definitely be a bad place to live for some people, but Rochester is my home.. I've lived here my entire life and so has my father and his father after he migrated here from Sicily..
Rochester has a huge underground music scene, many venues and even bars with stages that are based around music..
and the community factor in Rochester is amazing.. we have a lot of love for our communities and family.. and sometimes those two are one in the same..
Rochester NY. west side. child st.
not a place for the weak.. this city will make or break you.. sometimes both.. but struggle builds character. and that's one thing we have here. character."
Yo I live in Rochester we packing out here with are stats
I was born in Rochester NY i think its going down hill
Bro I live in Rochester wtf buh it's not even that bad
Haha I live in Rochester and I can't wait to leave
I may not live in Rochester any more, but it will always be home!
Rankings & Articles For Rochester


Locations Around Rochester
Map Of Rochester, NY
Best Places Around Rochester
Brighton, NY
Population 36,834
Fairport, NY
Population 5,403
Webster, NY
Population 5,718
Hilton, NY
Population 5,968
East Rochester, NY
Population 6,218
Greece, NY
Population 13,943
Hamlin, NY
Population 4,987
Hamlin, NY
Population 4,987
Rochester Demographics And Statistics
Population over time in Rochester
The current population in Rochester is 208,772. The population has decreased 1.5% from 2010.
| Year | Population | % Change |
|---|---|---|
| 2024 | 208,772 | -0.5% |
| 2023 | 209,720 | -0.6% |
| 2022 | 210,992 | -0.1% |
| 2021 | 211,100 | 2.3% |
| 2020 | 206,357 | -0.2% |
| 2019 | 206,848 | -0.4% |
| 2018 | 207,778 | -0.8% |
| 2017 | 209,463 | -0.4% |
| 2016 | 210,291 | -0.2% |
| 2015 | 210,745 | 0.1% |
| 2014 | 210,461 | -0.1% |
| 2013 | 210,624 | -0.2% |
| 2012 | 210,967 | -0.2% |
| 2011 | 211,457 | -0.2% |
| 2010 | 211,977 | - |
Race / Ethnicity in Rochester
See the full breakdown
Rochester is:
36.4% White with 75,975 White residents.
34.7% African American with 72,342 African American residents.
0.2% American Indian with 337 American Indian residents.
3.2% Asian with 6,675 Asian residents.
0.0% Hawaiian with 35 Hawaiian residents.
0.6% Other with 1,294 Other residents.
5.3% Two Or More with 11,117 Two Or More residents.
19.6% Hispanic with 40,997 Hispanic residents.
| Race | Rochester | NY | USA |
|---|---|---|---|
| White | 36.4% | 52.8% | 57.4% |
| African American | 34.7% | 13.4% | 11.9% |
| American Indian | 0.2% | 0.2% | 0.5% |
| Asian | 3.2% | 9.0% | 5.9% |
| Hawaiian | 0.0% | 0.0% | 0.2% |
| Other | 0.6% | 1.0% | 0.6% |
| Two Or More | 5.3% | 3.8% | 4.3% |
| Hispanic | 19.6% | 19.8% | 19.3% |
Gender in Rochester
See the full breakdown
Rochester is 52.4% female with 109,361 female residents.
Rochester is 47.6% male with 99,411 male residents.
| Gender | Rochester | NY | USA |
|---|---|---|---|
| Female | 52.4% | 51.2% | 50.5% |
| Male | 47.6% | 48.8% | 49.5% |
Highest level of educational attainment in Rochester for adults over 25
See the full breakdown
6.0% of adults in Rochester completed < 9th grade.
10.0% of adults in Rochester completed 9-12th grade.
28.0% of adults in Rochester completed high school / ged.
16.0% of adults in Rochester completed some college.
10.0% of adults in Rochester completed associate's degree.
17.0% of adults in Rochester completed bachelor's degree.
9.0% of adults in Rochester completed master's degree.
2.0% of adults in Rochester completed professional degree.
2.0% of adults in Rochester completed doctorate degree.
| Education | Rochester | NY | USA |
|---|---|---|---|
| < 9th Grade | 6.0% | 6.0% | 4.0% |
| 9-12th Grade | 10.0% | 6.0% | 6.0% |
| High School / GED | 28.0% | 24.0% | 26.0% |
| Some College | 16.0% | 15.0% | 19.0% |
| Associate's Degree | 10.0% | 9.0% | 9.0% |
| Bachelor's Degree | 17.0% | 22.0% | 22.0% |
| Master's Degree | 9.0% | 13.0% | 10.0% |
| Professional Degree | 2.0% | 3.0% | 2.0% |
| Doctorate Degree | 2.0% | 2.0% | 2.0% |
Household Income For Rochester, New York
See the full breakdown
8.9% of households in Rochester earn Less than $10,000.
8.1% of households in Rochester earn $10,000 to $14,999.
11.7% of households in Rochester earn $15,000 to $24,999.
10.7% of households in Rochester earn $25,000 to $34,999.
13.1% of households in Rochester earn $35,000 to $49,999.
16.4% of households in Rochester earn $50,000 to $74,999.
11.3% of households in Rochester earn $75,000 to $99,999.
9.9% of households in Rochester earn $100,000 to $149,999.
5.1% of households in Rochester earn $150,000 to $199,999.
4.9% of households in Rochester earn $200,000 or more.
| Income | Rochester | NY | USA |
|---|---|---|---|
| Less than $10,000 | 8.9% | 5.8% | 5.0% |
| $10,000 to $14,999 | 8.1% | 3.9% | 3.4% |
| $15,000 to $24,999 | 11.7% | 6.3% | 6.3% |
| $25,000 to $34,999 | 10.7% | 6.2% | 6.6% |
| $35,000 to $49,999 | 13.1% | 8.9% | 10.1% |
| $50,000 to $74,999 | 16.4% | 13.6% | 15.5% |
| $75,000 to $99,999 | 11.3% | 11.4% | 12.6% |
| $100,000 to $149,999 | 9.9% | 16.7% | 17.5% |
| $150,000 to $199,999 | 5.1% | 10.1% | 9.6% |
| $200,000 or more | 4.9% | 17.1% | 13.4% |
Source: U.S. Census ACS 5-year estimates (2024)


