Coweta, OK
Demographics And Statistics
Living In Coweta, Oklahoma Summary
Life in Coweta research summary. HomeSnacks has been using Saturday Night Science to research the quality of life in Coweta over the past nine years using Census, FBI, Zillow, and other primary data sources. Based on the most recently available data, we found the following about life in Coweta:
The population in Coweta is 10,157.
The median home value in Coweta is $267,896.
The median income in Coweta is $60,000.
The cost of living in Coweta is 88 which is 0.9x lower than the national average.
The median rent in Coweta is $959.
The unemployment rate in Coweta is 4.9%.
The poverty rate in Coweta is 12.0%.
The average high in Coweta is 71.2° and the average low is 49.3°.
Coweta SnackAbility
Overall SnackAbility
Coweta, OK Crime Report
Crime in Coweta summary. We use data from the FBI to determine the crime rates in Coweta. Key points include:
There were 81 total crimes in Coweta in the last reporting year.
The overall crime rate per 100,000 people in Coweta is 725.2 / 100k people.
The violent crime rate per 100,000 people in Coweta is 152.2 / 100k people.
The property crime rate per 100,000 people in Coweta is 573.0 / 100k people.
Overall, crime in Coweta is -65.78% below the national average.
Total Crimes
Below National Average
Crime In Coweta Comparison Table
| Statistic | Count Raw |
Coweta / 100k People |
Oklahoma / 100k People |
National / 100k People |
|---|---|---|---|---|
| Total Crimes Per 100K | 81 | 725.2 | 2,400.6 | 2,119.2 |
| Violent Crime | 17 | 152.2 | 422.8 | 359.0 |
| Murder | 0 | 0.0 | 6.3 | 5.0 |
| Robbery | 1 | 9.0 | 38.2 | 61.0 |
| Aggravated Assault | 12 | 107.4 | 318.7 | 256.0 |
| Property Crime | 64 | 573.0 | 1,977.7 | 1,760.0 |
| Burglary | 12 | 107.4 | 411.4 | 229.0 |
| Larceny | 42 | 376.0 | 1,343.7 | 1,272.0 |
| Car Theft | 10 | 89.5 | 222.6 | 259.0 |
Coweta, OK Cost Of Living
Cost of living in Coweta summary. We use data on the cost of living to determine how expensive it is to live in Coweta. Real estate prices drive most of the variance in cost of living around Oklahoma. Key points include:
The cost of living in Coweta is 88 with 100 being average.
The cost of living in Coweta is 0.9x lower than the national average.
The median home value in Coweta is $267,896.
The median income in Coweta is $60,000.
Coweta's Overall Cost Of Living
Lower Than The National Average
Cost Of Living In Coweta Comparison Table
| Living Expense | Coweta | Oklahoma | National Average | |
|---|---|---|---|---|
| Overall | 88 | 87 | 100 | |
| Services | 94 | 90 | 100 | |
| Groceries | 94 | 96 | 100 | |
| Health | 92 | 94 | 100 | |
| Housing | 80 | 70 | 100 | |
| Transportation | 88 | 93 | 100 | |
| Utilities | 97 | 98 | 100 | |
Coweta, OK Weather
The average high in Coweta is 71.2° and the average low is 49.3°.
There are 60.8 days of precipitation each year.
Expect an average of 43.1 inches of precipitation each year with 4.1 inches of snow.
| Stat | Coweta |
|---|---|
| Average Annual High | 71.2 |
| Average Annual Low | 49.3 |
| Annual Precipitation Days | 60.8 |
| Average Annual Precipitation | 43.1 |
| Average Annual Snowfall | 4.1 |
Average High
Days of Rain
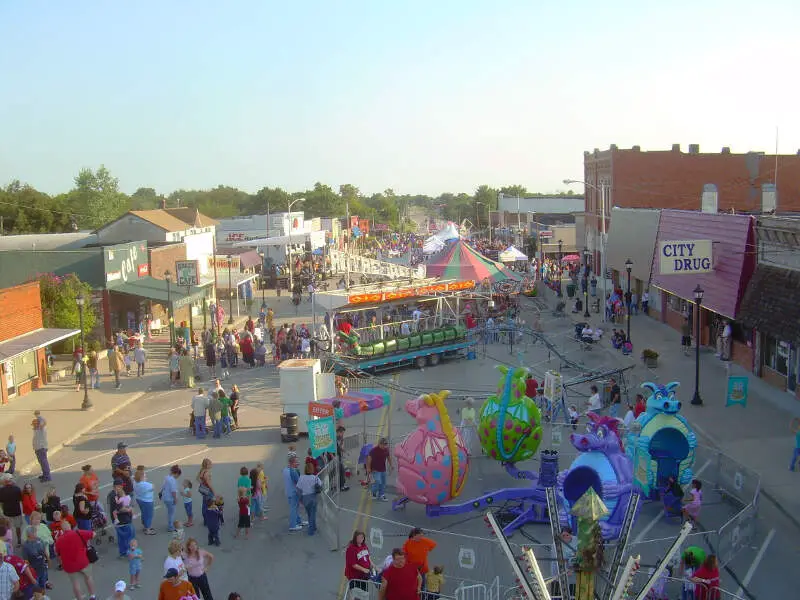
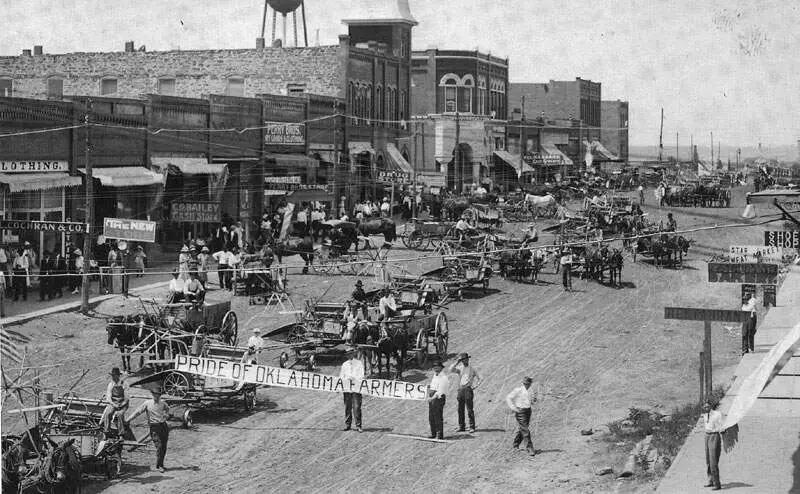
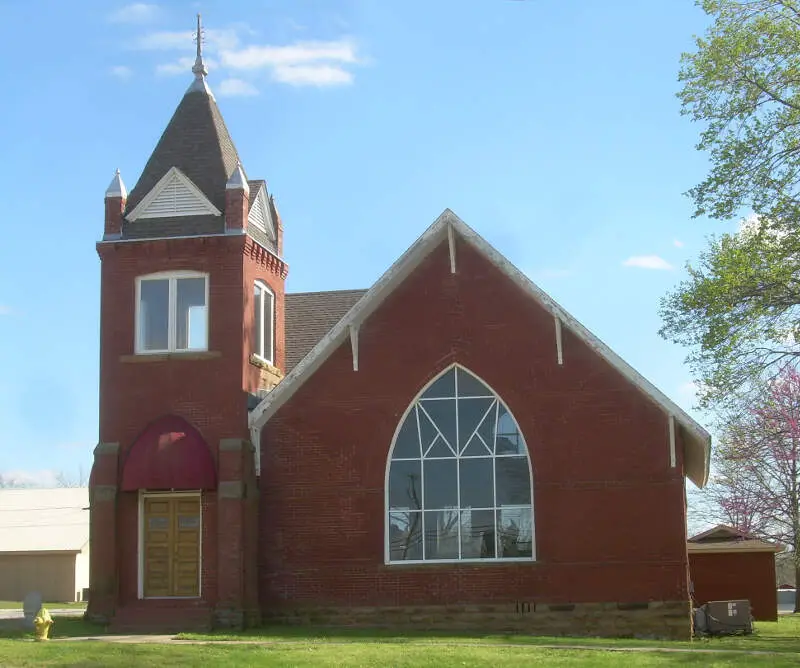
Coweta, OK Photos
Rankings for Coweta in Oklahoma


Locations Around Coweta
Map Of Coweta, OK
Best Places Around Coweta
Broken Arrow, OK
Population 115,919
Jenks, OK
Population 26,519
Bixby, OK
Population 29,402
Glenpool, OK
Population 13,885
Catoosa, OK
Population 7,631
Tulsa, OK
Population 412,322
Wagoner, OK
Population 7,934
Coweta Demographics And Statistics
Population over time in Coweta
The current population in Coweta is 10,157. The population has increased 6.6% from 2010.
| Year | Population | % Change |
|---|---|---|
| 2023 | 10,157 | 2.6% |
| 2022 | 9,903 | 2.1% |
| 2021 | 9,696 | -1.1% |
| 2020 | 9,803 | 0.7% |
| 2019 | 9,739 | 1.1% |
| 2018 | 9,637 | 0.9% |
| 2017 | 9,549 | -0.2% |
| 2016 | 9,572 | 0.6% |
| 2015 | 9,517 | 0.4% |
| 2014 | 9,483 | -0.7% |
| 2013 | 9,549 | -0.1% |
| 2012 | 9,555 | 0.5% |
| 2011 | 9,510 | -0.1% |
| 2010 | 9,524 | - |
Race / Ethnicity in Coweta
Coweta is:
68.2% White with 6,924 White residents.
5.2% African American with 528 African American residents.
7.8% American Indian with 788 American Indian residents.
0.2% Asian with 23 Asian residents.
0.0% Hawaiian with 0 Hawaiian residents.
0.2% Other with 23 Other residents.
12.9% Two Or More with 1,308 Two Or More residents.
5.5% Hispanic with 563 Hispanic residents.
| Race | Coweta | OK | USA |
|---|---|---|---|
| White | 68.2% | 62.8% | 58.2% |
| African American | 5.2% | 6.9% | 12.0% |
| American Indian | 7.8% | 6.8% | 0.5% |
| Asian | 0.2% | 2.3% | 5.7% |
| Hawaiian | 0.0% | 0.2% | 0.2% |
| Other | 0.2% | 0.3% | 0.5% |
| Two Or More | 12.9% | 8.5% | 3.9% |
| Hispanic | 5.5% | 12.3% | 19.0% |
Gender in Coweta
Coweta is 48.6% female with 4,939 female residents.
Coweta is 51.4% male with 5,218 male residents.
| Gender | Coweta | OK | USA |
|---|---|---|---|
| Female | 48.6% | 50.2% | 50.5% |
| Male | 51.4% | 49.8% | 49.5% |
Highest level of educational attainment in Coweta for adults over 25
1.0% of adults in Coweta completed < 9th grade.
7.0% of adults in Coweta completed 9-12th grade.
32.0% of adults in Coweta completed high school / ged.
25.0% of adults in Coweta completed some college.
10.0% of adults in Coweta completed associate's degree.
17.0% of adults in Coweta completed bachelor's degree.
7.0% of adults in Coweta completed master's degree.
0.0% of adults in Coweta completed professional degree.
1.0% of adults in Coweta completed doctorate degree.
| Education | Coweta | OK | USA |
|---|---|---|---|
| < 9th Grade | 1.0% | 4.0% | 5.0% |
| 9-12th Grade | 7.0% | 7.0% | 6.0% |
| High School / GED | 32.0% | 31.0% | 26.0% |
| Some College | 25.0% | 22.0% | 19.0% |
| Associate's Degree | 10.0% | 8.0% | 9.0% |
| Bachelor's Degree | 17.0% | 18.0% | 21.0% |
| Master's Degree | 7.0% | 7.0% | 10.0% |
| Professional Degree | 0.0% | 2.0% | 2.0% |
| Doctorate Degree | 1.0% | 1.0% | 2.0% |
Household Income For Coweta, Oklahoma
3.5% of households in Coweta earn Less than $10,000.
4.1% of households in Coweta earn $10,000 to $14,999.
11.3% of households in Coweta earn $15,000 to $24,999.
5.7% of households in Coweta earn $25,000 to $34,999.
12.7% of households in Coweta earn $35,000 to $49,999.
21.2% of households in Coweta earn $50,000 to $74,999.
13.1% of households in Coweta earn $75,000 to $99,999.
20.2% of households in Coweta earn $100,000 to $149,999.
4.9% of households in Coweta earn $150,000 to $199,999.
3.4% of households in Coweta earn $200,000 or more.
| Income | Coweta | OK | USA |
|---|---|---|---|
| Less than $10,000 | 3.5% | 5.7% | 4.9% |
| $10,000 to $14,999 | 4.1% | 4.3% | 3.6% |
| $15,000 to $24,999 | 11.3% | 8.0% | 6.6% |
| $25,000 to $34,999 | 5.7% | 8.9% | 6.8% |
| $35,000 to $49,999 | 12.7% | 12.6% | 10.4% |
| $50,000 to $74,999 | 21.2% | 18.0% | 15.7% |
| $75,000 to $99,999 | 13.1% | 13.0% | 12.7% |
| $100,000 to $149,999 | 20.2% | 15.8% | 17.4% |
| $150,000 to $199,999 | 4.9% | 7.0% | 9.3% |
| $200,000 or more | 3.4% | 6.9% | 12.6% |


