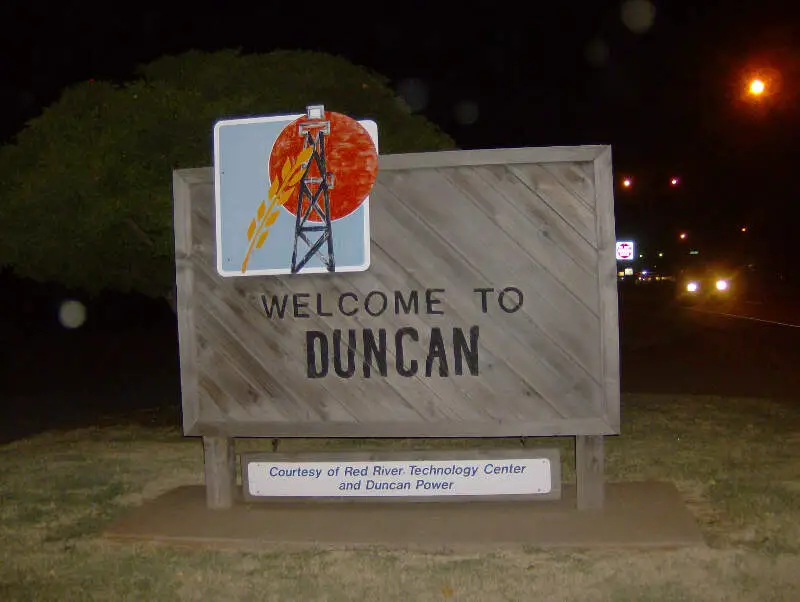
Duncan, OK
Demographics And Statistics
Living In Duncan, Oklahoma Summary
Life in Duncan research summary. HomeSnacks has been using Saturday Night Science to research the quality of life in Duncan over the past nine years using Census, FBI, Zillow, and other primary data sources. Based on the most recently available data, we found the following about life in Duncan:
The population in Duncan is 22,872.
The median home value in Duncan is $131,234.
The median income in Duncan is $57,020.
The cost of living in Duncan is 84 which is 0.8x lower than the national average.
The median rent in Duncan is $872.
The unemployment rate in Duncan is 6.1%.
The poverty rate in Duncan is 20.4%.
The average high in Duncan is 73.6° and the average low is 50.4°.
Duncan SnackAbility
Overall SnackAbility
Duncan, OK Crime Report
Crime in Duncan summary. We use data from the FBI to determine the crime rates in Duncan. Key points include:
There were 566 total crimes in Duncan in the last reporting year.
The overall crime rate per 100,000 people in Duncan is 2,424.5 / 100k people.
The violent crime rate per 100,000 people in Duncan is 351.3 / 100k people.
The property crime rate per 100,000 people in Duncan is 2,073.2 / 100k people.
Overall, crime in Duncan is 14.40% above the national average.
Total Crimes
Above National Average
Crime In Duncan Comparison Table
| Statistic | Count Raw |
Duncan / 100k People |
Oklahoma / 100k People |
National / 100k People |
|---|---|---|---|---|
| Total Crimes Per 100K | 566 | 2,424.5 | 2,400.6 | 2,119.2 |
| Violent Crime | 82 | 351.3 | 422.8 | 359.0 |
| Murder | 0 | 0.0 | 6.3 | 5.0 |
| Robbery | 4 | 17.1 | 38.2 | 61.0 |
| Aggravated Assault | 62 | 265.6 | 318.7 | 256.0 |
| Property Crime | 484 | 2,073.2 | 1,977.7 | 1,760.0 |
| Burglary | 91 | 389.8 | 411.4 | 229.0 |
| Larceny | 375 | 1,606.3 | 1,343.7 | 1,272.0 |
| Car Theft | 18 | 77.1 | 222.6 | 259.0 |
Duncan, OK Cost Of Living
Cost of living in Duncan summary. We use data on the cost of living to determine how expensive it is to live in Duncan. Real estate prices drive most of the variance in cost of living around Oklahoma. Key points include:
The cost of living in Duncan is 84 with 100 being average.
The cost of living in Duncan is 0.8x lower than the national average.
The median home value in Duncan is $131,234.
The median income in Duncan is $57,020.
Duncan's Overall Cost Of Living
Lower Than The National Average
Cost Of Living In Duncan Comparison Table
| Living Expense | Duncan | Oklahoma | National Average | |
|---|---|---|---|---|
| Overall | 84 | 87 | 100 | |
| Services | 92 | 90 | 100 | |
| Groceries | 96 | 96 | 100 | |
| Health | 99 | 94 | 100 | |
| Housing | 67 | 70 | 100 | |
| Transportation | 95 | 93 | 100 | |
| Utilities | 98 | 98 | 100 | |
Duncan, OK Weather
The average high in Duncan is 73.6° and the average low is 50.4°.
There are 53.0 days of precipitation each year.
Expect an average of 36.3 inches of precipitation each year with 3.5 inches of snow.
| Stat | Duncan |
|---|---|
| Average Annual High | 73.6 |
| Average Annual Low | 50.4 |
| Annual Precipitation Days | 53.0 |
| Average Annual Precipitation | 36.3 |
| Average Annual Snowfall | 3.5 |
Average High
Days of Rain
Duncan, OK Photos
1 Reviews & Comments About Duncan
/5

HomeSnacks User - 2019-04-13 03:19:39.318784
Crime is bad. Too many child molesters at least 1/5 women are molested or sexually abused here. No jobs that pay anything. If u don't have a college degree or some type of training you can't afford to feed your family. You can't go to college if you don't have daycare for kids because daycare is expensive. They don't offer health care for adults unless u make 900.00 a month or less, I mean who the heck can live off that-- The food prices are outrageous here eating healthy is very expensive here. There is absolutely nothing to do besides drugs and alcohol and fighting.
Watch out for child molesters hiding in churches here. Watch out for the police and sheriff departments here they are all dirty. I am speaking on behalf of family members who worked for law enforcement. Favorite thing about Duncan Oklahoma is the wide open space and the acres upon acres of cow filled farm land!! Love seeing the green planes.
Rankings for Duncan in Oklahoma


Locations Around Duncan
Map Of Duncan, OK
Best Places Around Duncan
Burkburnett, TX
Population 11,012
Blanchard, OK
Population 9,276
Lone Grove, OK
Population 5,070
Marlow, OK
Population 4,423
Lawton, OK
Population 90,662
Pauls Valley, OK
Population 6,031
Anadarko, OK
Population 5,627
Chickasha, OK
Population 16,349
Duncan Demographics And Statistics
Population over time in Duncan
The current population in Duncan is 22,872. The population has decreased -1.2% from 2010.
| Year | Population | % Change |
|---|---|---|
| 2023 | 22,872 | 0.5% |
| 2022 | 22,759 | 0.4% |
| 2021 | 22,664 | 0.6% |
| 2020 | 22,529 | -0.4% |
| 2019 | 22,618 | -0.9% |
| 2018 | 22,823 | -0.8% |
| 2017 | 22,998 | -1.0% |
| 2016 | 23,240 | -0.3% |
| 2015 | 23,317 | -0.2% |
| 2014 | 23,364 | -0.0% |
| 2013 | 23,373 | 0.2% |
| 2012 | 23,332 | 0.1% |
| 2011 | 23,300 | 0.6% |
| 2010 | 23,157 | - |
Race / Ethnicity in Duncan
Duncan is:
74.7% White with 17,096 White residents.
2.3% African American with 517 African American residents.
3.1% American Indian with 712 American Indian residents.
0.5% Asian with 110 Asian residents.
0.0% Hawaiian with 10 Hawaiian residents.
0.3% Other with 79 Other residents.
8.1% Two Or More with 1,856 Two Or More residents.
10.9% Hispanic with 2,492 Hispanic residents.
| Race | Duncan | OK | USA |
|---|---|---|---|
| White | 74.7% | 62.8% | 58.2% |
| African American | 2.3% | 6.9% | 12.0% |
| American Indian | 3.1% | 6.8% | 0.5% |
| Asian | 0.5% | 2.3% | 5.7% |
| Hawaiian | 0.0% | 0.2% | 0.2% |
| Other | 0.3% | 0.3% | 0.5% |
| Two Or More | 8.1% | 8.5% | 3.9% |
| Hispanic | 10.9% | 12.3% | 19.0% |
Gender in Duncan
Duncan is 51.4% female with 11,754 female residents.
Duncan is 48.6% male with 11,117 male residents.
| Gender | Duncan | OK | USA |
|---|---|---|---|
| Female | 51.4% | 50.2% | 50.5% |
| Male | 48.6% | 49.8% | 49.5% |
Highest level of educational attainment in Duncan for adults over 25
4.0% of adults in Duncan completed < 9th grade.
10.0% of adults in Duncan completed 9-12th grade.
39.0% of adults in Duncan completed high school / ged.
23.0% of adults in Duncan completed some college.
5.0% of adults in Duncan completed associate's degree.
12.0% of adults in Duncan completed bachelor's degree.
6.0% of adults in Duncan completed master's degree.
1.0% of adults in Duncan completed professional degree.
0.0% of adults in Duncan completed doctorate degree.
| Education | Duncan | OK | USA |
|---|---|---|---|
| < 9th Grade | 4.0% | 4.0% | 5.0% |
| 9-12th Grade | 10.0% | 7.0% | 6.0% |
| High School / GED | 39.0% | 31.0% | 26.0% |
| Some College | 23.0% | 22.0% | 19.0% |
| Associate's Degree | 5.0% | 8.0% | 9.0% |
| Bachelor's Degree | 12.0% | 18.0% | 21.0% |
| Master's Degree | 6.0% | 7.0% | 10.0% |
| Professional Degree | 1.0% | 2.0% | 2.0% |
| Doctorate Degree | 0.0% | 1.0% | 2.0% |
Household Income For Duncan, Oklahoma
8.0% of households in Duncan earn Less than $10,000.
5.9% of households in Duncan earn $10,000 to $14,999.
8.5% of households in Duncan earn $15,000 to $24,999.
8.8% of households in Duncan earn $25,000 to $34,999.
13.1% of households in Duncan earn $35,000 to $49,999.
17.6% of households in Duncan earn $50,000 to $74,999.
14.4% of households in Duncan earn $75,000 to $99,999.
13.1% of households in Duncan earn $100,000 to $149,999.
5.6% of households in Duncan earn $150,000 to $199,999.
5.1% of households in Duncan earn $200,000 or more.
| Income | Duncan | OK | USA |
|---|---|---|---|
| Less than $10,000 | 8.0% | 5.7% | 4.9% |
| $10,000 to $14,999 | 5.9% | 4.3% | 3.6% |
| $15,000 to $24,999 | 8.5% | 8.0% | 6.6% |
| $25,000 to $34,999 | 8.8% | 8.9% | 6.8% |
| $35,000 to $49,999 | 13.1% | 12.6% | 10.4% |
| $50,000 to $74,999 | 17.6% | 18.0% | 15.7% |
| $75,000 to $99,999 | 14.4% | 13.0% | 12.7% |
| $100,000 to $149,999 | 13.1% | 15.8% | 17.4% |
| $150,000 to $199,999 | 5.6% | 7.0% | 9.3% |
| $200,000 or more | 5.1% | 6.9% | 12.6% |


