Florence SnackAbility
Overall SnackAbility
Crime in Florence summary. We use data from the FBI to determine the crime rates in Florence. Key points include:
There were 210 total crimes in Florence in the last reporting year.
The overall crime rate per 100,000 people in Florence is 2,218.0 / 100k people.
The violent crime rate per 100,000 people in Florence is 84.5 / 100k people.
The property crime rate per 100,000 people in Florence is 2,133.5 / 100k people.
Overall, crime in Florence is 4.66% above the national average.
Total Crimes
Above National Average
Crime In Florence Comparison Table
| Statistic | Count Raw |
Florence / 100k People |
Oregon / 100k People |
National / 100k People |
|---|---|---|---|---|
| Total Crimes Per 100K | 210 | 2,218.0 | 2,719.1 | 2,119.2 |
| Violent Crime | 8 | 84.5 | 331.0 | 359.0 |
| Murder | 0 | 0.0 | 3.7 | 5.0 |
| Robbery | 1 | 10.6 | 57.0 | 61.0 |
| Aggravated Assault | 4 | 42.2 | 229.1 | 256.0 |
| Property Crime | 202 | 2,133.5 | 2,388.0 | 1,760.0 |
| Burglary | 18 | 190.1 | 306.5 | 229.0 |
| Larceny | 174 | 1,837.8 | 1,789.5 | 1,272.0 |
| Car Theft | 10 | 105.6 | 292.1 | 259.0 |
Source: FBI Uniform Crime Reporting (2024)
Cost of living in Florence summary. We use data on the cost of living to determine how expensive it is to live in Florence. Real estate prices drive most of the variance in cost of living around Oregon. Key points include:
The cost of living in Florence is 116 with 100 being average.
The cost of living in Florence is 1.2x higher than the national average.
The median home value in Florence is $435,247.
The median income in Florence is $53,333.
Florence's Overall Cost Of Living
Higher Than The National Average
Cost Of Living In Florence Comparison Table
| Living Expense | Florence | Oregon | National Average |
|---|---|---|---|
| Overall | 116 | 109 | 100 |
| Services | 100 | 104 | 100 |
| Groceries | 108 | 106 | 100 |
| Health | 134 | 125 | 100 |
| Housing | 106 | 104 | 100 |
| Transportation | 105 | 106 | 100 |
| Utilities | 113 | 105 | 100 |
Source: Cost of living index, normalized to US average = 100
Florence, OR Weather
The average high in Florence is 59.7° and the average low is 44.8°.
There are 115.5 days of precipitation each year.
Expect an average of 71.2 inches of precipitation each year with 0.7 inches of snow.
| Stat | Florence |
|---|---|
| Average Annual High | 59.7 |
| Average Annual Low | 44.8 |
| Annual Precipitation Days | 115.5 |
| Average Annual Precipitation | 71.2 |
| Average Annual Snowfall | 0.7 |
Average High
Days of Rain
Source: NOAA climate normals (30-year)
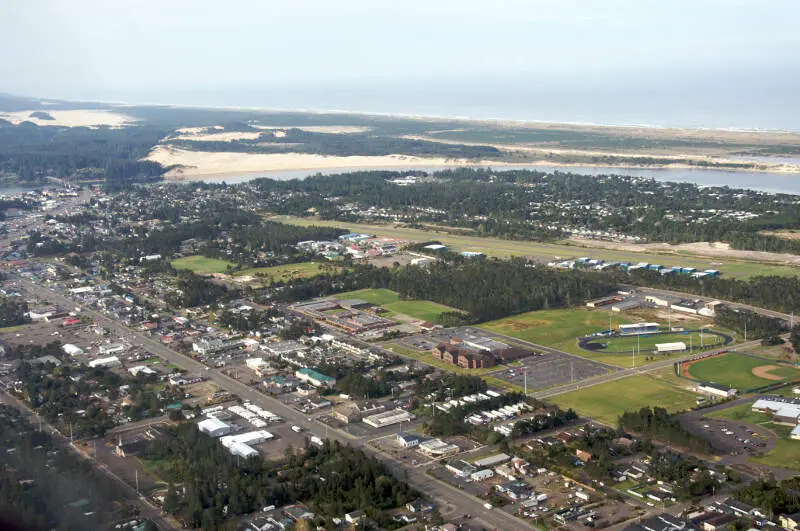
Florence, OR Photos


1 Reviews & Comments About Florence

This place is filled with m**h heads and drop outs. Lots of crime. horrible, depressing place.
The crazy people literally convulsing in the middle of the streets.
Rankings & Articles For Florence


Locations Around Florence
Map Of Florence, OR
Best Places Around Florence
Eugene, OR
Population 179,591
North Bend, OR
Population 10,171
Newport, OR
Population 10,583
Coos Bay, OR
Population 15,925
Florence Demographics And Statistics
Population over time in Florence
The current population in Florence is 9,482. The population has increased 14.7% from 2010.
| Year | Population | % Change |
|---|---|---|
| 2024 | 9,482 | -0.0% |
| 2023 | 9,483 | 1.1% |
| 2022 | 9,384 | 0.3% |
| 2021 | 9,353 | 3.5% |
| 2020 | 9,037 | 1.3% |
| 2019 | 8,921 | 1.2% |
| 2018 | 8,815 | 1.6% |
| 2017 | 8,678 | 0.9% |
| 2016 | 8,597 | 0.6% |
| 2015 | 8,545 | 0.6% |
| 2014 | 8,498 | 0.4% |
| 2013 | 8,463 | 0.6% |
| 2012 | 8,412 | 0.6% |
| 2011 | 8,364 | 1.2% |
| 2010 | 8,264 | - |
Race / Ethnicity in Florence
See the full breakdown
Florence is:
87.9% White with 8,339 White residents.
2.9% African American with 275 African American residents.
0.7% American Indian with 66 American Indian residents.
1.6% Asian with 156 Asian residents.
0.0% Hawaiian with 0 Hawaiian residents.
0.0% Other with 3 Other residents.
1.7% Two Or More with 158 Two Or More residents.
5.1% Hispanic with 485 Hispanic residents.
| Race | Florence | OR | USA |
|---|---|---|---|
| White | 87.9% | 71.4% | 57.4% |
| African American | 2.9% | 1.8% | 11.9% |
| American Indian | 0.7% | 0.6% | 0.5% |
| Asian | 1.6% | 4.4% | 5.9% |
| Hawaiian | 0.0% | 0.4% | 0.2% |
| Other | 0.0% | 0.6% | 0.6% |
| Two Or More | 1.7% | 6.1% | 4.3% |
| Hispanic | 5.1% | 14.7% | 19.3% |
Gender in Florence
See the full breakdown
Florence is 54.1% female with 5,134 female residents.
Florence is 45.9% male with 4,348 male residents.
| Gender | Florence | OR | USA |
|---|---|---|---|
| Female | 54.1% | 50.1% | 50.5% |
| Male | 45.9% | 49.9% | 49.5% |
Highest level of educational attainment in Florence for adults over 25
See the full breakdown
2.0% of adults in Florence completed < 9th grade.
8.0% of adults in Florence completed 9-12th grade.
24.0% of adults in Florence completed high school / ged.
30.0% of adults in Florence completed some college.
11.0% of adults in Florence completed associate's degree.
17.0% of adults in Florence completed bachelor's degree.
6.0% of adults in Florence completed master's degree.
1.0% of adults in Florence completed professional degree.
1.0% of adults in Florence completed doctorate degree.
| Education | Florence | OR | USA |
|---|---|---|---|
| < 9th Grade | 2.0% | 3.0% | 4.0% |
| 9-12th Grade | 8.0% | 5.0% | 6.0% |
| High School / GED | 24.0% | 22.0% | 26.0% |
| Some College | 30.0% | 24.0% | 19.0% |
| Associate's Degree | 11.0% | 9.0% | 9.0% |
| Bachelor's Degree | 17.0% | 23.0% | 22.0% |
| Master's Degree | 6.0% | 10.0% | 10.0% |
| Professional Degree | 1.0% | 2.0% | 2.0% |
| Doctorate Degree | 1.0% | 2.0% | 2.0% |
Household Income For Florence, Oregon
See the full breakdown
3.0% of households in Florence earn Less than $10,000.
4.3% of households in Florence earn $10,000 to $14,999.
9.0% of households in Florence earn $15,000 to $24,999.
13.8% of households in Florence earn $25,000 to $34,999.
17.0% of households in Florence earn $35,000 to $49,999.
17.6% of households in Florence earn $50,000 to $74,999.
17.8% of households in Florence earn $75,000 to $99,999.
13.1% of households in Florence earn $100,000 to $149,999.
3.1% of households in Florence earn $150,000 to $199,999.
1.3% of households in Florence earn $200,000 or more.
| Income | Florence | OR | USA |
|---|---|---|---|
| Less than $10,000 | 3.0% | 4.5% | 5.0% |
| $10,000 to $14,999 | 4.3% | 3.2% | 3.4% |
| $15,000 to $24,999 | 9.0% | 6.1% | 6.3% |
| $25,000 to $34,999 | 13.8% | 6.2% | 6.6% |
| $35,000 to $49,999 | 17.0% | 10.0% | 10.1% |
| $50,000 to $74,999 | 17.6% | 15.4% | 15.5% |
| $75,000 to $99,999 | 17.8% | 13.2% | 12.6% |
| $100,000 to $149,999 | 13.1% | 18.5% | 17.5% |
| $150,000 to $199,999 | 3.1% | 10.1% | 9.6% |
| $200,000 or more | 1.3% | 12.7% | 13.4% |
Source: U.S. Census ACS 5-year estimates (2024)


