Happy Valley, OR
Demographics And Statistics
Living In Happy Valley, Oregon Summary
Life in Happy Valley research summary. HomeSnacks has been using Saturday Night Science to research the quality of life in Happy Valley over the past nine years using Census, FBI, Zillow, and other primary data sources. Based on the most recently available data, we found the following about life in Happy Valley:
The population in Happy Valley is 25,572.
The median home value in Happy Valley is $685,525.
The median income in Happy Valley is $120,324.
The cost of living in Happy Valley is 150 which is 1.5x higher than the national average.
The median rent in Happy Valley is $2,025.
The unemployment rate in Happy Valley is 3.7%.
The poverty rate in Happy Valley is 6.9%.
The average high in Happy Valley is 62.7° and the average low is 43.5°.
Table Of Contents
Happy Valley SnackAbility
Overall SnackAbility
Happy Valley, OR Cost Of Living
Cost of living in Happy Valley summary. We use data on the cost of living to determine how expensive it is to live in Happy Valley. Real estate prices drive most of the variance in cost of living around Oregon. Key points include:
The cost of living in Happy Valley is 150 with 100 being average.
The cost of living in Happy Valley is 1.5x higher than the national average.
The median home value in Happy Valley is $685,525.
The median income in Happy Valley is $120,324.
Happy Valley's Overall Cost Of Living
Higher Than The National Average
Cost Of Living In Happy Valley Comparison Table
| Living Expense | Happy Valley | Oregon | National Average | |
|---|---|---|---|---|
| Overall | 150 | 112 | 100 | |
| Services | 107 | 107 | 100 | |
| Groceries | 112 | 107 | 100 | |
| Health | 108 | 104 | 100 | |
| Housing | 254 | 124 | 100 | |
| Transportation | 127 | 116 | 100 | |
| Utilities | 97 | 97 | 100 | |
Happy Valley, OR Weather
The average high in Happy Valley is 62.7° and the average low is 43.5°.
There are 110.4 days of precipitation each year.
Expect an average of 47.4 inches of precipitation each year with 2.3 inches of snow.
| Stat | Happy Valley |
|---|---|
| Average Annual High | 62.7 |
| Average Annual Low | 43.5 |
| Annual Precipitation Days | 110.4 |
| Average Annual Precipitation | 47.4 |
| Average Annual Snowfall | 2.3 |
Average High
Days of Rain
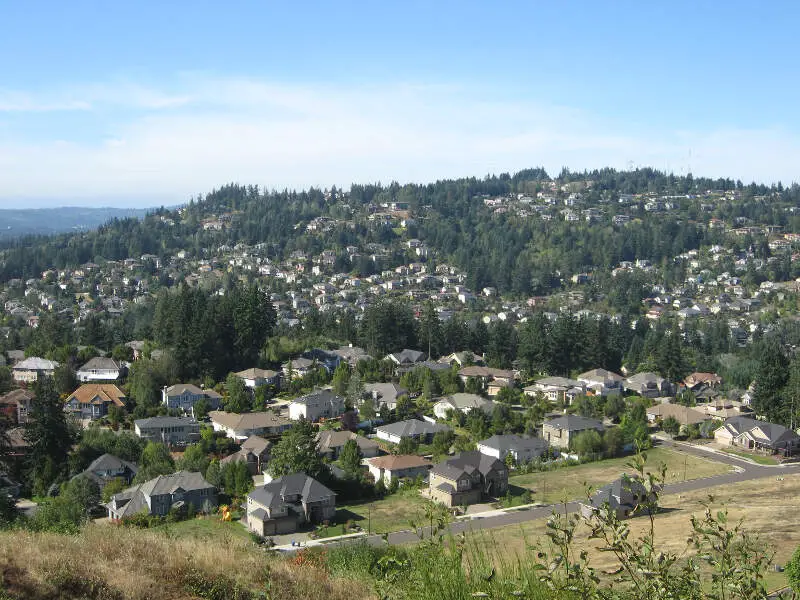
Happy Valley, OR Photos

Rankings for Happy Valley in Oregon


Locations Around Happy Valley
Map Of Happy Valley, OR
Best Places Around Happy Valley
Oregon, WI
Population 11,384
Washougal, WA
Population 16,945
Hazel Dell, WA
Population 23,086
Vancouver, WA
Population 192,696
Camas, WA
Population 26,779
Five Corners, WA
Population 21,444
Lake Oswego, OR
Population 40,367
West Linn, OR
Population 27,065
Orchards, WA
Population 29,716
Happy Valley Demographics And Statistics
Population over time in Happy Valley
The current population in Happy Valley is 25,572. The population has increased 103.2% from 2010.
| Year | Population | % Change |
|---|---|---|
| 2023 | 25,572 | 4.9% |
| 2022 | 24,381 | 4.0% |
| 2021 | 23,442 | 6.3% |
| 2020 | 22,049 | 5.1% |
| 2019 | 20,971 | 7.7% |
| 2018 | 19,471 | 5.4% |
| 2017 | 18,477 | 5.7% |
| 2016 | 17,474 | 6.1% |
| 2015 | 16,462 | 4.9% |
| 2014 | 15,693 | 5.1% |
| 2013 | 14,931 | 6.3% |
| 2012 | 14,050 | 6.7% |
| 2011 | 13,170 | 4.7% |
| 2010 | 12,583 | - |
Race / Ethnicity in Happy Valley
Happy Valley is:
62.5% White with 15,982 White residents.
1.8% African American with 469 African American residents.
0.2% American Indian with 45 American Indian residents.
17.7% Asian with 4,519 Asian residents.
0.3% Hawaiian with 77 Hawaiian residents.
1.6% Other with 403 Other residents.
7.8% Two Or More with 1,987 Two Or More residents.
8.2% Hispanic with 2,090 Hispanic residents.
| Race | Happy Valley | OR | USA |
|---|---|---|---|
| White | 62.5% | 72.3% | 58.2% |
| African American | 1.8% | 1.8% | 12.0% |
| American Indian | 0.2% | 0.7% | 0.5% |
| Asian | 17.7% | 4.4% | 5.7% |
| Hawaiian | 0.3% | 0.4% | 0.2% |
| Other | 1.6% | 0.5% | 0.5% |
| Two Or More | 7.8% | 5.6% | 3.9% |
| Hispanic | 8.2% | 14.3% | 19.0% |
Gender in Happy Valley
Happy Valley is 50.9% female with 13,025 female residents.
Happy Valley is 49.1% male with 12,547 male residents.
| Gender | Happy Valley | OR | USA |
|---|---|---|---|
| Female | 50.9% | 50.1% | 50.5% |
| Male | 49.1% | 49.9% | 49.5% |
Highest level of educational attainment in Happy Valley for adults over 25
3.0% of adults in Happy Valley completed < 9th grade.
3.0% of adults in Happy Valley completed 9-12th grade.
14.0% of adults in Happy Valley completed high school / ged.
21.0% of adults in Happy Valley completed some college.
13.0% of adults in Happy Valley completed associate's degree.
30.0% of adults in Happy Valley completed bachelor's degree.
9.0% of adults in Happy Valley completed master's degree.
5.0% of adults in Happy Valley completed professional degree.
2.0% of adults in Happy Valley completed doctorate degree.
| Education | Happy Valley | OR | USA |
|---|---|---|---|
| < 9th Grade | 3.0% | 4.0% | 5.0% |
| 9-12th Grade | 3.0% | 5.0% | 6.0% |
| High School / GED | 14.0% | 22.0% | 26.0% |
| Some College | 21.0% | 24.0% | 19.0% |
| Associate's Degree | 13.0% | 9.0% | 9.0% |
| Bachelor's Degree | 30.0% | 22.0% | 21.0% |
| Master's Degree | 9.0% | 10.0% | 10.0% |
| Professional Degree | 5.0% | 2.0% | 2.0% |
| Doctorate Degree | 2.0% | 2.0% | 2.0% |
Household Income For Happy Valley, Oregon
3.0% of households in Happy Valley earn Less than $10,000.
0.7% of households in Happy Valley earn $10,000 to $14,999.
1.7% of households in Happy Valley earn $15,000 to $24,999.
3.4% of households in Happy Valley earn $25,000 to $34,999.
6.8% of households in Happy Valley earn $35,000 to $49,999.
13.7% of households in Happy Valley earn $50,000 to $74,999.
12.4% of households in Happy Valley earn $75,000 to $99,999.
18.5% of households in Happy Valley earn $100,000 to $149,999.
14.3% of households in Happy Valley earn $150,000 to $199,999.
25.4% of households in Happy Valley earn $200,000 or more.
| Income | Happy Valley | OR | USA |
|---|---|---|---|
| Less than $10,000 | 3.0% | 4.4% | 4.9% |
| $10,000 to $14,999 | 0.7% | 3.4% | 3.6% |
| $15,000 to $24,999 | 1.7% | 6.3% | 6.6% |
| $25,000 to $34,999 | 3.4% | 6.4% | 6.8% |
| $35,000 to $49,999 | 6.8% | 10.5% | 10.4% |
| $50,000 to $74,999 | 13.7% | 15.9% | 15.7% |
| $75,000 to $99,999 | 12.4% | 13.3% | 12.7% |
| $100,000 to $149,999 | 18.5% | 18.5% | 17.4% |
| $150,000 to $199,999 | 14.3% | 9.6% | 9.3% |
| $200,000 or more | 25.4% | 11.8% | 12.6% |


