Vancouver SnackAbility
Overall SnackAbility
Crime in Vancouver summary. We use data from the FBI to determine the crime rates in Vancouver. Key points include:
There were 7,907 total crimes in Vancouver in the last reporting year.
The overall crime rate per 100,000 people in Vancouver is 3,989.5 / 100k people.
The violent crime rate per 100,000 people in Vancouver is 582.3 / 100k people.
The property crime rate per 100,000 people in Vancouver is 3,407.3 / 100k people.
Overall, crime in Vancouver is 88.25% above the national average.
Total Crimes
Above National Average
Crime In Vancouver Comparison Table
| Statistic | Count Raw |
Vancouver / 100k People |
Washington / 100k People |
National / 100k People |
|---|---|---|---|---|
| Total Crimes Per 100K | 7,907 | 3,989.5 | 2,792.6 | 2,119.2 |
| Violent Crime | 1,154 | 582.3 | 326.1 | 359.0 |
| Murder | 11 | 5.6 | 3.8 | 5.0 |
| Robbery | 242 | 122.1 | 67.5 | 61.0 |
| Aggravated Assault | 779 | 393.0 | 217.0 | 256.0 |
| Property Crime | 6,753 | 3,407.3 | 2,466.5 | 1,760.0 |
| Burglary | 930 | 469.2 | 398.8 | 229.0 |
| Larceny | 4,640 | 2,341.1 | 1,634.2 | 1,272.0 |
| Car Theft | 1,183 | 596.9 | 433.5 | 259.0 |
Source: FBI Uniform Crime Reporting (2024)
Cost of living in Vancouver summary. We use data on the cost of living to determine how expensive it is to live in Vancouver. Real estate prices drive most of the variance in cost of living around Washington. Key points include:
The cost of living in Vancouver is 128 with 100 being average.
The cost of living in Vancouver is 1.3x higher than the national average.
The median home value in Vancouver is $509,318.
The median income in Vancouver is $81,338.
Vancouver's Overall Cost Of Living
Higher Than The National Average
Cost Of Living In Vancouver Comparison Table
| Living Expense | Vancouver | Washington | National Average |
|---|---|---|---|
| Overall | 128 | 120 | 100 |
| Services | 110 | 108 | 100 |
| Groceries | 109 | 108 | 100 |
| Health | 167 | 137 | 100 |
| Housing | 115 | 111 | 100 |
| Transportation | 109 | 111 | 100 |
| Utilities | 109 | 110 | 100 |
Source: Cost of living index, normalized to US average = 100
Vancouver, WA Weather
The average high in Vancouver is 62.3° and the average low is 43.1°.
There are 102.2 days of precipitation each year.
Expect an average of 43.8 inches of precipitation each year with 2.9 inches of snow.
| Stat | Vancouver |
|---|---|
| Average Annual High | 62.3 |
| Average Annual Low | 43.1 |
| Annual Precipitation Days | 102.2 |
| Average Annual Precipitation | 43.8 |
| Average Annual Snowfall | 2.9 |
Average High
Days of Rain
Source: NOAA climate normals (30-year)
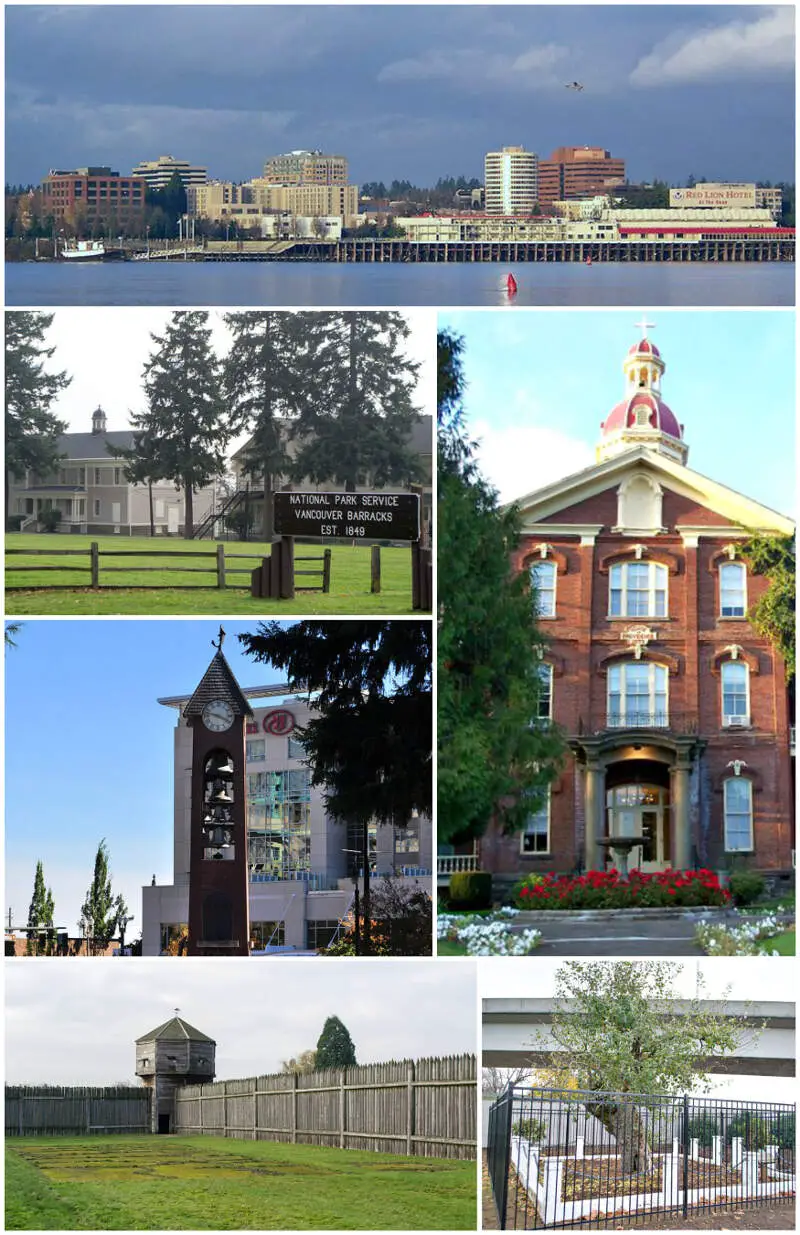
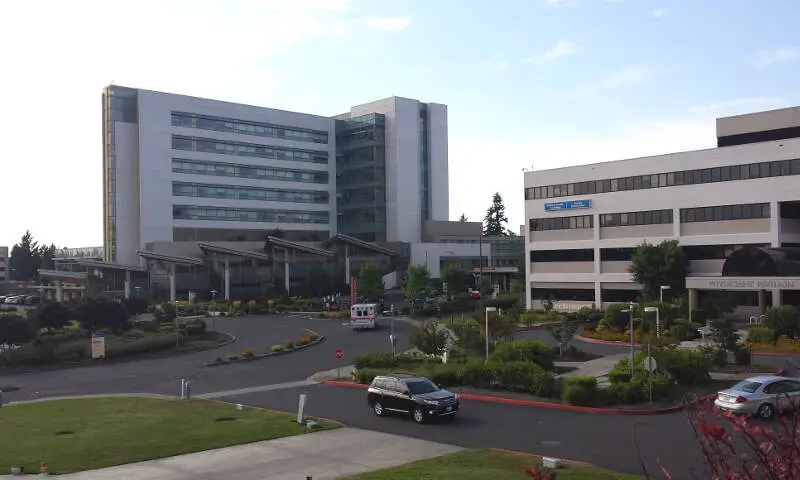
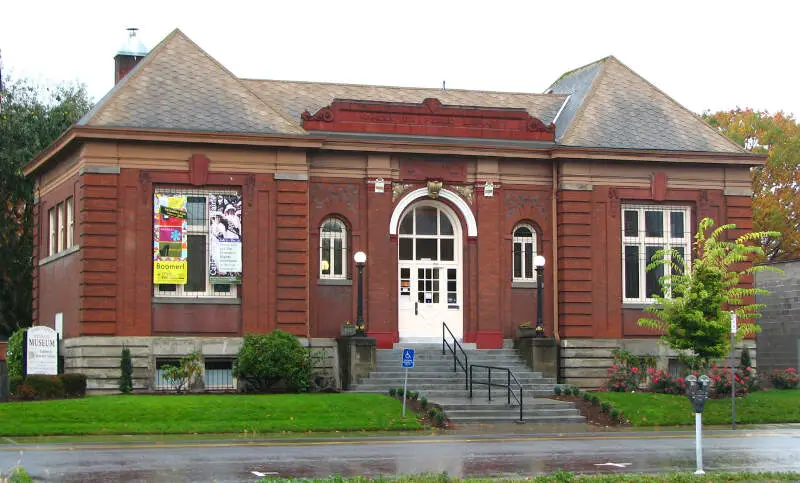
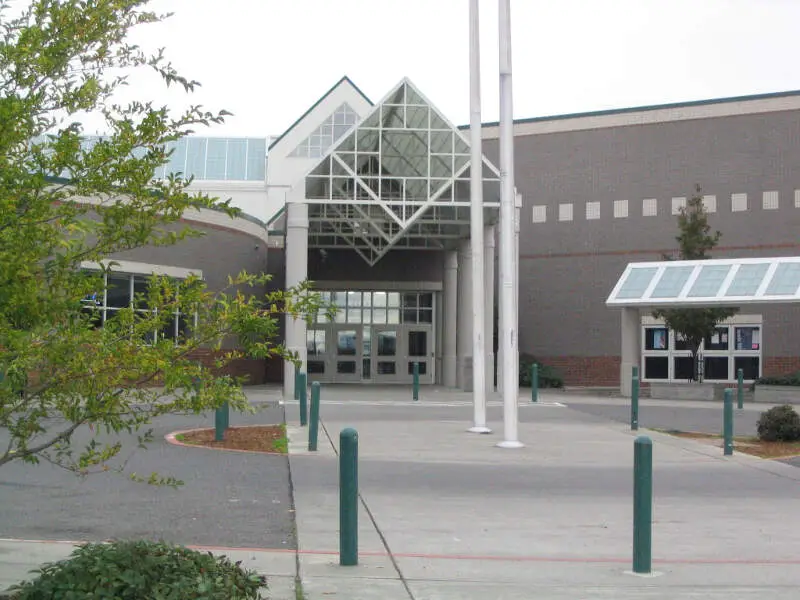
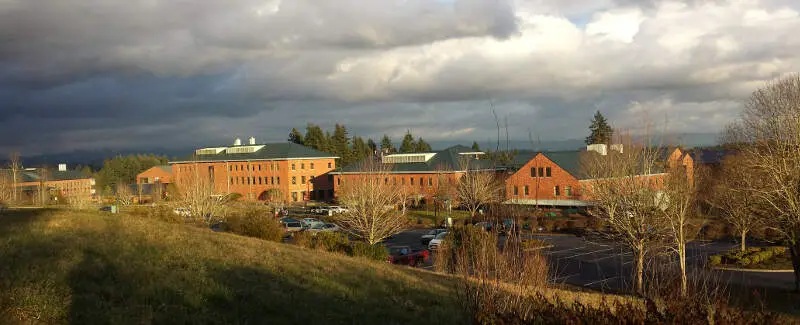
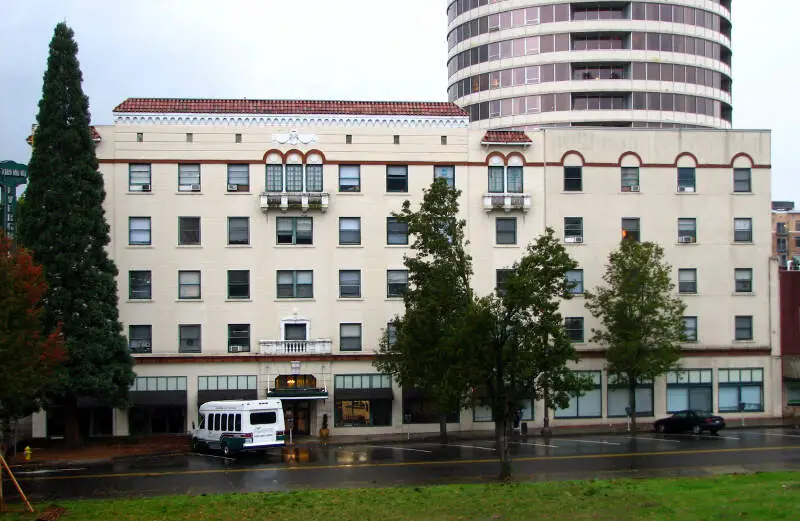
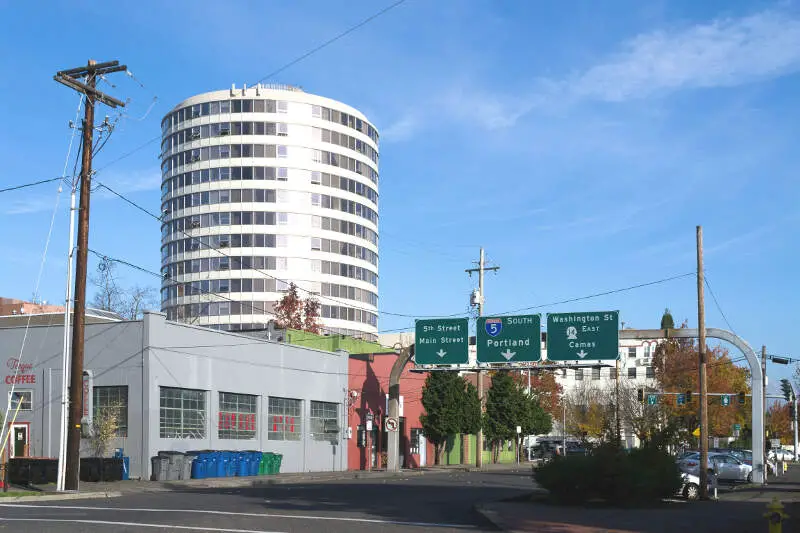
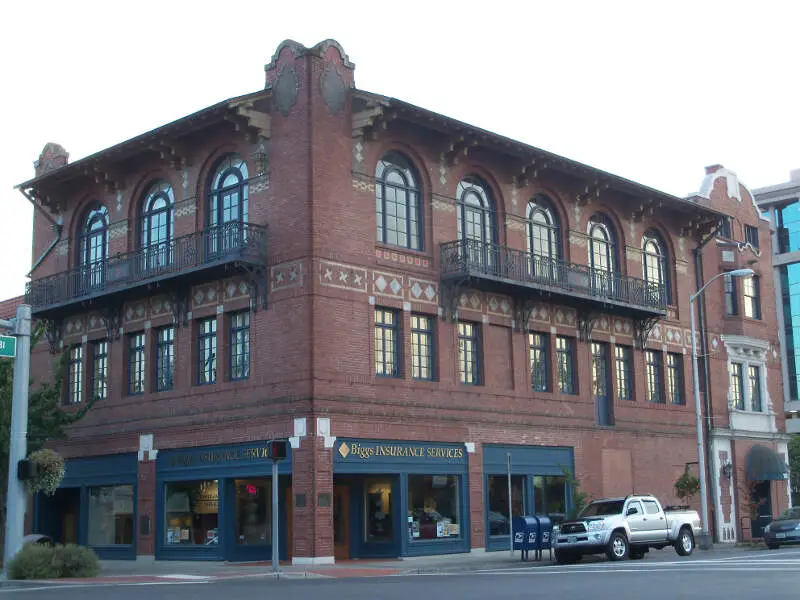
Vancouver, WA Photos
2 Reviews & Comments About Vancouver

i live in vancouver and my neighbors yell at me for blasting bouji music sorry it is better than what you listen to stuff when back when there were dinisours did you get to ride one hunny boo boo-
I grew up and currently live in Vancouver, WA. It is a suburb that seems like a small town at times. It is a calmer city than Portland with all the conveniences and walking trails, a nice waterfront, and a historical fort.
Watch out for congested roads and drivers who do not know what they are doing.
Rankings & Articles For Vancouver


Locations Around Vancouver
Map Of Vancouver, WA
Best Places Around Vancouver
Washougal, WA
Population 17,490
Battle Ground, WA
Population 21,886
Hazel Dell, WA
Population 23,237
Camas, WA
Population 27,007
Mount Vista, WA
Population 10,764
Five Corners, WA
Population 21,194
Lake Oswego, OR
Population 40,381
West Linn, OR
Population 26,935
Orchards, WA
Population 29,438
Vancouver Demographics And Statistics
Population over time in Vancouver
The current population in Vancouver is 195,300. The population has increased 21.9% from 2010.
| Year | Population | % Change |
|---|---|---|
| 2024 | 195,300 | 1.4% |
| 2023 | 192,696 | 1.0% |
| 2022 | 190,700 | 1.3% |
| 2021 | 188,331 | 3.0% |
| 2020 | 182,792 | 1.2% |
| 2019 | 180,556 | 1.2% |
| 2018 | 178,413 | 4.1% |
| 2017 | 171,393 | 0.8% |
| 2016 | 169,982 | 1.1% |
| 2015 | 168,050 | 1.5% |
| 2014 | 165,554 | 0.9% |
| 2013 | 164,111 | 0.9% |
| 2012 | 162,699 | 0.7% |
| 2011 | 161,606 | 0.9% |
| 2010 | 160,202 | - |
Race / Ethnicity in Vancouver
See the full breakdown
Vancouver is:
65.3% White with 127,582 White residents.
3.1% African American with 6,124 African American residents.
0.5% American Indian with 916 American Indian residents.
5.3% Asian with 10,336 Asian residents.
1.5% Hawaiian with 2,957 Hawaiian residents.
0.5% Other with 917 Other residents.
7.0% Two Or More with 13,615 Two Or More residents.
16.8% Hispanic with 32,853 Hispanic residents.
| Race | Vancouver | WA | USA |
|---|---|---|---|
| White | 65.3% | 63.1% | 57.4% |
| African American | 3.1% | 3.8% | 11.9% |
| American Indian | 0.5% | 0.8% | 0.5% |
| Asian | 5.3% | 9.7% | 5.9% |
| Hawaiian | 1.5% | 0.7% | 0.2% |
| Other | 0.5% | 0.6% | 0.6% |
| Two Or More | 7.0% | 6.8% | 4.3% |
| Hispanic | 16.8% | 14.4% | 19.3% |
Gender in Vancouver
See the full breakdown
Vancouver is 50.8% female with 99,176 female residents.
Vancouver is 49.2% male with 96,124 male residents.
| Gender | Vancouver | WA | USA |
|---|---|---|---|
| Female | 50.8% | 49.6% | 50.5% |
| Male | 49.2% | 50.4% | 49.5% |
Highest level of educational attainment in Vancouver for adults over 25
See the full breakdown
4.0% of adults in Vancouver completed < 9th grade.
6.0% of adults in Vancouver completed 9-12th grade.
24.0% of adults in Vancouver completed high school / ged.
24.0% of adults in Vancouver completed some college.
10.0% of adults in Vancouver completed associate's degree.
20.0% of adults in Vancouver completed bachelor's degree.
9.0% of adults in Vancouver completed master's degree.
2.0% of adults in Vancouver completed professional degree.
1.0% of adults in Vancouver completed doctorate degree.
| Education | Vancouver | WA | USA |
|---|---|---|---|
| < 9th Grade | 4.0% | 4.0% | 4.0% |
| 9-12th Grade | 6.0% | 4.0% | 6.0% |
| High School / GED | 24.0% | 22.0% | 26.0% |
| Some College | 24.0% | 21.0% | 19.0% |
| Associate's Degree | 10.0% | 10.0% | 9.0% |
| Bachelor's Degree | 20.0% | 24.0% | 22.0% |
| Master's Degree | 9.0% | 11.0% | 10.0% |
| Professional Degree | 2.0% | 2.0% | 2.0% |
| Doctorate Degree | 1.0% | 2.0% | 2.0% |
Household Income For Vancouver, Washington
See the full breakdown
4.2% of households in Vancouver earn Less than $10,000.
2.8% of households in Vancouver earn $10,000 to $14,999.
4.7% of households in Vancouver earn $15,000 to $24,999.
5.7% of households in Vancouver earn $25,000 to $34,999.
9.8% of households in Vancouver earn $35,000 to $49,999.
18.2% of households in Vancouver earn $50,000 to $74,999.
15.9% of households in Vancouver earn $75,000 to $99,999.
20.4% of households in Vancouver earn $100,000 to $149,999.
8.3% of households in Vancouver earn $150,000 to $199,999.
10.0% of households in Vancouver earn $200,000 or more.
| Income | Vancouver | WA | USA |
|---|---|---|---|
| Less than $10,000 | 4.2% | 3.9% | 5.0% |
| $10,000 to $14,999 | 2.8% | 2.5% | 3.4% |
| $15,000 to $24,999 | 4.7% | 4.6% | 6.3% |
| $25,000 to $34,999 | 5.7% | 5.0% | 6.6% |
| $35,000 to $49,999 | 9.8% | 8.2% | 10.1% |
| $50,000 to $74,999 | 18.2% | 14.1% | 15.5% |
| $75,000 to $99,999 | 15.9% | 12.4% | 12.6% |
| $100,000 to $149,999 | 20.4% | 19.2% | 17.5% |
| $150,000 to $199,999 | 8.3% | 11.4% | 9.6% |
| $200,000 or more | 10.0% | 18.5% | 13.4% |
Source: U.S. Census ACS 5-year estimates (2024)


