Salem SnackAbility
Overall SnackAbility
Crime in Salem summary. We use data from the FBI to determine the crime rates in Salem. Key points include:
There were 5,935 total crimes in Salem in the last reporting year.
The overall crime rate per 100,000 people in Salem is 3,335.5 / 100k people.
The violent crime rate per 100,000 people in Salem is 532.2 / 100k people.
The property crime rate per 100,000 people in Salem is 2,803.3 / 100k people.
Overall, crime in Salem is 57.39% above the national average.
Total Crimes
Above National Average
Crime In Salem Comparison Table
| Statistic | Count Raw |
Salem / 100k People |
Oregon / 100k People |
National / 100k People |
|---|---|---|---|---|
| Total Crimes Per 100K | 5,935 | 3,335.5 | 2,719.1 | 2,119.2 |
| Violent Crime | 947 | 532.2 | 331.0 | 359.0 |
| Murder | 8 | 4.5 | 3.7 | 5.0 |
| Robbery | 158 | 88.8 | 57.0 | 61.0 |
| Aggravated Assault | 715 | 401.8 | 229.1 | 256.0 |
| Property Crime | 4,988 | 2,803.3 | 2,388.0 | 1,760.0 |
| Burglary | 787 | 442.3 | 306.5 | 229.0 |
| Larceny | 3,498 | 1,965.9 | 1,789.5 | 1,272.0 |
| Car Theft | 703 | 395.1 | 292.1 | 259.0 |
Source: FBI Uniform Crime Reporting (2024)
Cost of living in Salem summary. We use data on the cost of living to determine how expensive it is to live in Salem. Real estate prices drive most of the variance in cost of living around Oregon. Key points include:
The cost of living in Salem is 116 with 100 being average.
The cost of living in Salem is 1.2x higher than the national average.
The median home value in Salem is $436,317.
The median income in Salem is $75,487.
Salem's Overall Cost Of Living
Higher Than The National Average
Cost Of Living In Salem Comparison Table
| Living Expense | Salem | Oregon | National Average |
|---|---|---|---|
| Overall | 116 | 109 | 100 |
| Services | 105 | 104 | 100 |
| Groceries | 108 | 106 | 100 |
| Health | 134 | 125 | 100 |
| Housing | 103 | 104 | 100 |
| Transportation | 111 | 106 | 100 |
| Utilities | 105 | 105 | 100 |
Source: Cost of living index, normalized to US average = 100
Salem, OR Weather
The average high in Salem is 62.7° and the average low is 42.8°.
There are 90.9 days of precipitation each year.
Expect an average of 43.0 inches of precipitation each year with 5.1 inches of snow.
| Stat | Salem |
|---|---|
| Average Annual High | 62.7 |
| Average Annual Low | 42.8 |
| Annual Precipitation Days | 90.9 |
| Average Annual Precipitation | 43.0 |
| Average Annual Snowfall | 5.1 |
Average High
Days of Rain
Source: NOAA climate normals (30-year)
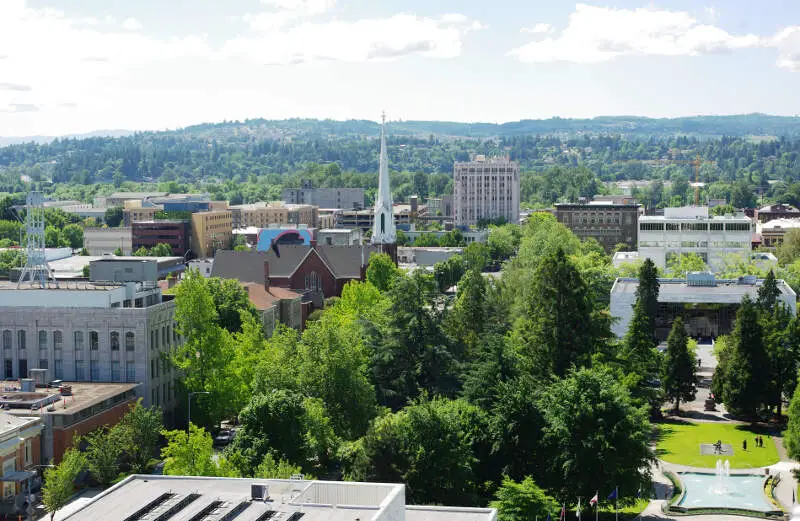
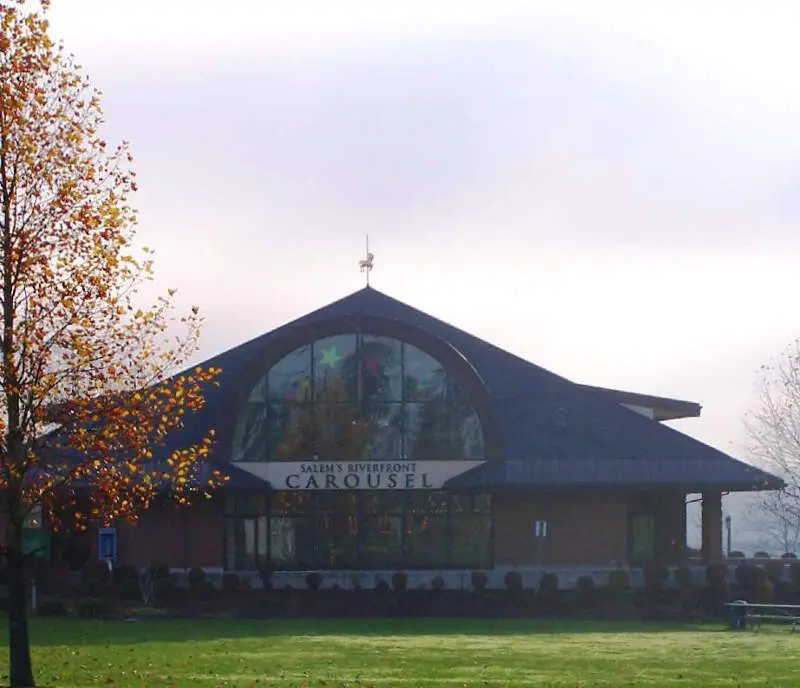
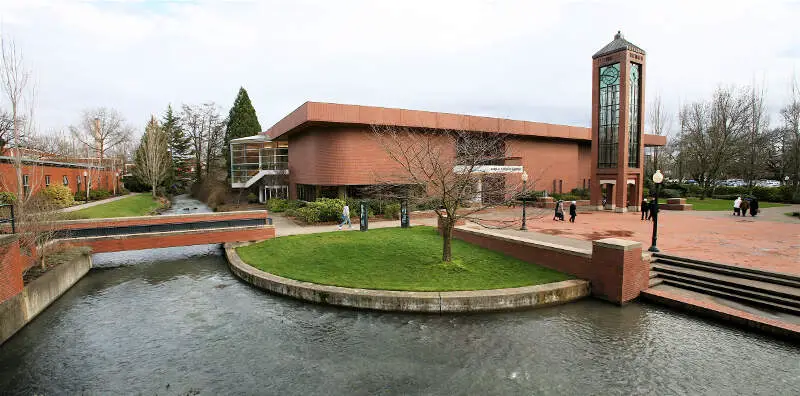
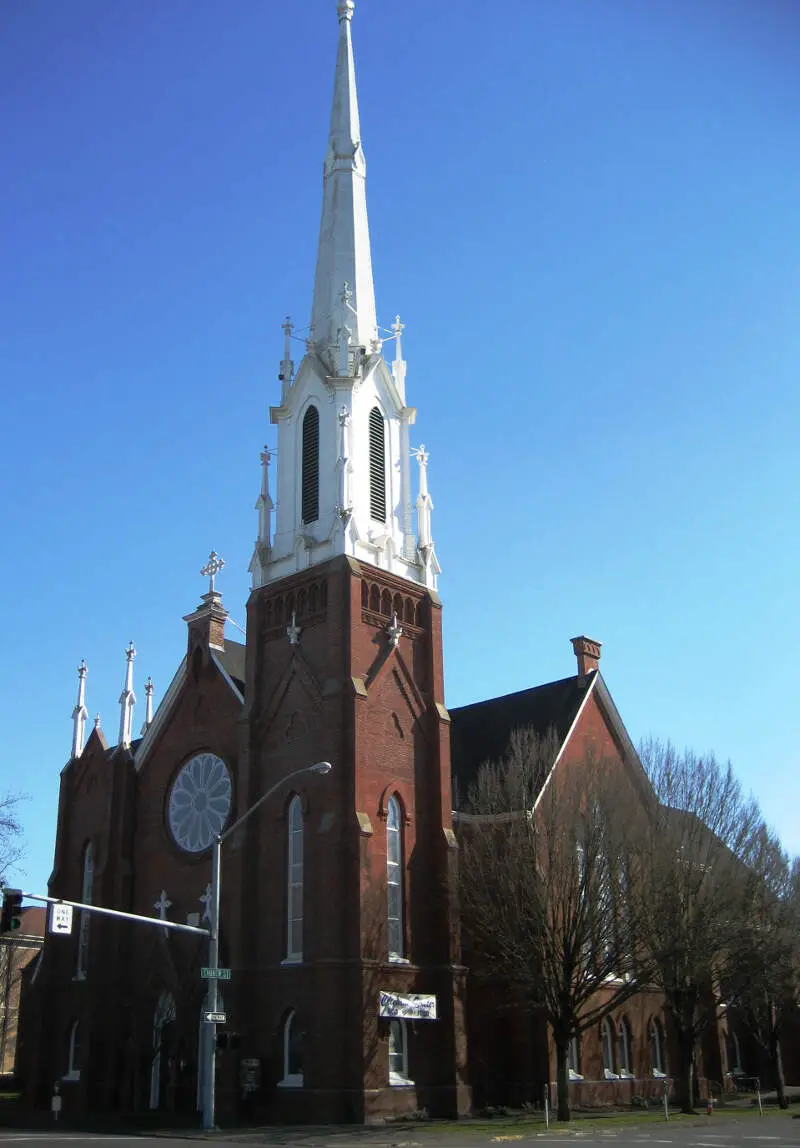
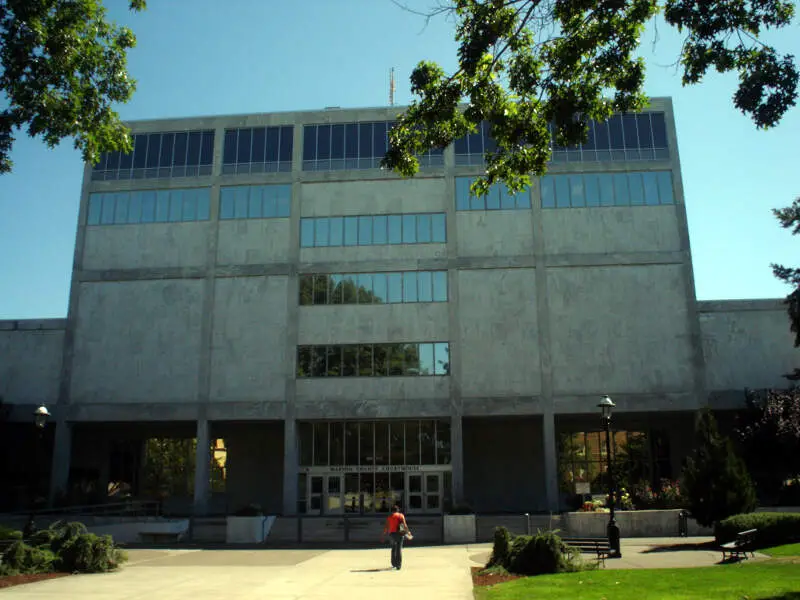
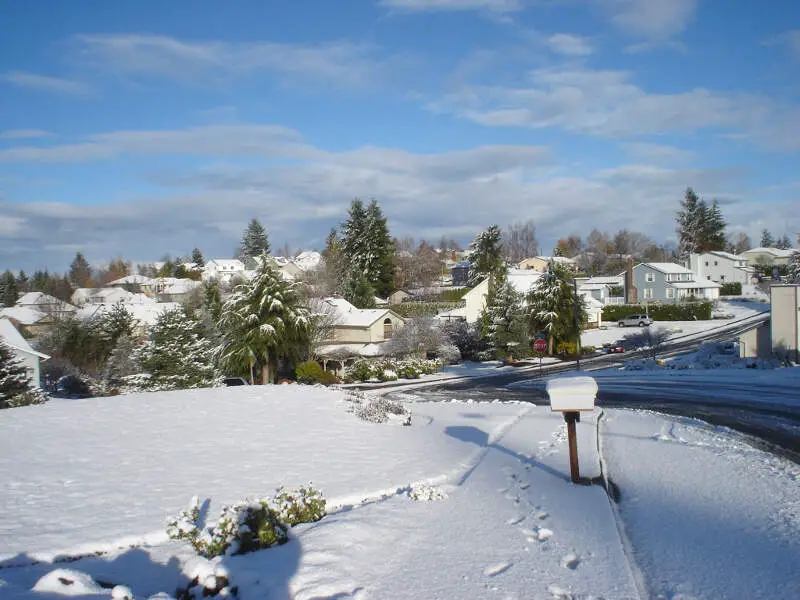
Salem, OR Photos


1 Reviews & Comments About Salem

Nestled in the lush and colorful Willamette Valley--just 50 miles south of Portland you'll find Salem, Oregon's capital. With low crime, a sprawling economy, great wages, and highly educated work force, Salem makes for a vibrant community to raise a family, or meet that special someone. The recreational opportunities, year-round are truly unsurpassed. Ranging from the pacfic northwest's majestic cascade range--which offers excellent snow-sports and hiking, to oregon's picturesque oregon coast--with awe-inspiring cliffs, and scenic beauty that rivals any other beaches found on the east coast.
Cultural diversity, natural beauty, and good drivers!
Rankings & Articles For Salem


Locations Around Salem
Map Of Salem, OR
Best Places Around Salem
Keizer, OR
Population 39,082
Dallas, OR
Population 17,531
Silverton, OR
Population 10,456
Four Corners, OR
Population 16,275
Stayton, OR
Population 8,292
Woodburn, OR
Population 27,875
Hayesville, OR
Population 21,246
Independence, OR
Population 10,199
Monmouth, OR
Population 11,428
Salem Demographics And Statistics
Population over time in Salem
The current population in Salem is 178,865. The population has increased 17.8% from 2010.
| Year | Population | % Change |
|---|---|---|
| 2024 | 178,865 | 1.2% |
| 2023 | 176,666 | 0.5% |
| 2022 | 175,754 | 0.9% |
| 2021 | 174,193 | 1.4% |
| 2020 | 171,806 | 1.5% |
| 2019 | 169,259 | 1.5% |
| 2018 | 166,756 | 1.9% |
| 2017 | 163,654 | 1.0% |
| 2016 | 161,975 | 1.2% |
| 2015 | 160,008 | 1.3% |
| 2014 | 157,967 | 0.7% |
| 2013 | 156,937 | 1.4% |
| 2012 | 154,835 | 0.9% |
| 2011 | 153,481 | 1.1% |
| 2010 | 151,809 | - |
Race / Ethnicity in Salem
See the full breakdown
Salem is:
61.3% White with 109,605 White residents.
1.6% African American with 2,781 African American residents.
0.5% American Indian with 925 American Indian residents.
3.6% Asian with 6,377 Asian residents.
1.5% Hawaiian with 2,717 Hawaiian residents.
0.6% Other with 1,015 Other residents.
5.6% Two Or More with 10,005 Two Or More residents.
25.4% Hispanic with 45,440 Hispanic residents.
| Race | Salem | OR | USA |
|---|---|---|---|
| White | 61.3% | 71.4% | 57.4% |
| African American | 1.6% | 1.8% | 11.9% |
| American Indian | 0.5% | 0.6% | 0.5% |
| Asian | 3.6% | 4.4% | 5.9% |
| Hawaiian | 1.5% | 0.4% | 0.2% |
| Other | 0.6% | 0.6% | 0.6% |
| Two Or More | 5.6% | 6.1% | 4.3% |
| Hispanic | 25.4% | 14.7% | 19.3% |
Gender in Salem
See the full breakdown
Salem is 49.7% female with 88,943 female residents.
Salem is 50.3% male with 89,922 male residents.
| Gender | Salem | OR | USA |
|---|---|---|---|
| Female | 49.7% | 50.1% | 50.5% |
| Male | 50.3% | 49.9% | 49.5% |
Highest level of educational attainment in Salem for adults over 25
See the full breakdown
6.0% of adults in Salem completed < 9th grade.
6.0% of adults in Salem completed 9-12th grade.
23.0% of adults in Salem completed high school / ged.
25.0% of adults in Salem completed some college.
9.0% of adults in Salem completed associate's degree.
19.0% of adults in Salem completed bachelor's degree.
9.0% of adults in Salem completed master's degree.
2.0% of adults in Salem completed professional degree.
1.0% of adults in Salem completed doctorate degree.
| Education | Salem | OR | USA |
|---|---|---|---|
| < 9th Grade | 6.0% | 3.0% | 4.0% |
| 9-12th Grade | 6.0% | 5.0% | 6.0% |
| High School / GED | 23.0% | 22.0% | 26.0% |
| Some College | 25.0% | 24.0% | 19.0% |
| Associate's Degree | 9.0% | 9.0% | 9.0% |
| Bachelor's Degree | 19.0% | 23.0% | 22.0% |
| Master's Degree | 9.0% | 10.0% | 10.0% |
| Professional Degree | 2.0% | 2.0% | 2.0% |
| Doctorate Degree | 1.0% | 2.0% | 2.0% |
Household Income For Salem, Oregon
See the full breakdown
4.8% of households in Salem earn Less than $10,000.
3.6% of households in Salem earn $10,000 to $14,999.
6.2% of households in Salem earn $15,000 to $24,999.
7.0% of households in Salem earn $25,000 to $34,999.
9.8% of households in Salem earn $35,000 to $49,999.
18.2% of households in Salem earn $50,000 to $74,999.
13.2% of households in Salem earn $75,000 to $99,999.
19.7% of households in Salem earn $100,000 to $149,999.
8.0% of households in Salem earn $150,000 to $199,999.
9.4% of households in Salem earn $200,000 or more.
| Income | Salem | OR | USA |
|---|---|---|---|
| Less than $10,000 | 4.8% | 4.5% | 5.0% |
| $10,000 to $14,999 | 3.6% | 3.2% | 3.4% |
| $15,000 to $24,999 | 6.2% | 6.1% | 6.3% |
| $25,000 to $34,999 | 7.0% | 6.2% | 6.6% |
| $35,000 to $49,999 | 9.8% | 10.0% | 10.1% |
| $50,000 to $74,999 | 18.2% | 15.4% | 15.5% |
| $75,000 to $99,999 | 13.2% | 13.2% | 12.6% |
| $100,000 to $149,999 | 19.7% | 18.5% | 17.5% |
| $150,000 to $199,999 | 8.0% | 10.1% | 9.6% |
| $200,000 or more | 9.4% | 12.7% | 13.4% |
Source: U.S. Census ACS 5-year estimates (2024)


