Silverton, OR
Demographics And Statistics
Living In Silverton, Oregon Summary
Life in Silverton research summary. HomeSnacks has been using Saturday Night Science to research the quality of life in Silverton over the past nine years using Census, FBI, Zillow, and other primary data sources. Based on the most recently available data, we found the following about life in Silverton:
The population in Silverton is 10,445.
The median home value in Silverton is $549,082.
The median income in Silverton is $74,286.
The cost of living in Silverton is 120 which is 1.2x higher than the national average.
The median rent in Silverton is $1,479.
The unemployment rate in Silverton is 4.2%.
The poverty rate in Silverton is 13.3%.
The average high in Silverton is 62.3° and the average low is 43.4°.
Silverton SnackAbility
Overall SnackAbility
Silverton, OR Crime Report
Crime in Silverton summary. We use data from the FBI to determine the crime rates in Silverton. Key points include:
There were 155 total crimes in Silverton in the last reporting year.
The overall crime rate per 100,000 people in Silverton is 1,459.2 / 100k people.
The violent crime rate per 100,000 people in Silverton is 150.6 / 100k people.
The property crime rate per 100,000 people in Silverton is 1,308.6 / 100k people.
Overall, crime in Silverton is -31.14% below the national average.
Total Crimes
Below National Average
Crime In Silverton Comparison Table
| Statistic | Count Raw |
Silverton / 100k People |
Oregon / 100k People |
National / 100k People |
|---|---|---|---|---|
| Total Crimes Per 100K | 155 | 1,459.2 | 2,719.1 | 2,119.2 |
| Violent Crime | 16 | 150.6 | 331.0 | 359.0 |
| Murder | 0 | 0.0 | 3.7 | 5.0 |
| Robbery | 1 | 9.4 | 57.0 | 61.0 |
| Aggravated Assault | 11 | 103.6 | 229.1 | 256.0 |
| Property Crime | 139 | 1,308.6 | 2,388.0 | 1,760.0 |
| Burglary | 12 | 113.0 | 306.5 | 229.0 |
| Larceny | 107 | 1,007.3 | 1,789.5 | 1,272.0 |
| Car Theft | 20 | 188.3 | 292.1 | 259.0 |
Silverton, OR Cost Of Living
Cost of living in Silverton summary. We use data on the cost of living to determine how expensive it is to live in Silverton. Real estate prices drive most of the variance in cost of living around Oregon. Key points include:
The cost of living in Silverton is 120 with 100 being average.
The cost of living in Silverton is 1.2x higher than the national average.
The median home value in Silverton is $549,082.
The median income in Silverton is $74,286.
Silverton's Overall Cost Of Living
Higher Than The National Average
Cost Of Living In Silverton Comparison Table
| Living Expense | Silverton | Oregon | National Average | |
|---|---|---|---|---|
| Overall | 120 | 112 | 100 | |
| Services | 108 | 107 | 100 | |
| Groceries | 109 | 107 | 100 | |
| Health | 109 | 104 | 100 | |
| Housing | 156 | 124 | 100 | |
| Transportation | 124 | 116 | 100 | |
| Utilities | 95 | 97 | 100 | |
Silverton, OR Weather
The average high in Silverton is 62.3° and the average low is 43.4°.
There are 112.9 days of precipitation each year.
Expect an average of 46.6 inches of precipitation each year with 3.0 inches of snow.
| Stat | Silverton |
|---|---|
| Average Annual High | 62.3 |
| Average Annual Low | 43.4 |
| Annual Precipitation Days | 112.9 |
| Average Annual Precipitation | 46.6 |
| Average Annual Snowfall | 3.0 |
Average High
Days of Rain
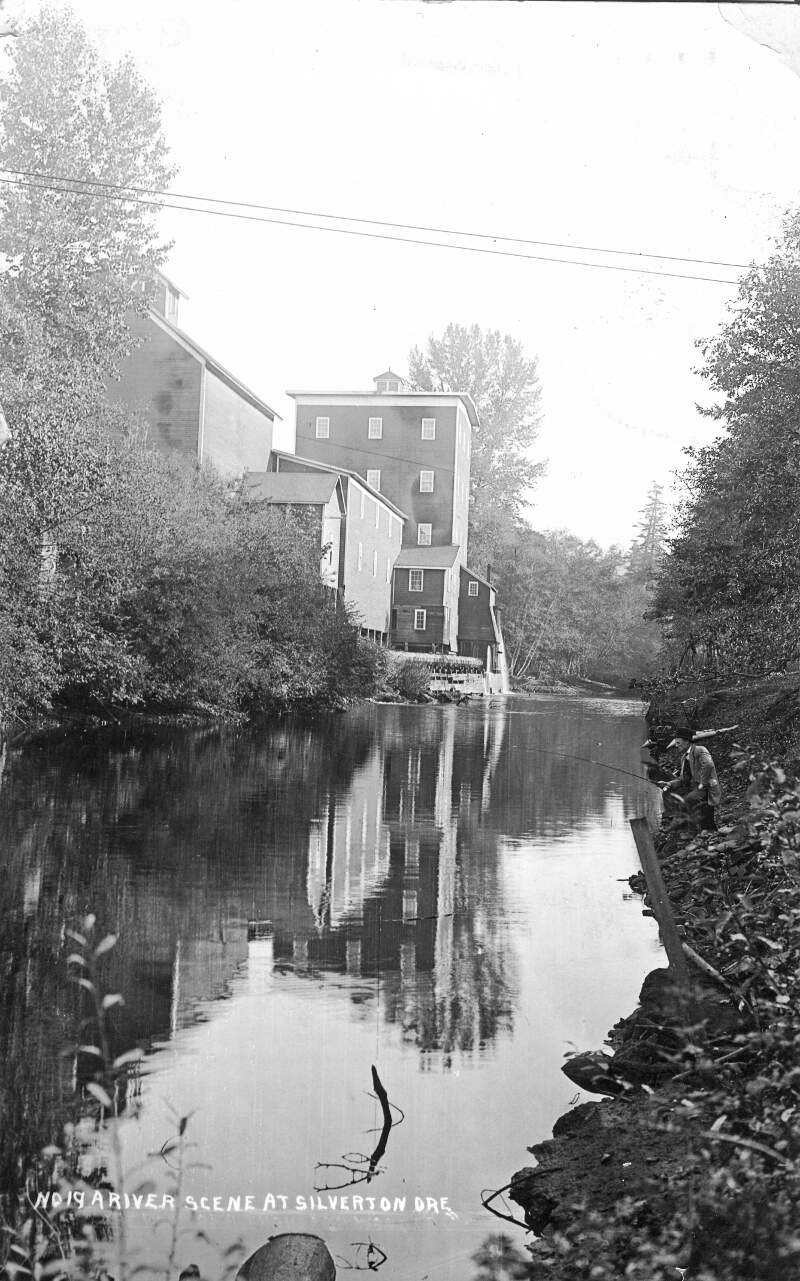
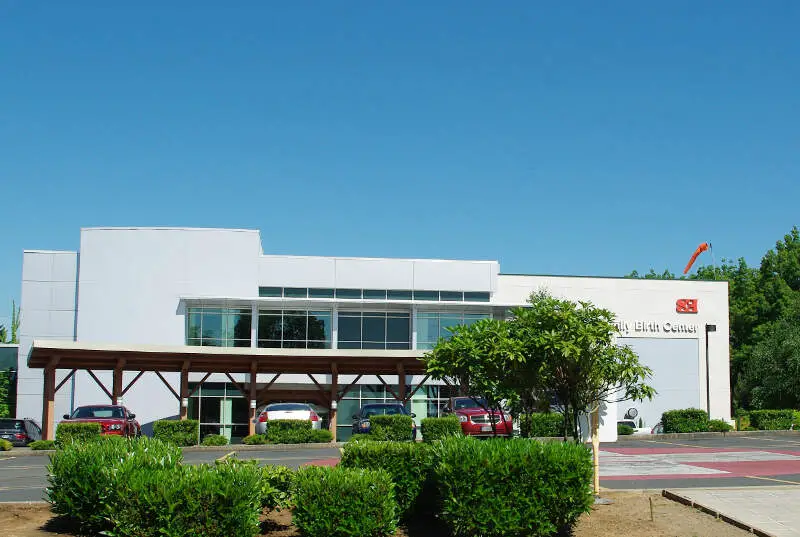
Silverton, OR Photos


1 Reviews & Comments About Silverton
/5

HomeSnacks User - 2018-09-06 02:58:24.045880
I love the cute town of Silverton Oregon. It's right next to Silver Falls State Park, a forested canyon with over ten waterfalls. It was nice to be in nature and, afterwards, to stop at the grocery store in town for a bite to eat.
Silverton is small and easy to navigate. The city park is great for kids and some of the buildings in old part of town have murals. The grocery store in town, Roth's, has an awesome deli where you can get delicious sandwiches.
Rankings for Silverton in Oregon


Locations Around Silverton
Map Of Silverton, OR
Best Places Around Silverton
Keizer, OR
Population 39,013
Salem, OR
Population 176,666
Canby, OR
Population 18,103
Four Corners, OR
Population 16,168
Stayton, OR
Population 8,223
Woodburn, OR
Population 26,845
Hayesville, OR
Population 22,309
Molalla, OR
Population 10,168
Silverton Demographics And Statistics
Population over time in Silverton
The current population in Silverton is 10,445. The population has increased 16.8% from 2010.
| Year | Population | % Change |
|---|---|---|
| 2023 | 10,445 | 0.1% |
| 2022 | 10,439 | 0.4% |
| 2021 | 10,402 | -0.2% |
| 2020 | 10,426 | 1.8% |
| 2019 | 10,242 | 2.1% |
| 2018 | 10,028 | 2.8% |
| 2017 | 9,757 | 1.8% |
| 2016 | 9,585 | 1.6% |
| 2015 | 9,436 | 1.0% |
| 2014 | 9,342 | 0.9% |
| 2013 | 9,263 | 0.8% |
| 2012 | 9,193 | 1.1% |
| 2011 | 9,091 | 1.7% |
| 2010 | 8,940 | - |
Race / Ethnicity in Silverton
Silverton is:
76.2% White with 7,958 White residents.
2.7% African American with 287 African American residents.
1.9% American Indian with 198 American Indian residents.
0.1% Asian with 6 Asian residents.
0.4% Hawaiian with 41 Hawaiian residents.
0.3% Other with 32 Other residents.
3.9% Two Or More with 412 Two Or More residents.
14.5% Hispanic with 1,511 Hispanic residents.
| Race | Silverton | OR | USA |
|---|---|---|---|
| White | 76.2% | 72.3% | 58.2% |
| African American | 2.7% | 1.8% | 12.0% |
| American Indian | 1.9% | 0.7% | 0.5% |
| Asian | 0.1% | 4.4% | 5.7% |
| Hawaiian | 0.4% | 0.4% | 0.2% |
| Other | 0.3% | 0.5% | 0.5% |
| Two Or More | 3.9% | 5.6% | 3.9% |
| Hispanic | 14.5% | 14.3% | 19.0% |
Gender in Silverton
Silverton is 53.0% female with 5,531 female residents.
Silverton is 47.0% male with 4,914 male residents.
| Gender | Silverton | OR | USA |
|---|---|---|---|
| Female | 53.0% | 50.1% | 50.5% |
| Male | 47.0% | 49.9% | 49.5% |
Highest level of educational attainment in Silverton for adults over 25
3.0% of adults in Silverton completed < 9th grade.
5.0% of adults in Silverton completed 9-12th grade.
26.0% of adults in Silverton completed high school / ged.
26.0% of adults in Silverton completed some college.
10.0% of adults in Silverton completed associate's degree.
19.0% of adults in Silverton completed bachelor's degree.
9.0% of adults in Silverton completed master's degree.
2.0% of adults in Silverton completed professional degree.
0.0% of adults in Silverton completed doctorate degree.
| Education | Silverton | OR | USA |
|---|---|---|---|
| < 9th Grade | 3.0% | 4.0% | 5.0% |
| 9-12th Grade | 5.0% | 5.0% | 6.0% |
| High School / GED | 26.0% | 22.0% | 26.0% |
| Some College | 26.0% | 24.0% | 19.0% |
| Associate's Degree | 10.0% | 9.0% | 9.0% |
| Bachelor's Degree | 19.0% | 22.0% | 21.0% |
| Master's Degree | 9.0% | 10.0% | 10.0% |
| Professional Degree | 2.0% | 2.0% | 2.0% |
| Doctorate Degree | 0.0% | 2.0% | 2.0% |
Household Income For Silverton, Oregon
2.0% of households in Silverton earn Less than $10,000.
5.9% of households in Silverton earn $10,000 to $14,999.
8.9% of households in Silverton earn $15,000 to $24,999.
8.0% of households in Silverton earn $25,000 to $34,999.
11.1% of households in Silverton earn $35,000 to $49,999.
14.5% of households in Silverton earn $50,000 to $74,999.
14.4% of households in Silverton earn $75,000 to $99,999.
17.5% of households in Silverton earn $100,000 to $149,999.
9.3% of households in Silverton earn $150,000 to $199,999.
8.4% of households in Silverton earn $200,000 or more.
| Income | Silverton | OR | USA |
|---|---|---|---|
| Less than $10,000 | 2.0% | 4.4% | 4.9% |
| $10,000 to $14,999 | 5.9% | 3.4% | 3.6% |
| $15,000 to $24,999 | 8.9% | 6.3% | 6.6% |
| $25,000 to $34,999 | 8.0% | 6.4% | 6.8% |
| $35,000 to $49,999 | 11.1% | 10.5% | 10.4% |
| $50,000 to $74,999 | 14.5% | 15.9% | 15.7% |
| $75,000 to $99,999 | 14.4% | 13.3% | 12.7% |
| $100,000 to $149,999 | 17.5% | 18.5% | 17.4% |
| $150,000 to $199,999 | 9.3% | 9.6% | 9.3% |
| $200,000 or more | 8.4% | 11.8% | 12.6% |


