St. Helens SnackAbility
Overall SnackAbility
Crime in St. Helens summary. We use data from the FBI to determine the crime rates in St. Helens. Key points include:
There were 175 total crimes in St. Helens in the last reporting year.
The overall crime rate per 100,000 people in St. Helens is 1,197.3 / 100k people.
The violent crime rate per 100,000 people in St. Helens is 273.7 / 100k people.
The property crime rate per 100,000 people in St. Helens is 923.6 / 100k people.
Overall, crime in St. Helens is -43.50% below the national average.
Total Crimes
Below National Average
Crime In St. Helens Comparison Table
| Statistic | Count Raw |
St. Helens / 100k People |
Oregon / 100k People |
National / 100k People |
|---|---|---|---|---|
| Total Crimes Per 100K | 175 | 1,197.3 | 2,719.1 | 2,119.2 |
| Violent Crime | 40 | 273.7 | 331.0 | 359.0 |
| Murder | 0 | 0.0 | 3.7 | 5.0 |
| Robbery | 1 | 6.8 | 57.0 | 61.0 |
| Aggravated Assault | 34 | 232.6 | 229.1 | 256.0 |
| Property Crime | 135 | 923.6 | 2,388.0 | 1,760.0 |
| Burglary | 32 | 218.9 | 306.5 | 229.0 |
| Larceny | 93 | 636.3 | 1,789.5 | 1,272.0 |
| Car Theft | 10 | 68.4 | 292.1 | 259.0 |
Source: FBI Uniform Crime Reporting (2024)
Cost of living in St. Helens summary. We use data on the cost of living to determine how expensive it is to live in St. Helens. Real estate prices drive most of the variance in cost of living around Oregon. Key points include:
The cost of living in St. Helens is 114 with 100 being average.
The cost of living in St. Helens is 1.1x higher than the national average.
The median home value in St. Helens is $425,039.
The median income in St. Helens is $82,865.
St. Helens's Overall Cost Of Living
Higher Than The National Average
Cost Of Living In St. Helens Comparison Table
| Living Expense | St. Helens | Oregon | National Average |
|---|---|---|---|
| Overall | 114 | 109 | 100 |
| Services | 111 | 104 | 100 |
| Groceries | 109 | 106 | 100 |
| Health | 121 | 125 | 100 |
| Housing | 116 | 104 | 100 |
| Transportation | 107 | 106 | 100 |
| Utilities | 107 | 105 | 100 |
Source: Cost of living index, normalized to US average = 100
St. Helens, OR Weather
The average high in St. Helens is 62.6° and the average low is 42.6°.
There are 132.0 days of precipitation each year.
Expect an average of 44.1 inches of precipitation each year with 2.1 inches of snow.
| Stat | St. Helens |
|---|---|
| Average Annual High | 62.6 |
| Average Annual Low | 42.6 |
| Annual Precipitation Days | 132.0 |
| Average Annual Precipitation | 44.1 |
| Average Annual Snowfall | 2.1 |
Average High
Days of Rain
Source: NOAA climate normals (30-year)
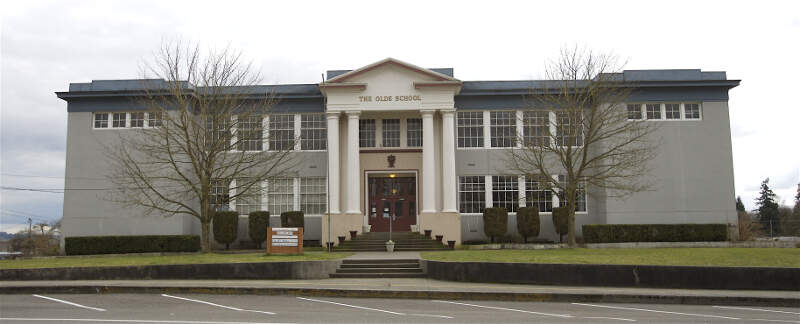
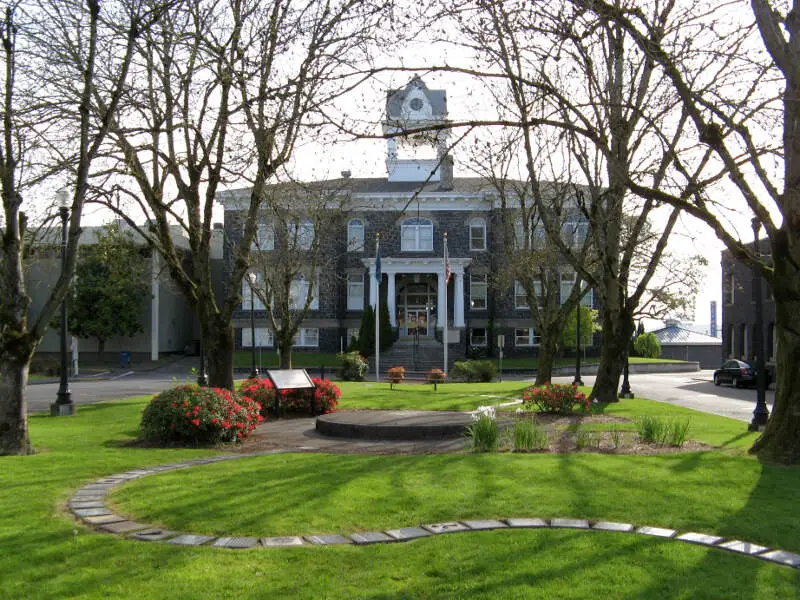
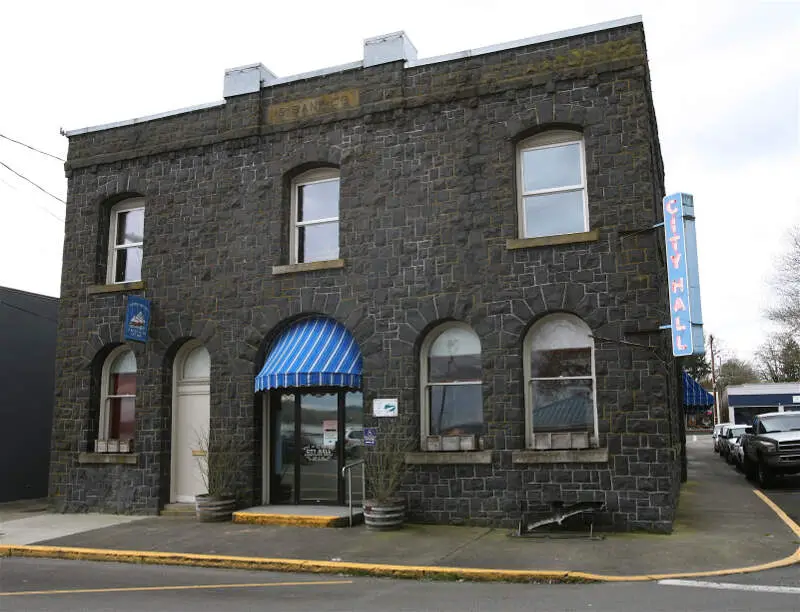
St. Helens, OR Photos
Rankings & Articles For St. Helens


Locations Around St. Helens
Map Of St. Helens, OR
Best Places Around St. Helens
Woodland, WA
Population 6,487
Kelso, WA
Population 12,684
Columbia, PA
Population 10,278
Battle Ground, WA
Population 21,886
Hazel Dell, WA
Population 23,237
Vancouver, WA
Population 195,300
Mount Vista, WA
Population 10,764
Five Corners, WA
Population 21,194
Orchards, WA
Population 29,438
St. Helens Demographics And Statistics
Population over time in St. Helens
The current population in St. Helens is 14,258. The population has increased 13.7% from 2010.
| Year | Population | % Change |
|---|---|---|
| 2024 | 14,258 | 0.7% |
| 2023 | 14,152 | 1.0% |
| 2022 | 14,015 | 1.5% |
| 2021 | 13,808 | 0.2% |
| 2020 | 13,779 | 1.6% |
| 2019 | 13,559 | 0.8% |
| 2018 | 13,446 | 1.4% |
| 2017 | 13,254 | 0.6% |
| 2016 | 13,169 | 0.9% |
| 2015 | 13,055 | 0.3% |
| 2014 | 13,017 | 0.2% |
| 2013 | 12,985 | 1.4% |
| 2012 | 12,807 | 0.8% |
| 2011 | 12,706 | 1.3% |
| 2010 | 12,544 | - |
Race / Ethnicity in St. Helens
See the full breakdown
St. Helens is:
80.7% White with 11,507 White residents.
0.1% African American with 14 African American residents.
0.5% American Indian with 68 American Indian residents.
0.3% Asian with 47 Asian residents.
0.1% Hawaiian with 8 Hawaiian residents.
0.6% Other with 89 Other residents.
8.4% Two Or More with 1,198 Two Or More residents.
9.3% Hispanic with 1,327 Hispanic residents.
| Race | St. Helens | OR | USA |
|---|---|---|---|
| White | 80.7% | 71.4% | 57.4% |
| African American | 0.1% | 1.8% | 11.9% |
| American Indian | 0.5% | 0.6% | 0.5% |
| Asian | 0.3% | 4.4% | 5.9% |
| Hawaiian | 0.1% | 0.4% | 0.2% |
| Other | 0.6% | 0.6% | 0.6% |
| Two Or More | 8.4% | 6.1% | 4.3% |
| Hispanic | 9.3% | 14.7% | 19.3% |
Gender in St. Helens
See the full breakdown
St. Helens is 48.5% female with 6,915 female residents.
St. Helens is 51.5% male with 7,342 male residents.
| Gender | St. Helens | OR | USA |
|---|---|---|---|
| Female | 48.5% | 50.1% | 50.5% |
| Male | 51.5% | 49.9% | 49.5% |
Highest level of educational attainment in St. Helens for adults over 25
See the full breakdown
4.0% of adults in St. Helens completed < 9th grade.
6.0% of adults in St. Helens completed 9-12th grade.
40.0% of adults in St. Helens completed high school / ged.
25.0% of adults in St. Helens completed some college.
8.0% of adults in St. Helens completed associate's degree.
11.0% of adults in St. Helens completed bachelor's degree.
4.0% of adults in St. Helens completed master's degree.
1.0% of adults in St. Helens completed professional degree.
1.0% of adults in St. Helens completed doctorate degree.
| Education | St. Helens | OR | USA |
|---|---|---|---|
| < 9th Grade | 4.0% | 3.0% | 4.0% |
| 9-12th Grade | 6.0% | 5.0% | 6.0% |
| High School / GED | 40.0% | 22.0% | 26.0% |
| Some College | 25.0% | 24.0% | 19.0% |
| Associate's Degree | 8.0% | 9.0% | 9.0% |
| Bachelor's Degree | 11.0% | 23.0% | 22.0% |
| Master's Degree | 4.0% | 10.0% | 10.0% |
| Professional Degree | 1.0% | 2.0% | 2.0% |
| Doctorate Degree | 1.0% | 2.0% | 2.0% |
Household Income For St. Helens, Oregon
See the full breakdown
3.3% of households in St. Helens earn Less than $10,000.
3.7% of households in St. Helens earn $10,000 to $14,999.
4.9% of households in St. Helens earn $15,000 to $24,999.
5.6% of households in St. Helens earn $25,000 to $34,999.
8.7% of households in St. Helens earn $35,000 to $49,999.
18.8% of households in St. Helens earn $50,000 to $74,999.
17.7% of households in St. Helens earn $75,000 to $99,999.
21.3% of households in St. Helens earn $100,000 to $149,999.
9.6% of households in St. Helens earn $150,000 to $199,999.
6.5% of households in St. Helens earn $200,000 or more.
| Income | St. Helens | OR | USA |
|---|---|---|---|
| Less than $10,000 | 3.3% | 4.5% | 5.0% |
| $10,000 to $14,999 | 3.7% | 3.2% | 3.4% |
| $15,000 to $24,999 | 4.9% | 6.1% | 6.3% |
| $25,000 to $34,999 | 5.6% | 6.2% | 6.6% |
| $35,000 to $49,999 | 8.7% | 10.0% | 10.1% |
| $50,000 to $74,999 | 18.8% | 15.4% | 15.5% |
| $75,000 to $99,999 | 17.7% | 13.2% | 12.6% |
| $100,000 to $149,999 | 21.3% | 18.5% | 17.5% |
| $150,000 to $199,999 | 9.6% | 10.1% | 9.6% |
| $200,000 or more | 6.5% | 12.7% | 13.4% |
Source: U.S. Census ACS 5-year estimates (2024)


