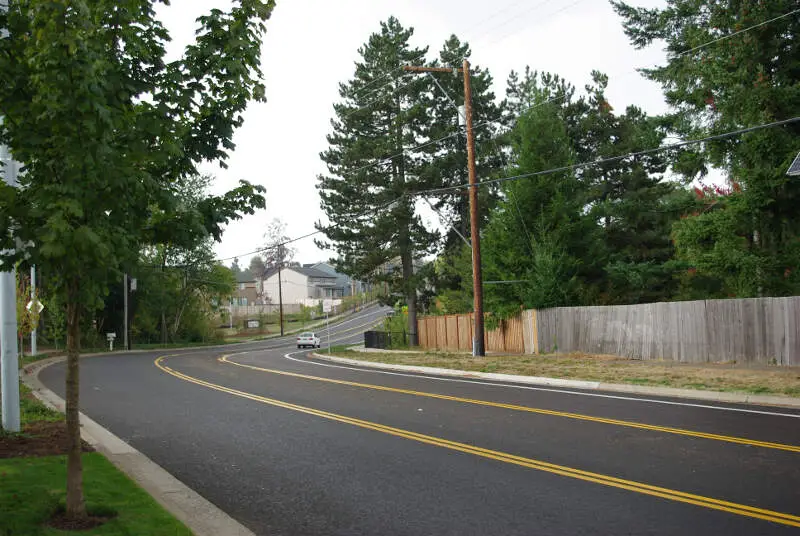
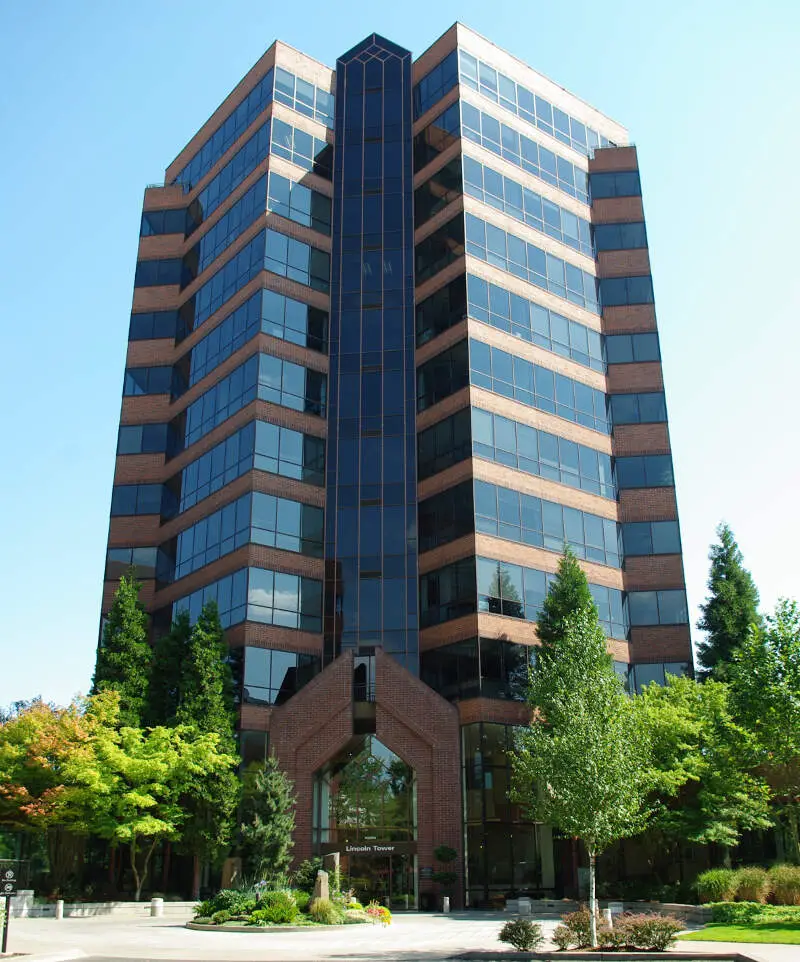
Tigard, OR
Demographics And Statistics
Living In Tigard, Oregon Summary
Life in Tigard research summary. HomeSnacks has been using Saturday Night Science to research the quality of life in Tigard over the past nine years using Census, FBI, Zillow, and other primary data sources. Based on the most recently available data, we found the following about life in Tigard:
The population in Tigard is 55,395.
The median home value in Tigard is $606,803.
The median income in Tigard is $105,008.
The cost of living in Tigard is 139 which is 1.4x higher than the national average.
The median rent in Tigard is $1,732.
The unemployment rate in Tigard is 4.9%.
The poverty rate in Tigard is 7.9%.
The average high in Tigard is 63.0° and the average low is 43.7°.
Tigard SnackAbility
Overall SnackAbility
Tigard, OR Crime Report
Crime in Tigard summary. We use data from the FBI to determine the crime rates in Tigard. Key points include:
There were 2,109 total crimes in Tigard in the last reporting year.
The overall crime rate per 100,000 people in Tigard is 3,780.7 / 100k people.
The violent crime rate per 100,000 people in Tigard is 317.3 / 100k people.
The property crime rate per 100,000 people in Tigard is 3,463.4 / 100k people.
Overall, crime in Tigard is 78.40% above the national average.
Total Crimes
Above National Average
Crime In Tigard Comparison Table
| Statistic | Count Raw |
Tigard / 100k People |
Oregon / 100k People |
National / 100k People |
|---|---|---|---|---|
| Total Crimes Per 100K | 2,109 | 3,780.7 | 2,719.1 | 2,119.2 |
| Violent Crime | 177 | 317.3 | 331.0 | 359.0 |
| Murder | 0 | 0.0 | 3.7 | 5.0 |
| Robbery | 51 | 91.4 | 57.0 | 61.0 |
| Aggravated Assault | 106 | 190.0 | 229.1 | 256.0 |
| Property Crime | 1,932 | 3,463.4 | 2,388.0 | 1,760.0 |
| Burglary | 206 | 369.3 | 306.5 | 229.0 |
| Larceny | 1,620 | 2,904.1 | 1,789.5 | 1,272.0 |
| Car Theft | 106 | 190.0 | 292.1 | 259.0 |
Tigard, OR Cost Of Living
Cost of living in Tigard summary. We use data on the cost of living to determine how expensive it is to live in Tigard. Real estate prices drive most of the variance in cost of living around Oregon. Key points include:
The cost of living in Tigard is 139 with 100 being average.
The cost of living in Tigard is 1.4x higher than the national average.
The median home value in Tigard is $606,803.
The median income in Tigard is $105,008.
Tigard's Overall Cost Of Living
Higher Than The National Average
Cost Of Living In Tigard Comparison Table
| Living Expense | Tigard | Oregon | National Average | |
|---|---|---|---|---|
| Overall | 139 | 112 | 100 | |
| Services | 108 | 107 | 100 | |
| Groceries | 110 | 107 | 100 | |
| Health | 112 | 104 | 100 | |
| Housing | 207 | 124 | 100 | |
| Transportation | 125 | 116 | 100 | |
| Utilities | 95 | 97 | 100 | |
Tigard, OR Weather
The average high in Tigard is 63.0° and the average low is 43.7°.
There are 94.7 days of precipitation each year.
Expect an average of 40.2 inches of precipitation each year with 1.6 inches of snow.
| Stat | Tigard |
|---|---|
| Average Annual High | 63.0 |
| Average Annual Low | 43.7 |
| Annual Precipitation Days | 94.7 |
| Average Annual Precipitation | 40.2 |
| Average Annual Snowfall | 1.6 |
Average High
Days of Rain
Tigard, OR Photos


1 Reviews & Comments About Tigard
/5

HomeSnacks User - 2018-08-03 01:29:23.875031
My hometown I grew up in has changed some. But still a small town feel. Most of the time.
The high school football games. Great way for families and community to come together on a Friday night.
Rankings for Tigard in Oregon


Locations Around Tigard
Map Of Tigard, OR
Best Places Around Tigard
Oregon, WI
Population 11,384
Hazel Dell, WA
Population 23,086
Vancouver, WA
Population 192,696
Lake Oswego, OR
Population 40,367
West Linn, OR
Population 27,065
Sherwood, OR
Population 20,227
Bethany, OR
Population 31,700
Oatfield, OR
Population 12,709
Bull Mountain, OR
Population 9,465
Tigard Demographics And Statistics
Population over time in Tigard
The current population in Tigard is 55,395. The population has increased 17.3% from 2010.
| Year | Population | % Change |
|---|---|---|
| 2023 | 55,395 | 0.4% |
| 2022 | 55,161 | 0.8% |
| 2021 | 54,750 | 1.1% |
| 2020 | 54,149 | 1.6% |
| 2019 | 53,312 | 1.8% |
| 2018 | 52,368 | 2.0% |
| 2017 | 51,355 | 1.1% |
| 2016 | 50,787 | 1.0% |
| 2015 | 50,276 | 1.3% |
| 2014 | 49,633 | 1.2% |
| 2013 | 49,024 | 1.4% |
| 2012 | 48,366 | 1.3% |
| 2011 | 47,759 | 1.1% |
| 2010 | 47,244 | - |
Race / Ethnicity in Tigard
Tigard is:
68.7% White with 38,075 White residents.
1.2% African American with 642 African American residents.
0.3% American Indian with 181 American Indian residents.
9.2% Asian with 5,119 Asian residents.
0.4% Hawaiian with 230 Hawaiian residents.
0.6% Other with 305 Other residents.
6.7% Two Or More with 3,689 Two Or More residents.
12.9% Hispanic with 7,154 Hispanic residents.
| Race | Tigard | OR | USA |
|---|---|---|---|
| White | 68.7% | 72.3% | 58.2% |
| African American | 1.2% | 1.8% | 12.0% |
| American Indian | 0.3% | 0.7% | 0.5% |
| Asian | 9.2% | 4.4% | 5.7% |
| Hawaiian | 0.4% | 0.4% | 0.2% |
| Other | 0.6% | 0.5% | 0.5% |
| Two Or More | 6.7% | 5.6% | 3.9% |
| Hispanic | 12.9% | 14.3% | 19.0% |
Gender in Tigard
Tigard is 50.6% female with 28,023 female residents.
Tigard is 49.4% male with 27,372 male residents.
| Gender | Tigard | OR | USA |
|---|---|---|---|
| Female | 50.6% | 50.1% | 50.5% |
| Male | 49.4% | 49.9% | 49.5% |
Highest level of educational attainment in Tigard for adults over 25
2.0% of adults in Tigard completed < 9th grade.
3.0% of adults in Tigard completed 9-12th grade.
14.0% of adults in Tigard completed high school / ged.
22.0% of adults in Tigard completed some college.
10.0% of adults in Tigard completed associate's degree.
32.0% of adults in Tigard completed bachelor's degree.
12.0% of adults in Tigard completed master's degree.
3.0% of adults in Tigard completed professional degree.
2.0% of adults in Tigard completed doctorate degree.
| Education | Tigard | OR | USA |
|---|---|---|---|
| < 9th Grade | 2.0% | 4.0% | 5.0% |
| 9-12th Grade | 3.0% | 5.0% | 6.0% |
| High School / GED | 14.0% | 22.0% | 26.0% |
| Some College | 22.0% | 24.0% | 19.0% |
| Associate's Degree | 10.0% | 9.0% | 9.0% |
| Bachelor's Degree | 32.0% | 22.0% | 21.0% |
| Master's Degree | 12.0% | 10.0% | 10.0% |
| Professional Degree | 3.0% | 2.0% | 2.0% |
| Doctorate Degree | 2.0% | 2.0% | 2.0% |
Household Income For Tigard, Oregon
2.9% of households in Tigard earn Less than $10,000.
1.8% of households in Tigard earn $10,000 to $14,999.
4.6% of households in Tigard earn $15,000 to $24,999.
6.0% of households in Tigard earn $25,000 to $34,999.
7.1% of households in Tigard earn $35,000 to $49,999.
13.1% of households in Tigard earn $50,000 to $74,999.
12.5% of households in Tigard earn $75,000 to $99,999.
20.6% of households in Tigard earn $100,000 to $149,999.
13.1% of households in Tigard earn $150,000 to $199,999.
18.3% of households in Tigard earn $200,000 or more.
| Income | Tigard | OR | USA |
|---|---|---|---|
| Less than $10,000 | 2.9% | 4.4% | 4.9% |
| $10,000 to $14,999 | 1.8% | 3.4% | 3.6% |
| $15,000 to $24,999 | 4.6% | 6.3% | 6.6% |
| $25,000 to $34,999 | 6.0% | 6.4% | 6.8% |
| $35,000 to $49,999 | 7.1% | 10.5% | 10.4% |
| $50,000 to $74,999 | 13.1% | 15.9% | 15.7% |
| $75,000 to $99,999 | 12.5% | 13.3% | 12.7% |
| $100,000 to $149,999 | 20.6% | 18.5% | 17.4% |
| $150,000 to $199,999 | 13.1% | 9.6% | 9.3% |
| $200,000 or more | 18.3% | 11.8% | 12.6% |


