Allentown SnackAbility
Overall SnackAbility
Crime in Allentown summary. We use data from the FBI to determine the crime rates in Allentown. Key points include:
There were 2,294 total crimes in Allentown in the last reporting year.
The overall crime rate per 100,000 people in Allentown is 1,841.1 / 100k people.
The violent crime rate per 100,000 people in Allentown is 272.1 / 100k people.
The property crime rate per 100,000 people in Allentown is 1,569.0 / 100k people.
Overall, crime in Allentown is -13.12% below the national average.
Total Crimes
Below National Average
Crime In Allentown Comparison Table
| Statistic | Count Raw |
Allentown / 100k People |
Pennsylvania / 100k People |
National / 100k People |
|---|---|---|---|---|
| Total Crimes Per 100K | 2,294 | 1,841.1 | 1,680.6 | 2,119.2 |
| Violent Crime | 339 | 272.1 | 245.6 | 359.0 |
| Murder | 4 | 3.2 | 5.0 | 5.0 |
| Robbery | 71 | 57.0 | 51.4 | 61.0 |
| Aggravated Assault | 231 | 185.4 | 161.4 | 256.0 |
| Property Crime | 1,955 | 1,569.0 | 1,435.0 | 1,760.0 |
| Burglary | 151 | 121.2 | 116.7 | 229.0 |
| Larceny | 1,560 | 1,252.0 | 1,129.8 | 1,272.0 |
| Car Theft | 244 | 195.8 | 188.5 | 259.0 |
Source: FBI Uniform Crime Reporting (2024)
Cost of living in Allentown summary. We use data on the cost of living to determine how expensive it is to live in Allentown. Real estate prices drive most of the variance in cost of living around Pennsylvania. Key points include:
The cost of living in Allentown is 98 with 100 being average.
The cost of living in Allentown is 1.0x lower than the national average.
The median home value in Allentown is $309,698.
The median income in Allentown is $55,494.
Allentown's Overall Cost Of Living
Lower Than The National Average
Cost Of Living In Allentown Comparison Table
| Living Expense | Allentown | Pennsylvania | National Average |
|---|---|---|---|
| Overall | 98 | 97 | 100 |
| Services | 97 | 99 | 100 |
| Groceries | 99 | 100 | 100 |
| Health | 85 | 88 | 100 |
| Housing | 104 | 102 | 100 |
| Transportation | 100 | 100 | 100 |
| Utilities | 104 | 101 | 100 |
Source: Cost of living index, normalized to US average = 100
Allentown, PA Weather
The average high in Allentown is 61.8° and the average low is 41.8°.
There are 76.8 days of precipitation each year.
Expect an average of 45.6 inches of precipitation each year with 31.5 inches of snow.
| Stat | Allentown |
|---|---|
| Average Annual High | 61.8 |
| Average Annual Low | 41.8 |
| Annual Precipitation Days | 76.8 |
| Average Annual Precipitation | 45.6 |
| Average Annual Snowfall | 31.5 |
Average High
Days of Rain
Source: NOAA climate normals (30-year)
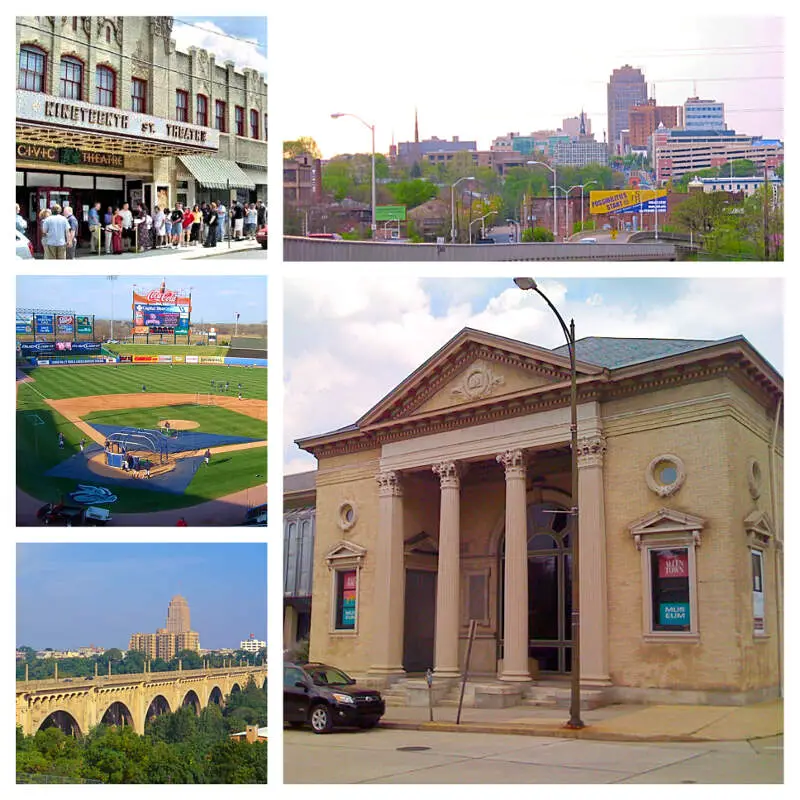
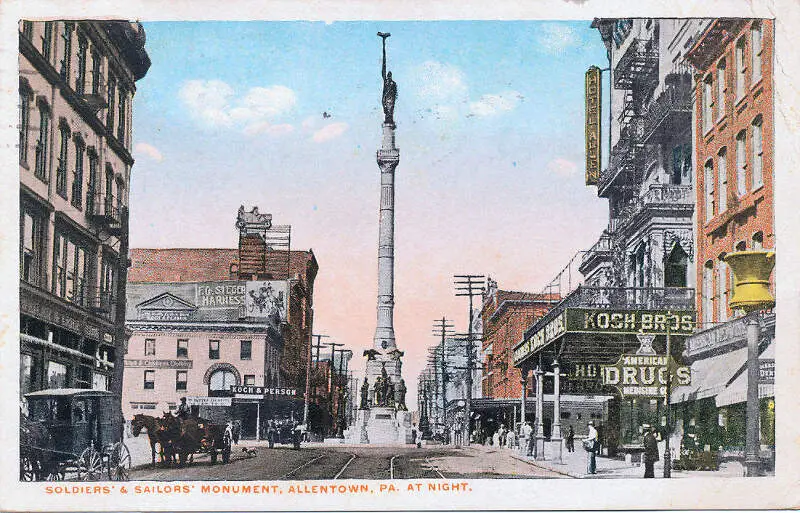
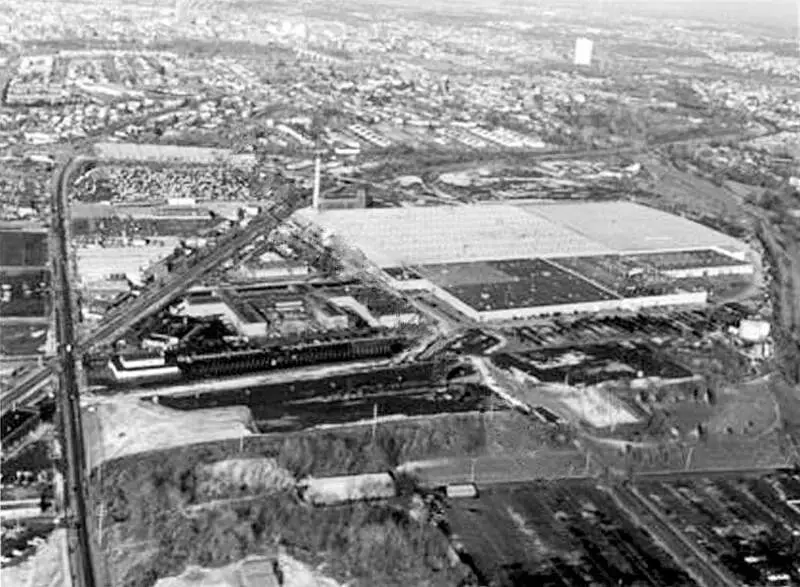
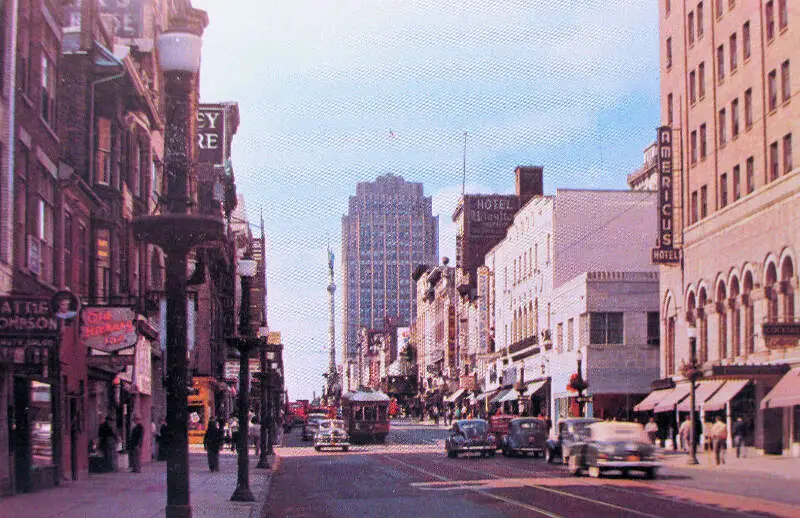
Allentown, PA Photos


Rankings & Articles For Allentown


Locations Around Allentown
Map Of Allentown, PA
Best Places Around Allentown
Hamilton Square, NJ
Population 11,622
Yardville, NJ
Population 6,301
Mercerville, NJ
Population 13,535
White Horse, NJ
Population 10,507
Twin Rivers, NJ
Population 8,382
Fort Dix, NJ
Population 7,984
Yorketown, NJ
Population 7,261
Levittown, PA
Population 50,926
Kendall Park, NJ
Population 10,011
West Freehold, NJ
Population 14,883
Allentown Demographics And Statistics
Population over time in Allentown
The current population in Allentown is 125,976. The population has increased 8.2% from 2010.
| Year | Population | % Change |
|---|---|---|
| 2024 | 125,976 | 0.5% |
| 2023 | 125,320 | 0.0% |
| 2022 | 125,292 | 0.0% |
| 2021 | 125,250 | 3.4% |
| 2020 | 121,156 | 0.2% |
| 2019 | 120,915 | 0.4% |
| 2018 | 120,410 | 0.2% |
| 2017 | 120,128 | 0.4% |
| 2016 | 119,624 | 0.3% |
| 2015 | 119,261 | 0.4% |
| 2014 | 118,793 | 0.4% |
| 2013 | 118,285 | 0.3% |
| 2012 | 117,942 | 0.5% |
| 2011 | 117,386 | 0.8% |
| 2010 | 116,398 | - |
Race / Ethnicity in Allentown
See the full breakdown
Allentown is:
28.9% White with 36,350 White residents.
9.8% African American with 12,357 African American residents.
0.0% American Indian with 25 American Indian residents.
1.9% Asian with 2,419 Asian residents.
0.0% Hawaiian with 1 Hawaiian residents.
0.6% Other with 728 Other residents.
2.5% Two Or More with 3,144 Two Or More residents.
56.3% Hispanic with 70,952 Hispanic residents.
| Race | Allentown | PA | USA |
|---|---|---|---|
| White | 28.9% | 73.0% | 57.4% |
| African American | 9.8% | 10.3% | 11.9% |
| American Indian | 0.0% | 0.1% | 0.5% |
| Asian | 1.9% | 3.8% | 5.9% |
| Hawaiian | 0.0% | 0.0% | 0.2% |
| Other | 0.6% | 0.5% | 0.6% |
| Two Or More | 2.5% | 3.6% | 4.3% |
| Hispanic | 56.3% | 8.7% | 19.3% |
Gender in Allentown
See the full breakdown
Allentown is 51.4% female with 64,721 female residents.
Allentown is 48.6% male with 61,254 male residents.
| Gender | Allentown | PA | USA |
|---|---|---|---|
| Female | 51.4% | 50.7% | 50.5% |
| Male | 48.6% | 49.3% | 49.5% |
Highest level of educational attainment in Allentown for adults over 25
See the full breakdown
9.0% of adults in Allentown completed < 9th grade.
10.0% of adults in Allentown completed 9-12th grade.
39.0% of adults in Allentown completed high school / ged.
16.0% of adults in Allentown completed some college.
7.0% of adults in Allentown completed associate's degree.
13.0% of adults in Allentown completed bachelor's degree.
4.0% of adults in Allentown completed master's degree.
1.0% of adults in Allentown completed professional degree.
1.0% of adults in Allentown completed doctorate degree.
| Education | Allentown | PA | USA |
|---|---|---|---|
| < 9th Grade | 9.0% | 3.0% | 4.0% |
| 9-12th Grade | 10.0% | 5.0% | 6.0% |
| High School / GED | 39.0% | 33.0% | 26.0% |
| Some College | 16.0% | 15.0% | 19.0% |
| Associate's Degree | 7.0% | 9.0% | 9.0% |
| Bachelor's Degree | 13.0% | 21.0% | 22.0% |
| Master's Degree | 4.0% | 10.0% | 10.0% |
| Professional Degree | 1.0% | 2.0% | 2.0% |
| Doctorate Degree | 1.0% | 2.0% | 2.0% |
Household Income For Allentown, Pennsylvania
See the full breakdown
4.7% of households in Allentown earn Less than $10,000.
6.1% of households in Allentown earn $10,000 to $14,999.
10.0% of households in Allentown earn $15,000 to $24,999.
10.7% of households in Allentown earn $25,000 to $34,999.
14.1% of households in Allentown earn $35,000 to $49,999.
20.5% of households in Allentown earn $50,000 to $74,999.
12.1% of households in Allentown earn $75,000 to $99,999.
13.0% of households in Allentown earn $100,000 to $149,999.
5.3% of households in Allentown earn $150,000 to $199,999.
3.5% of households in Allentown earn $200,000 or more.
| Income | Allentown | PA | USA |
|---|---|---|---|
| Less than $10,000 | 4.7% | 4.9% | 5.0% |
| $10,000 to $14,999 | 6.1% | 3.5% | 3.4% |
| $15,000 to $24,999 | 10.0% | 6.7% | 6.3% |
| $25,000 to $34,999 | 10.7% | 6.9% | 6.6% |
| $35,000 to $49,999 | 14.1% | 10.5% | 10.1% |
| $50,000 to $74,999 | 20.5% | 15.9% | 15.5% |
| $75,000 to $99,999 | 12.1% | 12.8% | 12.6% |
| $100,000 to $149,999 | 13.0% | 17.7% | 17.5% |
| $150,000 to $199,999 | 5.3% | 9.3% | 9.6% |
| $200,000 or more | 3.5% | 11.8% | 13.4% |
Source: U.S. Census ACS 5-year estimates (2024)


