100 Biggest Cities In Pennsylvania For 2026
Using the latest Census data, we detail the 100 biggest cities in Pennsylvania. You can all see a comprehensive list of all 941 cities and places in Pennsylvania.

We all love the biggest cities that the Keystone State has to offer. You know the places like Philadelphia and Pittsburgh which make all the headlines.
But there are a bunch of other great large cities in Pennsylvania that don't get as much love.
We're going to change that right now.
Using the most recent Census data, we can tell you about all the places in Pennsylvania with a focus on the biggest. We update the data each year and this is our fourth time doing this.
Table Of Contents: Top Ten | Methodology | Table
The Largest Cities In Pennsylvania For 2026:
You can click here to see a full table of the full of the 100 biggest cities in Pennsylvania, along with every other place over 1,000 people big. It is sortable by clicking on the headers.
Read on below to see more on the biggest cities. Or for more reading on places to live in Pennsylvania, check out:
- Best Places To Live In Pennsylvania
- Cheapest Places To Live In Pennsylvania
- Most Dangerous Cities In Pennsylvania
The 10 Biggest Cities In Pennsylvania

/10
Rank Last Year: 1 (No Change)
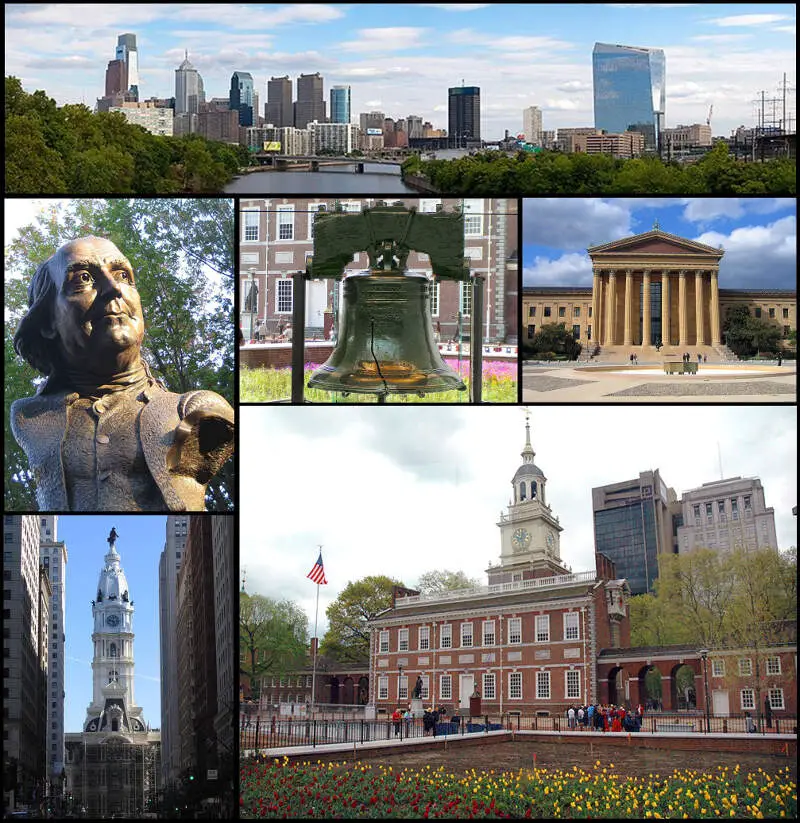
Population: 1,579,706.0
Population 2010: 1,504,950
Growth: 5.0%
More on Philadelphia: Data | Cost Of Living | Real Estate

/10
Rank Last Year: 2 (No Change)
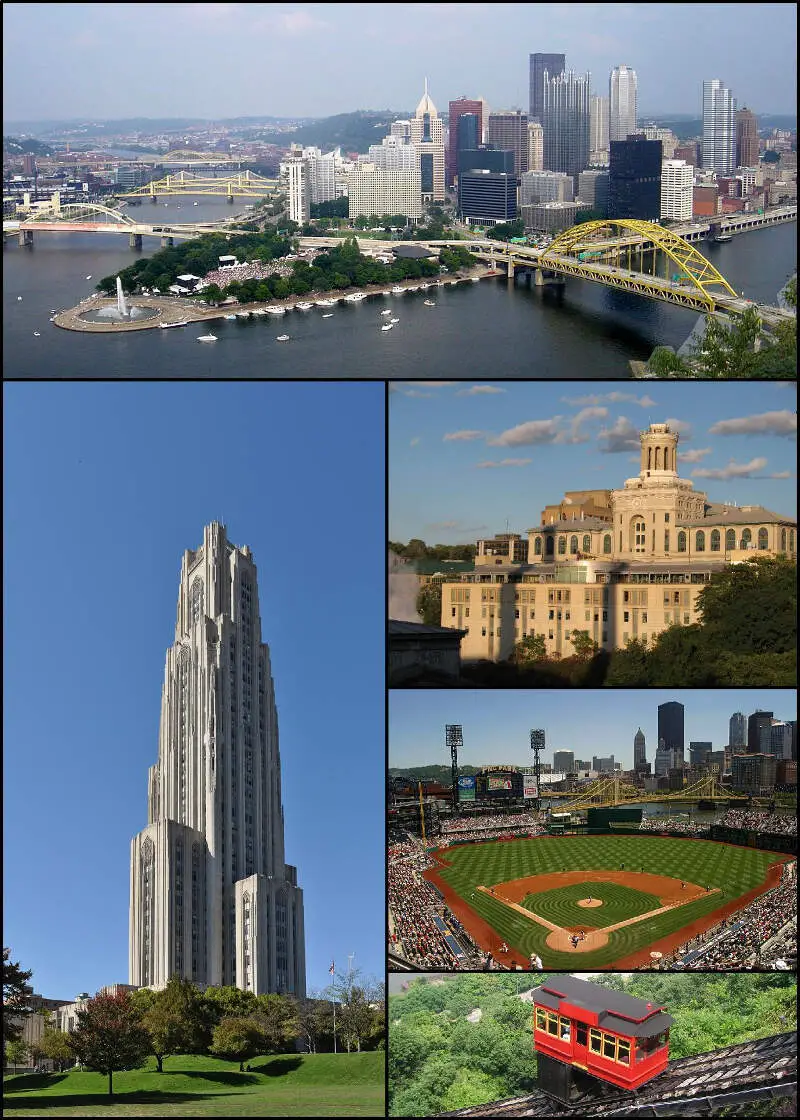
Population: 304,759.0
Population 2010: 308,003
Growth: -1.1%
More on Pittsburgh: Data | Cost Of Living | Real Estate

/10
Rank Last Year: 3 (No Change)
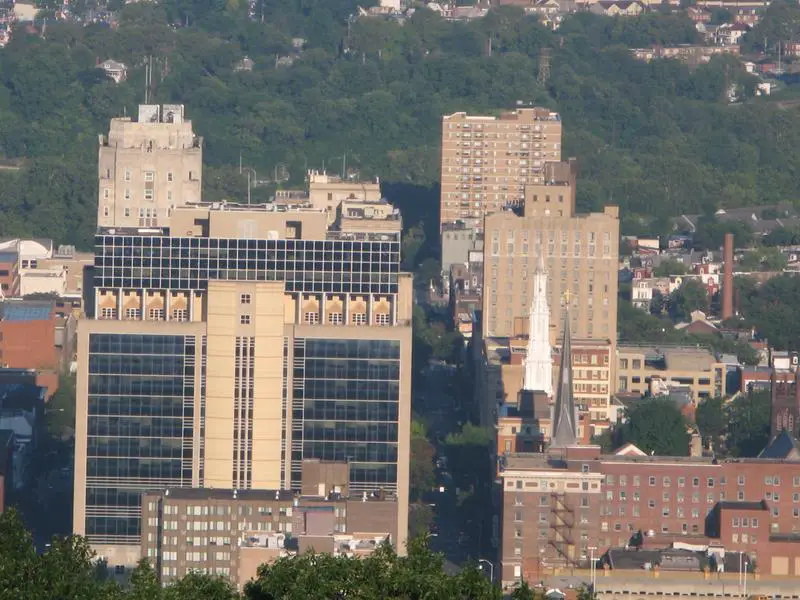
Population: 125,976.0
Population 2010: 116,398
Growth: 8.2%
More on Allentown: Data | Crime | Cost Of Living | Real Estate

/10
Rank Last Year: 4 (No Change)
Population: 95,242.0
Population 2010: 87,404
Growth: 9.0%
More on Reading: Data | Cost Of Living | Real Estate

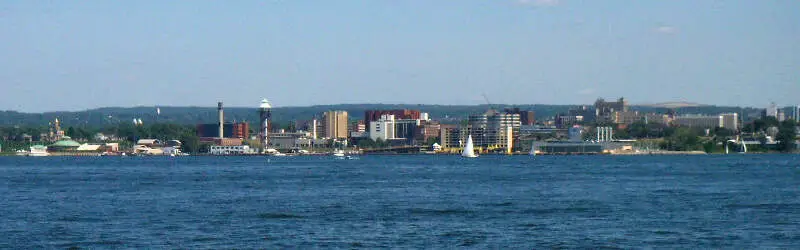
/10
Rank Last Year: 5 (No Change)
Population: 93,850.0
Population 2010: 101,635
Growth: -7.7%
More on Erie: Data | Crime | Cost Of Living | Real Estate

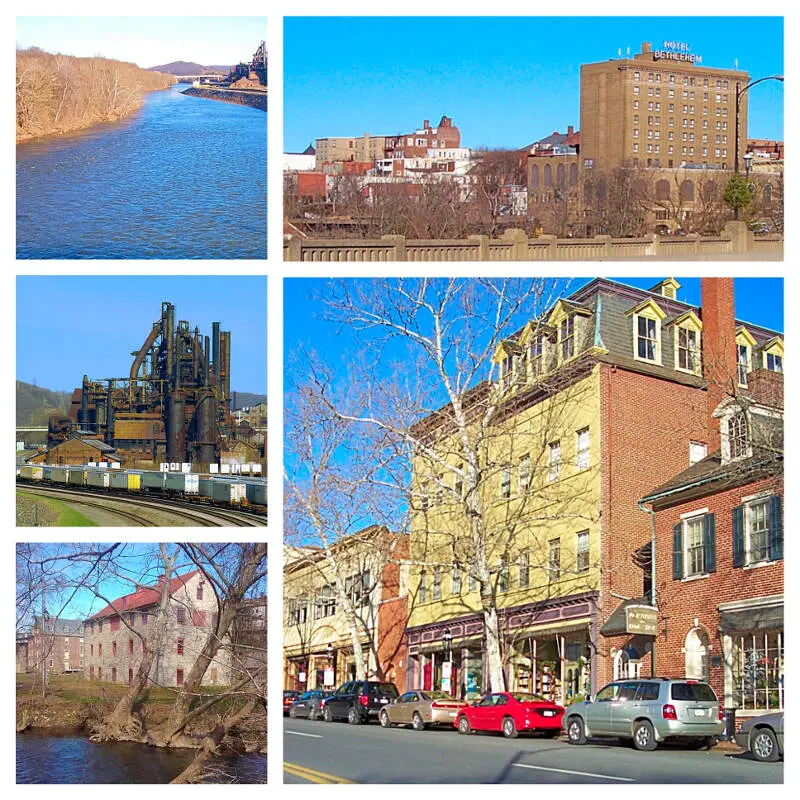
/10
Rank Last Year: 6 (No Change)
Population: 77,956.0
Population 2010: 74,752
Growth: 4.3%
More on Bethlehem: Data | Cost Of Living | Real Estate

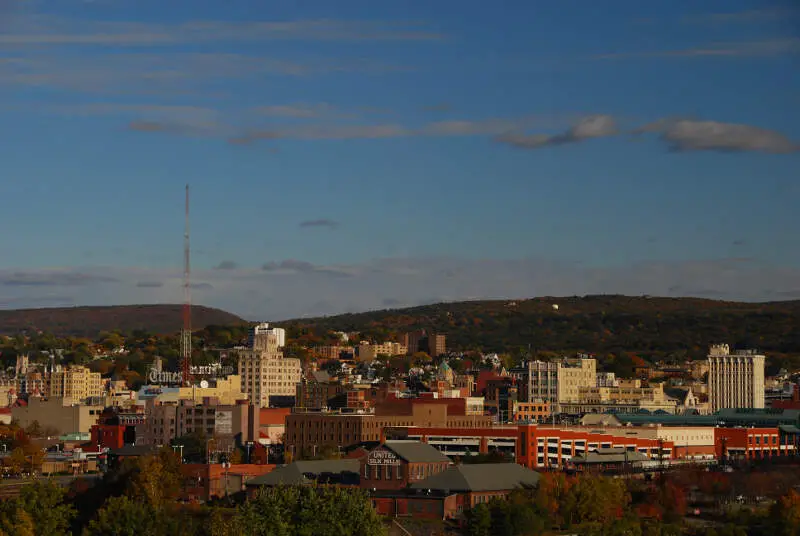
/10
Rank Last Year: 7 (No Change)
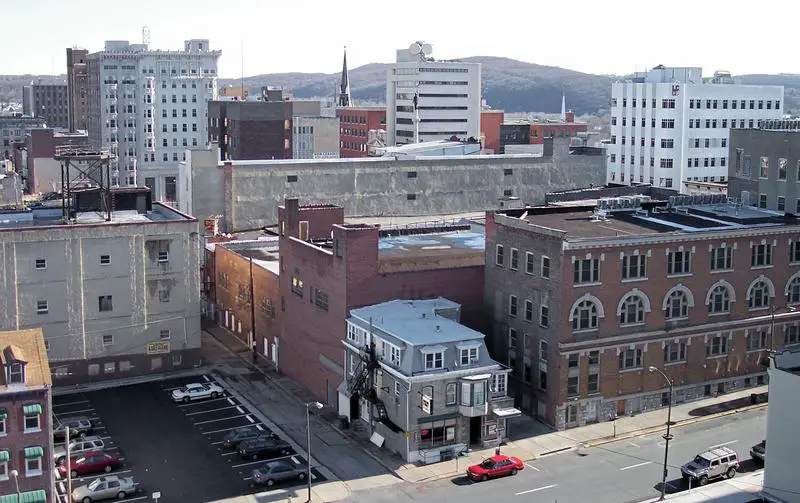
Population: 76,033.0
Population 2010: 76,065
Growth: -0.0%
More on Scranton: Data | Crime | Cost Of Living | Real Estate

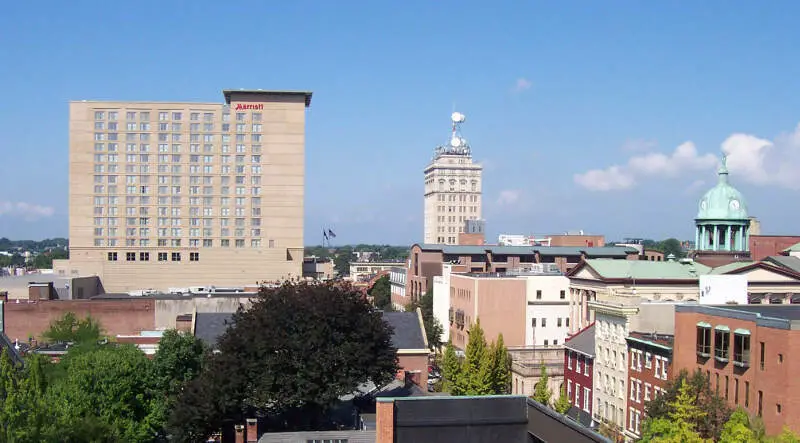
/10
Rank Last Year: 8 (No Change)
Population: 57,719.0
Population 2010: 58,819
Growth: -1.9%
More on Lancaster: Data | Cost Of Living | Real Estate

/10
Rank Last Year: 9 (No Change)
Population: 50,926.0
Population 2010: 51,990
Growth: -2.0%
More on Levittown: Data | Cost Of Living | Real Estate


/10
Rank Last Year: 10 (No Change)
Population: 50,287.0
Population 2010: 49,332
Growth: 1.9%
More on Harrisburg: Data | Crime | Cost Of Living | Real Estate
How We Determined The Largest Cities In Pennsylvania
We've been ranking and dissecting cities in the Keystone State for over 4 years now -- making this actually the fourth time we've run the numbers. We always use the best data, the US Census. In this case, that means we are using the American Community Survey.
It what is probably the most simple analysis we run each year, we ranked every place in Pennsylvania from biggest to smallest. The biggest city this year? That would be Philadelphia.
The smallest? Upper Exeter, although there are places smaller than 1,000 people not listed here, so keep that in mind as we take a look at the top ten.
Now on to numbers 11-100 Biggest in Pennsylvania
We hope that you find the big city, or really any city, that's right for you. Below is a list of the rest of the biggest cities along with every other place in Pennsylvania.
Have fun snacking around in the Keystone State!
For more reading on Pennsylvania, check out:
- Best Places To Raise A Family In Pennsylvania
- Best Places To Retire In Pennsylvania
- Richest Cities In Pennsylvania
- Safest Places In Pennsylvania
- Worst Places To Live In Pennsylvania
- Most Expensive Places To Live In Pennsylvania
Detailed List Of The Biggest Cities In Pennsylvania
| Rank | City | Current Population | 2010 | Growth | |||||
|---|---|---|---|---|---|---|---|---|---|
| 1 | Philadelphia | 1,579,706.0 | 1,504,950 | 5.0% | |||||
| 2 | Pittsburgh | 304,759.0 | 308,003 | -1.1% | |||||
| 3 | Allentown | 125,976.0 | 116,398 | 8.2% | |||||
| 4 | Reading | 95,242.0 | 87,404 | 9.0% | |||||
| 5 | Erie | 93,850.0 | 101,635 | -7.7% | |||||
| 6 | Bethlehem | 77,956.0 | 74,752 | 4.3% | |||||
| 7 | Scranton | 76,033.0 | 76,065 | -0.0% | |||||
| 8 | Lancaster | 57,719.0 | 58,819 | -1.9% | |||||
| 9 | Levittown | 50,926.0 | 51,990 | -2.0% | |||||
| 10 | Harrisburg | 50,287.0 | 49,332 | 1.9% | |||||
| 11 | York | 44,938.0 | 43,592 | 3.1% | |||||
| 12 | Wilkes-Barre | 44,423.0 | 41,595 | 6.8% | |||||
| 13 | Altoona | 43,196.0 | 46,883 | -7.9% | |||||
| 14 | State College | 41,050.0 | 41,876 | -2.0% | |||||
| 15 | Norri | 35,893.0 | 33,783 | 6.2% | |||||
| 16 | Chester | 33,619.0 | 34,464 | -2.5% | |||||
| 17 | Drexel Hill | 30,451.0 | 28,659 | 6.3% | |||||
| 18 | Hazleton | 30,111.0 | 24,877 | 21.0% | |||||
| 19 | Easton | 29,739.0 | 26,902 | 10.5% | |||||
| 20 | Williamsport | 27,612.0 | 29,508 | -6.4% | |||||
| 21 | Plum | 26,723.0 | 26,849 | -0.5% | |||||
| 22 | Lebanon | 26,536.0 | 25,412 | 4.4% | |||||
| 23 | King Of Prussia | 25,857.0 | 19,735 | 31.0% | |||||
| 24 | Pott | 23,476.0 | 22,302 | 5.3% | |||||
| 25 | Chambersburg | 22,319.0 | 19,924 | 12.0% | |||||
| 26 | Allison Park | 22,045.0 | 22,293 | -1.1% | |||||
| 27 | Carlisle | 21,852.0 | 18,516 | 18.0% | |||||
| 28 | New Castle | 21,579.0 | 23,836 | -9.5% | |||||
| 29 | Baldwin | 21,057.0 | 19,622 | 7.3% | |||||
| 30 | West Chester | 20,666.0 | 18,530 | 11.5% | |||||
| 31 | Phoenixville | 19,452.0 | 16,249 | 19.7% | |||||
| 32 | West Mifflin | 19,190.0 | 20,497 | -6.4% | |||||
| 33 | Lansdale | 19,011.0 | 16,211 | 17.3% | |||||
| 34 | Johnstown | 18,087.0 | 21,448 | -15.7% | |||||
| 35 | Colonial Park | 18,032.0 | 13,114 | 37.5% | |||||
| 36 | Mckeesport | 17,380.0 | 20,341 | -14.6% | |||||
| 37 | Fullerton | 16,724.0 | 15,051 | 11.1% | |||||
| 38 | Hanover | 16,584.0 | 15,256 | 8.7% | |||||
| 39 | Hermitage | 16,041.0 | 16,155 | -0.7% | |||||
| 40 | Horsham | 16,005.0 | 14,413 | 11.0% | |||||
| 41 | Weigelstown | 15,485.0 | 12,917 | 19.9% | |||||
| 42 | Franklin Park | 15,235.0 | 12,985 | 17.3% | |||||
| 43 | Whitehall | 14,811.0 | 13,921 | 6.4% | |||||
| 44 | Greensburg | 14,741.0 | 15,037 | -2.0% | |||||
| 45 | Hershey | 14,242.0 | 13,082 | 8.9% | |||||
| 46 | Indiana | 14,212.0 | 14,064 | 1.1% | |||||
| 47 | Dunmore | 14,181.0 | 14,092 | 0.6% | |||||
| 48 | Willow Grove | 14,131.0 | 16,456 | -14.1% | |||||
| 49 | Wilkinsburg | 14,027.0 | 16,348 | -14.2% | |||||
| 50 | Ardmore | 13,909.0 | 12,513 | 11.2% | |||||
| 51 | Ephrata | 13,772.0 | 13,384 | 2.9% | |||||
| 52 | Carnot-Moon | 13,534.0 | 11,279 | 20.0% | |||||
| 53 | Kingston | 13,397.0 | 13,244 | 1.2% | |||||
| 54 | Montgomeryville | 13,388.0 | 13,071 | 2.4% | |||||
| 55 | Washington | 13,368.0 | 13,915 | -3.9% | |||||
| 56 | Pottsville | 13,364.0 | 14,518 | -7.9% | |||||
| 57 | Coatesville | 13,353.0 | 12,774 | 4.5% | |||||
| 58 | Butler | 13,212.0 | 14,035 | -5.9% | |||||
| 59 | Bloomsburg | 13,024.0 | 14,299 | -8.9% | |||||
| 60 | Sharon | 12,936.0 | 14,456 | -10.5% | |||||
| 61 | Meadville | 12,577.0 | 13,486 | -6.7% | |||||
| 62 | St. Marys | 12,529.0 | 13,318 | -5.9% | |||||
| 63 | Jefferson Hills | 12,317.0 | 10,375 | 18.7% | |||||
| 64 | Yeadon | 12,181.0 | 11,476 | 6.1% | |||||
| 65 | New Kensington | 12,011.0 | 13,372 | -10.2% | |||||
| 66 | Elizabet | 11,925.0 | 11,591 | 2.9% | |||||
| 67 | Emmaus | 11,889.0 | 11,269 | 5.5% | |||||
| 68 | Mountain Top | 11,850.0 | 10,560 | 12.2% | |||||
| 69 | Lower Burrell | 11,633.0 | 11,906 | -2.3% | |||||
| 70 | Shiloh | 11,246.0 | 11,375 | -1.1% | |||||
| 71 | Wyomissing | 11,172.0 | 10,528 | 6.1% | |||||
| 72 | Lansdowne | 11,122.0 | 10,659 | 4.3% | |||||
| 73 | Waynesboro | 11,047.0 | 10,438 | 5.8% | |||||
| 74 | Progress | 11,017.0 | 9,568 | 15.1% | |||||
| 75 | Darby | 10,687.0 | 10,601 | 0.8% | |||||
| 76 | Broomall | 10,679.0 | 11,256 | -5.1% | |||||
| 77 | Nanticoke | 10,653.0 | 10,492 | 1.5% | |||||
| 78 | Munhall | 10,548.0 | 11,456 | -7.9% | |||||
| 79 | Northampton | 10,400.0 | 9,917 | 4.9% | |||||
| 80 | Berwick | 10,317.0 | 10,581 | -2.5% | |||||
| 81 | Columbia | 10,278.0 | 10,391 | -1.1% | |||||
| 82 | Bristol | 9,902.0 | 9,831 | 0.7% | |||||
| 83 | Brentwood | 9,866.0 | 9,711 | 1.6% | |||||
| 84 | Morrisville | 9,752.0 | 9,020 | 8.1% | |||||
| 85 | Uniontown | 9,742.0 | 10,727 | -9.2% | |||||
| 86 | Woodlyn | 9,736.0 | 9,067 | 7.4% | |||||
| 87 | Mechanicsburg | 9,720.0 | 8,981 | 8.2% | |||||
| 88 | Croydon | 9,684.0 | 10,102 | -4.1% | |||||
| 89 | Canonsburg | 9,675.0 | 8,917 | 8.5% | |||||
| 90 | Willow Street | 9,647.0 | 7,354 | 31.2% | |||||
| 91 | Middl | 9,632.0 | 8,970 | 7.4% | |||||
| 92 | Lititz | 9,619.0 | 9,298 | 3.5% | |||||
| 93 | Sunbury | 9,617.0 | 10,042 | -4.2% | |||||
| 94 | Oil City | 9,468.0 | 10,707 | -11.6% | |||||
| 95 | East York | 9,388.0 | 9,212 | 1.9% | |||||
| 96 | Quake | 9,319.0 | 9,055 | 2.9% | |||||
| 97 | East Stroudsburg | 9,319.0 | 10,000 | -6.8% | |||||
| 98 | Conshohocken | 9,282.0 | 7,789 | 19.2% | |||||
| 99 | Warren | 9,240.0 | 9,772 | -5.4% | |||||
| 100 | Audubon | 9,229.0 | 8,157 | 13.1% | |||||
| 101 | Perkasie | 9,216.0 | 8,604 | 7.1% | |||||
| 102 | Glenshaw | 9,139.0 | 9,196 | -0.6% | |||||
| 103 | Harleysville | 9,090.0 | 9,464 | -4.0% | |||||
| 104 | Aliquippa | 9,079.0 | 9,779 | -7.2% | |||||
| 105 | Village Green-Green Ridge | 9,073.0 | 7,698 | 17.9% | |||||
| 106 | Economy | 9,005.0 | 9,004 | 0.0% | |||||
| 107 | Millersville | 8,982.0 | 8,077 | 11.2% | |||||
| 108 | Sanatoga | 8,949.0 | 8,258 | 8.4% | |||||
| 109 | Collingdale | 8,897.0 | 8,757 | 1.6% | |||||
| 110 | Beaver Falls | 8,850.0 | 9,092 | -2.7% | |||||
| 111 | Fairless Hills | 8,827.0 | 8,733 | 1.1% | |||||
| 112 | Kulpsville | 8,799.0 | 7,780 | 13.1% | |||||
| 113 | Carbondale | 8,789.0 | 9,002 | -2.4% | |||||
| 114 | Northwest Harborcreek | 8,753.0 | 9,055 | -3.3% | |||||
| 115 | Folsom | 8,671.0 | 8,435 | 2.8% | |||||
| 116 | Jeannette | 8,657.0 | 9,840 | -12.0% | |||||
| 117 | Park Forest Village | 8,624.0 | 10,072 | -14.4% | |||||
| 118 | Old Forge | 8,573.0 | 8,374 | 2.4% | |||||
| 119 | Lewi | 8,479.0 | 8,422 | 0.7% | |||||
| 120 | Lock Haven | 8,447.0 | 9,644 | -12.4% | |||||
| 121 | Swissvale | 8,418.0 | 9,041 | -6.9% | |||||
| 122 | Pleasant Hills | 8,399.0 | 8,259 | 1.7% | |||||
| 123 | Mount Joy | 8,344.0 | 7,310 | 14.1% | |||||
| 124 | Doyle | 8,341.0 | 8,388 | -0.6% | |||||
| 125 | Brookhaven | 8,331.0 | 7,981 | 4.4% | |||||
| 126 | Hatboro | 8,283.0 | 7,315 | 13.2% | |||||
| 127 | Downin | 8,255.0 | 7,907 | 4.4% | |||||
| 128 | Gettysburg | 8,254.0 | 7,693 | 7.3% | |||||
| 129 | Castle Shannon | 8,209.0 | 8,301 | -1.1% | |||||
| 130 | Wilson | 8,183.0 | 7,912 | 3.4% | |||||
| 131 | Camp Hill | 8,169.0 | 7,829 | 4.3% | |||||
| 132 | Bellevue | 8,128.0 | 8,375 | -2.9% | |||||
| 133 | Parkville | 8,128.0 | 6,553 | 24.0% | |||||
| 134 | Dormont | 8,063.0 | 8,652 | -6.8% | |||||
| 135 | Carnegie | 7,978.0 | 7,973 | 0.1% | |||||
| 136 | Grove City | 7,830.0 | 8,295 | -5.6% | |||||
| 137 | Ancient Oaks | 7,777.0 | 7,151 | 8.8% | |||||
| 138 | Breinigsville | 7,769.0 | 2,649 | 193.3% | |||||
| 139 | Palmyra | 7,755.0 | 7,292 | 6.3% | |||||
| 140 | Bradford | 7,683.0 | 8,847 | -13.2% | |||||
| 141 | Lionville | 7,683.0 | 5,922 | 29.7% | |||||
| 142 | Glenside | 7,659.0 | 7,361 | 4.0% | |||||
| 143 | Lower Allen | 7,646.0 | 6,910 | 10.7% | |||||
| 144 | Middletown | 7,628.0 | 7,204 | 5.9% | |||||
| 145 | Pittston | 7,626.0 | 7,774 | -1.9% | |||||
| 146 | New Cumberland | 7,580.0 | 7,289 | 4.0% | |||||
| 147 | Ellwood City | 7,532.0 | 8,206 | -8.2% | |||||
| 148 | Plymouth Meeting | 7,502.0 | 5,907 | 27.0% | |||||
| 149 | White Oak | 7,468.0 | 7,903 | -5.5% | |||||
| 150 | Leola | 7,448.0 | 7,154 | 4.1% | |||||
| 151 | Archbald | 7,404.0 | 6,855 | 8.0% | |||||
| 152 | Dubois | 7,402.0 | 7,846 | -5.7% | |||||
| 153 | Blandon | 7,357.0 | 7,127 | 3.2% | |||||
| 154 | Ridley Park | 7,261.0 | 7,019 | 3.4% | |||||
| 155 | Glenolden | 7,220.0 | 7,187 | 0.5% | |||||
| 156 | Souderton | 7,181.0 | 6,702 | 7.1% | |||||
| 157 | Wescosville | 7,148.0 | 5,773 | 23.8% | |||||
| 158 | Richboro | 6,963.0 | 6,498 | 7.2% | |||||
| 159 | Linglestown | 6,957.0 | 6,857 | 1.5% | |||||
| 160 | Tamaqua | 6,924.0 | 7,097 | -2.4% | |||||
| 161 | Huntingdon | 6,897.0 | 7,067 | -2.4% | |||||
| 162 | Rutherford | 6,890.0 | 4,096 | 68.2% | |||||
| 163 | Ambridge | 6,890.0 | 7,126 | -3.3% | |||||
| 164 | Shamokin | 6,853.0 | 7,447 | -8.0% | |||||
| 165 | Connellsville | 6,849.0 | 7,882 | -13.1% | |||||
| 166 | Ambler | 6,847.0 | 6,409 | 6.8% | |||||
| 167 | Arlington Heights | 6,847.0 | 6,394 | 7.1% | |||||
| 168 | Clifton Heights | 6,832.0 | 6,656 | 2.6% | |||||
| 169 | Homeacre-Lyndora | 6,783.0 | 7,306 | -7.2% | |||||
| 170 | Monessen | 6,780.0 | 7,863 | -13.8% | |||||
| 171 | Exton | 6,772.0 | 4,578 | 47.9% | |||||
| 172 | Folcroft | 6,772.0 | 6,650 | 1.8% | |||||
| 173 | Oakmont | 6,702.0 | 6,360 | 5.4% | |||||
| 174 | Blakely | 6,662.0 | 6,659 | 0.0% | |||||
| 175 | Maple Glen | 6,643.0 | 6,974 | -4.7% | |||||
| 176 | Swarthmore | 6,550.0 | 6,185 | 5.9% | |||||
| 177 | Catasauqua | 6,541.0 | 6,473 | 1.1% | |||||
| 178 | Milton | 6,534.0 | 7,030 | -7.1% | |||||
| 179 | Enola | 6,534.0 | 6,584 | -0.8% | |||||
| 180 | West View | 6,533.0 | 6,796 | -3.9% | |||||
| 181 | Red Lion | 6,516.0 | 6,384 | 2.1% | |||||
| 182 | Blue Bell | 6,424.0 | 6,005 | 7.0% | |||||
| 183 | Prospect Park | 6,417.0 | 6,462 | -0.7% | |||||
| 184 | Sierra View | 6,365.0 | 5,665 | 12.4% | |||||
| 185 | Paoli | 6,362.0 | 5,242 | 21.4% | |||||
| 186 | Steelton | 6,296.0 | 5,994 | 5.0% | |||||
| 187 | Forest Hills | 6,286.0 | 6,540 | -3.9% | |||||
| 188 | Fort Washington | 6,271.0 | 5,649 | 11.0% | |||||
| 189 | Taylor | 6,265.0 | 6,294 | -0.5% | |||||
| 190 | Kennett Square | 6,243.0 | 5,959 | 4.8% | |||||
| 191 | South Williamsport | 6,211.0 | 6,345 | -2.1% | |||||
| 192 | Newtown Grant | 6,193.0 | 3,757 | 64.8% | |||||
| 193 | Gilbertsville | 6,165.0 | 4,345 | 41.9% | |||||
| 194 | Helle | 6,118.0 | 5,888 | 3.9% | |||||
| 195 | Corry | 6,116.0 | 6,610 | -7.5% | |||||
| 196 | Campbelltown | 6,092.0 | 3,596 | 69.4% | |||||
| 197 | Churchville | 6,084.0 | 4,303 | 41.4% | |||||
| 198 | Penn Wynne | 6,070.0 | 5,822 | 4.3% | |||||
| 199 | Clairton | 6,044.0 | 7,023 | -13.9% | |||||
| 200 | Nazareth | 6,043.0 | 5,835 | 3.6% | |||||
| 201 | Dickson City | 6,023.0 | 6,078 | -0.9% | |||||
| 202 | Bellefonte | 6,009.0 | 6,247 | -3.8% | |||||
| 203 | Sharon Hill | 6,002.0 | 5,649 | 6.2% | |||||
| 204 | Franklin | 5,984.0 | 6,648 | -10.0% | |||||
| 205 | Moosic | 5,973.0 | 5,598 | 6.7% | |||||
| 206 | Crafton | 5,961.0 | 6,031 | -1.2% | |||||
| 207 | Oreland | 5,953.0 | 5,395 | 10.3% | |||||
| 208 | Somerset | 5,944.0 | 6,353 | -6.4% | |||||
| 209 | Norwood | 5,934.0 | 5,891 | 0.7% | |||||
| 210 | Stroudsburg | 5,894.0 | 5,733 | 2.8% | |||||
| 211 | Bryn Mawr | 5,880.0 | 3,510 | 67.5% | |||||
| 212 | Clearfield | 5,873.0 | 6,284 | -6.5% | |||||
| 213 | Media | 5,870.0 | 5,348 | 9.8% | |||||
| 214 | Chesterbrook | 5,839.0 | 4,429 | 31.8% | |||||
| 215 | Oxford | 5,825.0 | 4,971 | 17.2% | |||||
| 216 | Mckees Rocks | 5,786.0 | 6,127 | -5.6% | |||||
| 217 | New Holland | 5,780.0 | 5,343 | 8.2% | |||||
| 218 | Plymouth | 5,770.0 | 6,012 | -4.0% | |||||
| 219 | Mount Carmel | 5,677.0 | 5,960 | -4.7% | |||||
| 220 | Punxsutawney | 5,665.0 | 6,025 | -6.0% | |||||
| 221 | Wyndmoor | 5,633.0 | 5,949 | -5.3% | |||||
| 222 | Palmerton | 5,622.0 | 5,420 | 3.7% | |||||
| 223 | Shippensburg | 5,620.0 | 5,526 | 1.7% | |||||
| 224 | Selinsgrove | 5,593.0 | 5,621 | -0.5% | |||||
| 225 | New Brighton | 5,567.0 | 6,111 | -8.9% | |||||
| 226 | Hollidaysburg | 5,558.0 | 5,781 | -3.9% | |||||
| 227 | Exeter | 5,541.0 | 5,686 | -2.6% | |||||
| 228 | Greenville | 5,523.0 | 6,007 | -8.1% | |||||
| 229 | Monaca | 5,519.0 | 5,801 | -4.9% | |||||
| 230 | Shillington | 5,492.0 | 5,269 | 4.2% | |||||
| 231 | Edinboro | 5,440.0 | 6,523 | -16.6% | |||||
| 232 | Sayre | 5,431.0 | 5,616 | -3.3% | |||||
| 233 | Coraopolis | 5,417.0 | 5,706 | -5.1% | |||||
| 234 | Pennside | 5,407.0 | 4,410 | 22.6% | |||||
| 235 | Schlusser | 5,402.0 | 5,217 | 3.5% | |||||
| 236 | Olyphant | 5,381.0 | 5,113 | 5.2% | |||||
| 237 | Tyrone | 5,377.0 | 5,510 | -2.4% | |||||
| 238 | Treasure Lake | 5,336.0 | 4,297 | 24.2% | |||||
| 239 | Lehighton | 5,268.0 | 5,548 | -5.0% | |||||
| 240 | Lewisburg | 5,257.0 | 5,862 | -10.3% | |||||
| 241 | Schuylkill Haven | 5,253.0 | 5,431 | -3.3% | |||||
| 242 | Collegeville | 5,247.0 | 5,150 | 1.9% | |||||
| 243 | Fox Chapel | 5,246.0 | 5,400 | -2.9% | |||||
| 244 | Whitfield | 5,226.0 | 4,873 | 7.2% | |||||
| 245 | Dorneyville | 5,211.0 | 4,484 | 16.2% | |||||
| 246 | Titusville | 5,189.0 | 5,701 | -9.0% | |||||
| 247 | West Hazleton | 5,178.0 | 4,410 | 17.4% | |||||
| 248 | Bridgeport | 5,174.0 | 4,526 | 14.3% | |||||
| 249 | Bangor | 5,163.0 | 5,317 | -2.9% | |||||
| 250 | Duquesne | 5,149.0 | 5,826 | -11.6% | |||||
| 251 | Spring House | 5,137.0 | 3,776 | 36.0% | |||||
| 252 | Shanor-Northvue | 5,125.0 | 5,071 | 1.1% | |||||
| 253 | Birdsboro | 5,116.0 | 5,177 | -1.2% | |||||
| 254 | West York | 5,092.0 | 4,586 | 11.0% | |||||
| 255 | Duryea | 5,084.0 | 4,844 | 5.0% | |||||
| 256 | Kenmar | 5,077.0 | 3,906 | 30.0% | |||||
| 257 | Clarks Summit | 5,073.0 | 5,115 | -0.8% | |||||
| 258 | New Freedom | 5,066.0 | 4,316 | 17.4% | |||||
| 259 | Swoyersville | 5,048.0 | 5,061 | -0.3% | |||||
| 260 | Manheim | 5,027.0 | 4,863 | 3.4% | |||||
| 261 | Vandergrift | 5,011.0 | 5,269 | -4.9% | |||||
| 262 | Turtle Creek | 5,007.0 | 5,415 | -7.5% | |||||
| 263 | Flourtown | 4,992.0 | 4,537 | 10.0% | |||||
| 264 | Royersford | 4,945.0 | 4,655 | 6.2% | |||||
| 265 | Edwardsville | 4,932.0 | 4,801 | 2.7% | |||||
| 266 | Annville | 4,915.0 | 4,729 | 3.9% | |||||
| 267 | Spry | 4,909.0 | 4,907 | 0.0% | |||||
| 268 | Trooper | 4,907.0 | 5,956 | -17.6% | |||||
| 269 | California | 4,864.0 | 6,592 | -26.2% | |||||
| 270 | Westmont | 4,855.0 | 5,216 | -6.9% | |||||
| 271 | Little | 4,850.0 | 4,428 | 9.5% | |||||
| 272 | Fountain Hill | 4,834.0 | 4,602 | 5.0% | |||||
| 273 | Green Tree | 4,833.0 | 4,462 | 8.3% | |||||
| 274 | Telford | 4,829.0 | 4,916 | -1.8% | |||||
| 275 | Grantley | 4,775.0 | 3,492 | 36.7% | |||||
| 276 | Boothwyn | 4,774.0 | 4,188 | 14.0% | |||||
| 277 | Lawnton | 4,765.0 | 3,743 | 27.3% | |||||
| 278 | Lemoyne | 4,742.0 | 4,467 | 6.2% | |||||
| 279 | Jenki | 4,727.0 | 4,446 | 6.3% | |||||
| 280 | Sugarcreek | 4,716.0 | 5,294 | -10.9% | |||||
| 281 | Montoursville | 4,706.0 | 4,623 | 1.8% | |||||
| 282 | Skyline View | 4,704.0 | 3,244 | 45.0% | |||||
| 283 | Arnold | 4,704.0 | 5,254 | -10.5% | |||||
| 284 | Bridgeville | 4,686.0 | 5,149 | -9.0% | |||||
| 285 | West Pittston | 4,679.0 | 4,886 | -4.2% | |||||
| 286 | Avalon | 4,674.0 | 4,762 | -1.8% | |||||
| 287 | Cornwall | 4,623.0 | 4,015 | 15.1% | |||||
| 288 | Lorane | 4,601.0 | 3,784 | 21.6% | |||||
| 289 | East Petersburg | 4,591.0 | 4,506 | 1.9% | |||||
| 290 | Boalsburg | 4,582.0 | 3,682 | 24.4% | |||||
| 291 | Reiffton | 4,575.0 | 4,057 | 12.8% | |||||
| 292 | Brittany Farms-The Highlands | 4,571.0 | 3,815 | 19.8% | |||||
| 293 | West Reading | 4,562.0 | 4,210 | 8.4% | |||||
| 294 | Sellersville | 4,542.0 | 4,315 | 5.3% | |||||
| 295 | Jim Thorpe | 4,540.0 | 4,829 | -6.0% | |||||
| 296 | Hummel | 4,527.0 | 4,502 | 0.6% | |||||
| 297 | Donora | 4,527.0 | 4,937 | -8.3% | |||||
| 298 | Narberth | 4,511.0 | 4,279 | 5.4% | |||||
| 299 | Amity Gardens | 4,499.0 | 3,536 | 27.2% | |||||
| 300 | Jessup | 4,495.0 | 4,673 | -3.8% | |||||
| 301 | Honesdale | 4,467.0 | 4,580 | -2.5% | |||||
| 302 | Hamburg | 4,456.0 | 4,288 | 3.9% | |||||
| 303 | Maytown | 4,443.0 | 4,000 | 11.1% | |||||
| 304 | Saw Creek | 4,422.0 | 5,079 | -12.9% | |||||
| 305 | Level Green | 4,409.0 | 3,712 | 18.8% | |||||
| 306 | Minersville | 4,396.0 | 4,394 | 0.0% | |||||
| 307 | Mcgovern | 4,393.0 | 3,020 | 45.5% | |||||
| 308 | Beaver | 4,374.0 | 4,556 | -4.0% | |||||
| 309 | Glassport | 4,368.0 | 4,536 | -3.7% | |||||
| 310 | Scottdale | 4,363.0 | 4,449 | -1.9% | |||||
| 311 | Chalfont | 4,346.0 | 4,000 | 8.6% | |||||
| 312 | Slatington | 4,290.0 | 4,290 | 0.0% | |||||
| 313 | Boye | 4,287.0 | 4,056 | 5.7% | |||||
| 314 | Mcmurray | 4,286.0 | 4,889 | -12.3% | |||||
| 315 | Laureldale | 4,284.0 | 3,899 | 9.9% | |||||
| 316 | Sinking Spring | 4,281.0 | 3,792 | 12.9% | |||||
| 317 | Aldan | 4,259.0 | 4,174 | 2.0% | |||||
| 318 | Larksville | 4,255.0 | 4,516 | -5.8% | |||||
| 319 | Emigsville | 4,254.0 | 2,490 | 70.8% | |||||
| 320 | Forty Fort | 4,252.0 | 4,255 | -0.1% | |||||
| 321 | Tarentum | 4,249.0 | 4,568 | -7.0% | |||||
| 322 | Greencastle | 4,222.0 | 3,957 | 6.7% | |||||
| 323 | North Braddock | 4,219.0 | 5,079 | -16.9% | |||||
| 324 | Danville | 4,217.0 | 4,706 | -10.4% | |||||
| 325 | Charleroi | 4,202.0 | 4,247 | -1.1% | |||||
| 326 | Farrell | 4,199.0 | 5,304 | -20.8% | |||||
| 327 | Mount Pleasant | 4,199.0 | 4,495 | -6.6% | |||||
| 328 | Clarion | 4,192.0 | 5,354 | -21.7% | |||||
| 329 | Sharpsville | 4,187.0 | 4,436 | -5.6% | |||||
| 330 | Dalla | 4,185.0 | 4,085 | 2.4% | |||||
| 331 | Kut | 4,180.0 | 4,995 | -16.3% | |||||
| 332 | Lansford | 4,156.0 | 4,010 | 3.6% | |||||
| 333 | Plains | 4,153.0 | 3,983 | 4.3% | |||||
| 334 | Shenandoah | 4,146.0 | 5,161 | -19.7% | |||||
| 335 | Akron | 4,143.0 | 3,909 | 6.0% | |||||
| 336 | Jersey Shore | 4,121.0 | 4,351 | -5.3% | |||||
| 337 | Monongahela | 4,109.0 | 4,373 | -6.0% | |||||
| 338 | Throop | 4,081.0 | 4,050 | 0.8% | |||||
| 339 | Paxtonia | 4,074.0 | 5,290 | -23.0% | |||||
| 340 | Fleetwood | 4,064.0 | 4,136 | -1.7% | |||||
| 341 | North East | 4,054.0 | 4,322 | -6.2% | |||||
| 342 | Trappe | 4,025.0 | 3,450 | 16.7% | |||||
| 343 | Pennsburg | 3,994.0 | 3,633 | 9.9% | |||||
| 344 | Carroll Valley | 3,992.0 | 3,811 | 4.7% | |||||
| 345 | Ridgway | 3,969.0 | 4,268 | -7.0% | |||||
| 346 | Brookville | 3,946.0 | 4,000 | -1.4% | |||||
| 347 | Warminster Heights | 3,940.0 | 4,526 | -12.9% | |||||
| 348 | Parkesburg | 3,937.0 | 3,582 | 9.9% | |||||
| 349 | Skippack | 3,937.0 | 3,477 | 13.2% | |||||
| 350 | Schnecksville | 3,922.0 | 2,774 | 41.4% | |||||
| 351 | Linwood | 3,921.0 | 3,287 | 19.3% | |||||
| 352 | Guilford | 3,919.0 | 2,153 | 82.0% | |||||
| 353 | Kittanning | 3,902.0 | 4,127 | -5.5% | |||||
| 354 | Jacksonwald | 3,894.0 | 3,154 | 23.5% | |||||
| 355 | Indian Mountain Lake | 3,889.0 | 5,096 | -23.7% | |||||
| 356 | Frackville | 3,878.0 | 3,880 | -0.1% | |||||
| 357 | Shrewsbury | 3,878.0 | 3,784 | 2.5% | |||||
| 358 | Northumberland | 3,866.0 | 3,798 | 1.8% | |||||
| 359 | Windber | 3,860.0 | 4,199 | -8.1% | |||||
| 360 | Thorndale | 3,854.0 | 3,366 | 14.5% | |||||
| 361 | Baden | 3,843.0 | 4,155 | -7.5% | |||||
| 362 | Freeland | 3,837.0 | 3,535 | 8.5% | |||||
| 363 | Meridian | 3,837.0 | 3,753 | 2.2% | |||||
| 364 | Woodbourne | 3,834.0 | 3,520 | 8.9% | |||||
| 365 | Irwin | 3,831.0 | 4,028 | -4.9% | |||||
| 366 | Zelienople | 3,827.0 | 3,875 | -1.2% | |||||
| 367 | Sewickley | 3,823.0 | 3,812 | 0.3% | |||||
| 368 | Waynesburg | 3,811.0 | 4,177 | -8.8% | |||||
| 369 | Lawrence Park | 3,775.0 | 3,973 | -5.0% | |||||
| 370 | Denver | 3,771.0 | 3,784 | -0.3% | |||||
| 371 | Elim | 3,759.0 | 3,880 | -3.1% | |||||
| 372 | Eastlawn Gardens | 3,722.0 | 3,319 | 12.1% | |||||
| 373 | Stowe | 3,698.0 | 3,612 | 2.4% | |||||
| 374 | Halfway House | 3,688.0 | 3,005 | 22.7% | |||||
| 375 | Berwyn | 3,680.0 | 3,478 | 5.8% | |||||
| 376 | Valley Green | 3,676.0 | 3,216 | 14.3% | |||||
| 377 | Penn Estates | 3,659.0 | 4,197 | -12.8% | |||||
| 378 | Spring City | 3,657.0 | 3,346 | 9.3% | |||||
| 379 | Brownstown | 3,650.0 | 2,118 | 72.3% | |||||
| 380 | Thompsonville | 3,646.0 | 4,009 | -9.1% | |||||
| 381 | Trevose | 3,635.0 | 2,868 | 26.7% | |||||
| 382 | Palmer Heights | 3,624.0 | 3,677 | -1.4% | |||||
| 383 | Port Vue | 3,620.0 | 3,840 | -5.7% | |||||
| 384 | Riverview Park | 3,619.0 | 3,419 | 5.8% | |||||
| 385 | Manor | 3,538.0 | 3,145 | 12.5% | |||||
| 386 | Kane | 3,537.0 | 3,791 | -6.7% | |||||
| 387 | Mahanoy City | 3,507.0 | 4,235 | -17.2% | |||||
| 388 | Village Shires | 3,503.0 | 3,808 | -8.0% | |||||
| 389 | Hatfield | 3,502.0 | 3,175 | 10.3% | |||||
| 390 | Slippery Rock | 3,495.0 | 3,678 | -5.0% | |||||
| 391 | Pen Argyl | 3,495.0 | 3,615 | -3.3% | |||||
| 392 | Northern Cambria | 3,494.0 | 3,896 | -10.3% | |||||
| 393 | Stonybrook | 3,483.0 | 2,117 | 64.5% | |||||
| 394 | Mifflinburg | 3,473.0 | 3,572 | -2.8% | |||||
| 395 | Reamstown | 3,468.0 | 3,624 | -4.3% | |||||
| 396 | Coplay | 3,466.0 | 3,242 | 6.9% | |||||
| 397 | North Wales | 3,440.0 | 3,251 | 5.8% | |||||
| 398 | Wellsboro | 3,437.0 | 3,261 | 5.4% | |||||
| 399 | Malvern | 3,435.0 | 3,023 | 13.6% | |||||
| 400 | Rochester | 3,422.0 | 3,712 | -7.8% | |||||
| 401 | Pottsgrove | 3,409.0 | 3,450 | -1.2% | |||||
| 402 | Hemlock Farms | 3,392.0 | 2,912 | 16.5% | |||||
| 403 | Wyncote | 3,389.0 | 3,166 | 7.0% | |||||
| 404 | Etna | 3,364.0 | 3,505 | -4.0% | |||||
| 405 | Wind Gap | 3,360.0 | 2,748 | 22.3% | |||||
| 406 | Salunga | 3,355.0 | 2,905 | 15.5% | |||||
| 407 | Loyalhanna | 3,349.0 | 3,283 | 2.0% | |||||
| 408 | Nesquehoning | 3,344.0 | 3,359 | -0.4% | |||||
| 409 | Boiling Springs | 3,334.0 | 2,927 | 13.9% | |||||
| 410 | Ohioville | 3,324.0 | 3,566 | -6.8% | |||||
| 411 | Ebensburg | 3,321.0 | 3,283 | 1.2% | |||||
| 412 | Springdale | 3,319.0 | 3,455 | -3.9% | |||||
| 413 | Mount Oliver | 3,319.0 | 3,467 | -4.3% | |||||
| 414 | Ingram | 3,299.0 | 3,370 | -2.1% | |||||
| 415 | Millvale | 3,299.0 | 3,781 | -12.7% | |||||
| 416 | Wayne Heights | 3,293.0 | 2,601 | 26.6% | |||||
| 417 | West Wyomissing | 3,289.0 | 3,941 | -16.5% | |||||
| 418 | Macungie | 3,274.0 | 3,088 | 6.0% | |||||
| 419 | Penbrook | 3,266.0 | 3,013 | 8.4% | |||||
| 420 | Mount Penn | 3,244.0 | 3,114 | 4.2% | |||||
| 421 | Athens | 3,243.0 | 3,362 | -3.5% | |||||
| 422 | Centerville Borough (Washington County) | 3,235.0 | 3,277 | -1.3% | |||||
| 423 | Newmanstown | 3,227.0 | 2,432 | 32.7% | |||||
| 424 | Trafford | 3,216.0 | 3,168 | 1.5% | |||||
| 425 | Blairsville | 3,215.0 | 3,440 | -6.5% | |||||
| 426 | Pleasant Gap | 3,208.0 | 2,745 | 16.9% | |||||
| 427 | Pocono Woodland Lakes | 3,202.0 | 2,845 | 12.5% | |||||
| 428 | Maso | 3,201.0 | 3,484 | -8.1% | |||||
| 429 | Wesleyville | 3,179.0 | 3,375 | -5.8% | |||||
| 430 | East Greenville | 3,169.0 | 2,983 | 6.2% | |||||
| 431 | Brackenridge | 3,167.0 | 3,274 | -3.3% | |||||
| 432 | Marienville | 3,163.0 | 724 | 336.9% | |||||
| 433 | Hokendauqua | 3,145.0 | 3,580 | -12.2% | |||||
| 434 | Summit Hill | 3,137.0 | 3,062 | 2.4% | |||||
| 435 | Pleasant Hill | 3,128.0 | 2,640 | 18.5% | |||||
| 436 | Myer | 3,124.0 | 3,112 | 0.4% | |||||
| 437 | Sharpsburg | 3,119.0 | 3,444 | -9.4% | |||||
| 438 | Wyoming | 3,118.0 | 3,082 | 1.2% | |||||
| 439 | Mcsherry | 3,114.0 | 3,010 | 3.5% | |||||
| 440 | State Line | 3,111.0 | 2,445 | 27.2% | |||||
| 441 | Strasburg | 3,109.0 | 2,818 | 10.3% | |||||
| 442 | Pine Ridge | 3,099.0 | 2,158 | 43.6% | |||||
| 443 | Churchill | 3,087.0 | 3,076 | 0.4% | |||||
| 444 | Wormleysburg | 3,077.0 | 2,988 | 3.0% | |||||
| 445 | Edgewood | 3,077.0 | 3,137 | -1.9% | |||||
| 446 | Mount Pocono | 3,072.0 | 3,172 | -3.2% | |||||
| 447 | Upland | 3,057.0 | 3,176 | -3.7% | |||||
| 448 | Egypt | 3,053.0 | 2,296 | 33.0% | |||||
| 449 | Lake Wynonah | 3,036.0 | 2,468 | 23.0% | |||||
| 450 | Pitcairn | 3,032.0 | 3,339 | -9.2% | |||||
| 451 | North Catasauqua | 3,014.0 | 2,870 | 5.0% | |||||
| 452 | Kenhorst | 3,009.0 | 2,844 | 5.8% | |||||
| 453 | Orwigsburg | 3,005.0 | 3,096 | -2.9% | |||||
| 454 | Mountville | 3,004.0 | 2,734 | 9.9% | |||||
| 455 | Imperial | 3,001.0 | 2,324 | 29.1% | |||||
| 456 | Lake Heritage | 2,997.0 | 1,680 | 78.4% | |||||
| 457 | Gastonville | 2,995.0 | 2,809 | 6.6% | |||||
| 458 | Mansfield | 2,990.0 | 3,523 | -15.1% | |||||
| 459 | Evansburg | 2,976.0 | 2,050 | 45.2% | |||||
| 460 | Girard | 2,962.0 | 3,088 | -4.1% | |||||
| 461 | Bowmansville | 2,959.0 | 2,050 | 44.3% | |||||
| 462 | Chester Heights | 2,948.0 | 2,520 | 17.0% | |||||
| 463 | Wolfdale | 2,938.0 | 2,916 | 0.8% | |||||
| 464 | Rothsville | 2,934.0 | 3,125 | -6.1% | |||||
| 465 | Youngwood | 2,926.0 | 3,118 | -6.2% | |||||
| 466 | Mohnton | 2,922.0 | 3,050 | -4.2% | |||||
| 467 | Cecil-Bishop | 2,910.0 | 2,525 | 15.2% | |||||
| 468 | Womelsdorf | 2,904.0 | 2,796 | 3.9% | |||||
| 469 | Gibsonia | 2,899.0 | 2,643 | 9.7% | |||||
| 470 | Lake City | 2,895.0 | 2,976 | -2.7% | |||||
| 471 | Freemansburg | 2,894.0 | 2,550 | 13.5% | |||||
| 472 | Union City | 2,887.0 | 3,324 | -13.1% | |||||
| 473 | Marietta | 2,886.0 | 2,604 | 10.8% | |||||
| 474 | Seven Fields | 2,884.0 | 2,736 | 5.4% | |||||
| 475 | Homestead | 2,874.0 | 3,216 | -10.6% | |||||
| 476 | Toftrees | 2,873.0 | 2,183 | 31.6% | |||||
| 477 | Bath | 2,864.0 | 2,722 | 5.2% | |||||
| 478 | Quarryville | 2,856.0 | 2,476 | 15.3% | |||||
| 479 | Greenwood | 2,853.0 | 2,767 | 3.1% | |||||
| 480 | Slippery Rock University | 2,853.0 | 328 | 769.8% | |||||
| 481 | Bedford | 2,851.0 | 2,905 | -1.9% | |||||
| 482 | Hyde Park | 2,846.0 | 2,643 | 7.7% | |||||
| 483 | Aspinwall | 2,843.0 | 2,783 | 2.2% | |||||
| 484 | New Britain | 2,821.0 | 3,139 | -10.1% | |||||
| 485 | Ford City | 2,813.0 | 3,050 | -7.8% | |||||
| 486 | North York | 2,812.0 | 1,764 | 59.4% | |||||
| 487 | Lima | 2,812.0 | 2,835 | -0.8% | |||||
| 488 | Harveys Lake | 2,809.0 | 2,769 | 1.4% | |||||
| 489 | Manchester | 2,803.0 | 2,710 | 3.4% | |||||
| 490 | West Grove | 2,798.0 | 2,838 | -1.4% | |||||
| 491 | Towanda | 2,791.0 | 2,933 | -4.8% | |||||
| 492 | Hallam | 2,788.0 | 2,492 | 11.9% | |||||
| 493 | Wernersville | 2,786.0 | 2,187 | 27.4% | |||||
| 494 | Morton | 2,773.0 | 2,663 | 4.1% | |||||
| 495 | St. Clair | 2,754.0 | 3,037 | -9.3% | |||||
| 496 | Philipsburg | 2,748.0 | 2,858 | -3.8% | |||||
| 497 | Highspire | 2,732.0 | 2,712 | 0.7% | |||||
| 498 | Kulpmont | 2,724.0 | 2,926 | -6.9% | |||||
| 499 | Luzerne | 2,723.0 | 2,853 | -4.6% | |||||
| 500 | Muncy | 2,720.0 | 2,481 | 9.6% | |||||