The best place to live in Pennsylvania, you ask?
Why, that’s easy.
It’s either Pittsburgh or Philadelphia, you’d say.
Right?
Wrong. At least according to the most recent data from the Census, Zillow, and FBI. We used Saturday Night Science to compare the 175 cities in Pennsylvania larger than 5,000 people. We looked at factors including home prices, incomes, crime, and quality of life.
So “Youse” and “Yinz” can put aside the cross-state rivalry for a minute, pick up a Yuengling, and cozy up with some scrapple as we break down the best places to live in Pennsylvania.
People in Pennsylvania live 77.3 years on average — 24th in the nation; see how every state stacks up in our life expectancy by state ranking.
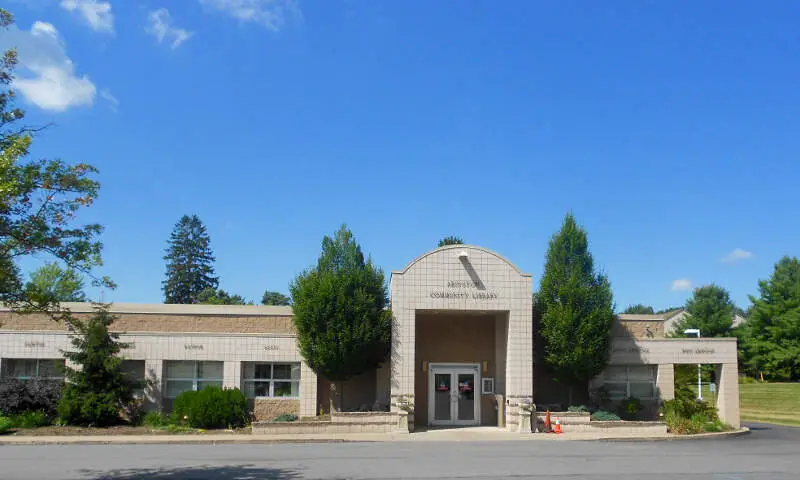
$92,083 median income · $323,510 median home · #1 best place in Pennsylvania
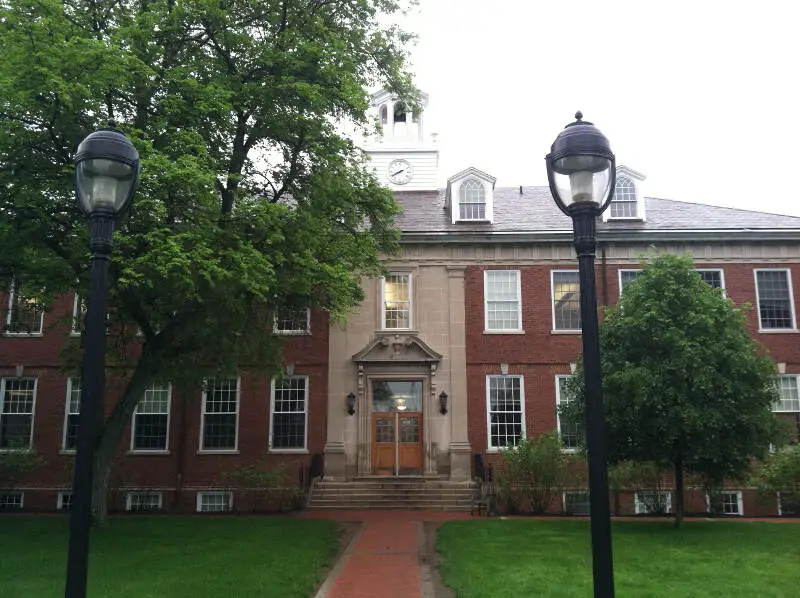
Clarks Summit, located in Lackawanna County, is undoubtedly one of Pennsylvania’s best places to live. This borough is known for its low cost of living and attractive median home price, making it one of the best places to settle down. With a population of 5,073, Clarks Summit offers a peaceful and tight-knit community for residents to enjoy.
Clarks Summit boasts a variety of things to do and see. You can explore nearby Lackawanna State Park or the cultural experience of the nearby city of Scranton, located just northwest of Clarks Summit. Furthermore, Clarks Summit’s convenient location within the state allows for easy access to major cities like Philadelphia and New York City.
Data | Crime | Cost of living | Movers
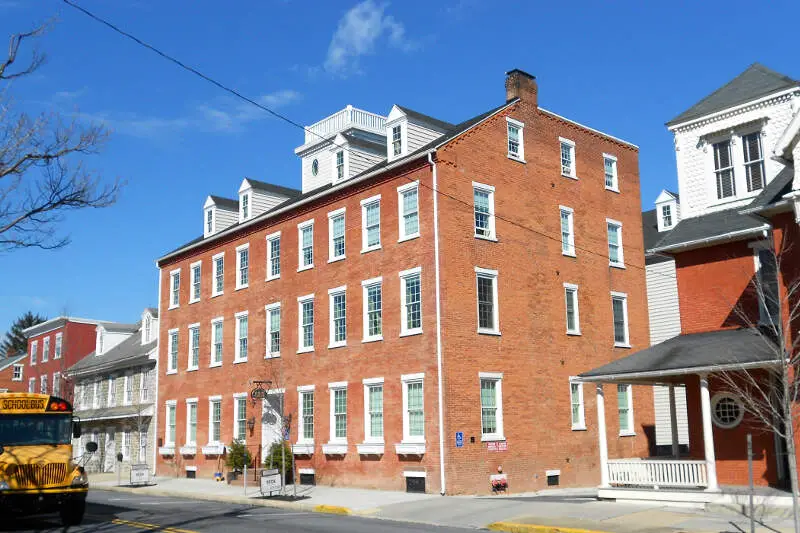
$88,576 median income · $458,674 median home · #2 best place in Pennsylvania
Located just north of the city of Lancaster, Lititz ranks as the 2nd best place to live in Pennsylvania. The poverty level in Lititz is 4.1%, about three times lower than the statewide average. Lititz also has the 16th lowest rate of crime in Pennsylvania, so you don’t need to worry about Amazon porch pirates here. Another (possible) perk about life in Lititz is the ladies, because fully 48.7% of the population is female in Lilitz.
It’s no wonder Lititz describes itself as “the coolest small town in America” — it doesn’t matter if you want to get in touch with your wild side at the Wolf Sanctuary of PA or just relax and feed some ducks at Springs Park, because Lititz has something for everyone.
Data | Crime | Cost of living | Movers
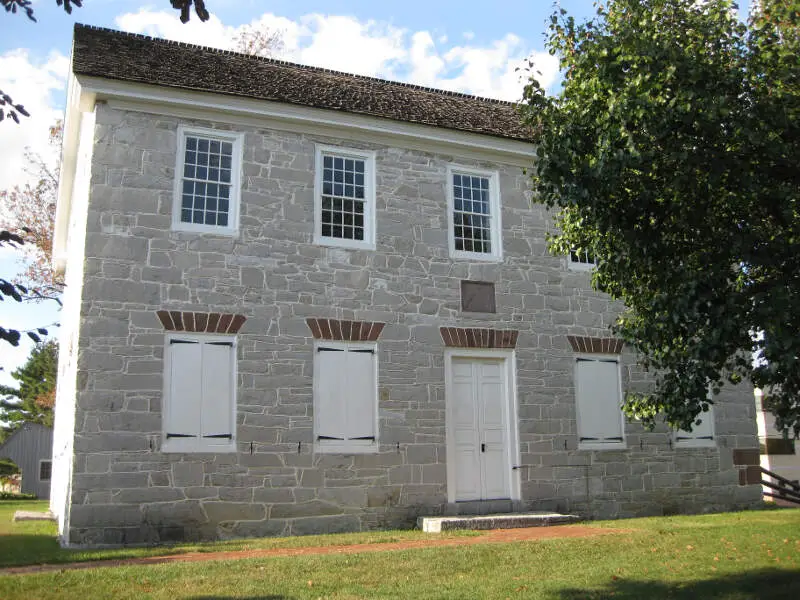
$115,761 median income · $331,050 median home · #3 best place in Pennsylvania
We begin our tour of the best places to call home in Pennsylvania with Camp Hill, a small city located just across the Susquehanna River from Harrisburg. Although homes are slightly pricey at a median cost of $331,050, Camp Hill residents pull in the 7th highest salaries in the state, with a median household income of $115,761/year. That gives Camp Hill the overall lowest cost of living of any of the cities we’ll be covering here.
On top of being affordable, Camp Hill is also extremely safe. In fact, Camp Hill has the 43rd lowest rate of violent crime in the state, and a total crime rate about 70% below the national average. Add to that SnackAbility scores of 8.5/10 for both housing and jobs, and you’ve got a recipe for a stellar place to call home.
In addition to the statistical advantages Camp Hill enjoys, it’s also just a great location. In ten minutes, you can find yourself wandering down the riverfront on your way to the grand Pennsylvania State Capitol Complex. While you’re there, stop at the State Museum to put a perfect cap on your day out.
Data | Crime | Cost of living | Movers
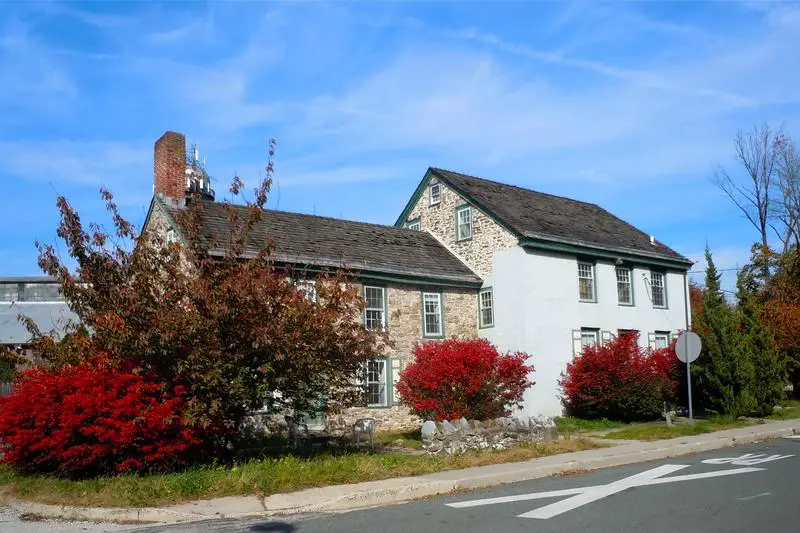
$122,721 median income · $482,552 median home · #4 best place in Pennsylvania
Let’s stick around the Philly suburbs for our 4th best city in Pennsylvania, Conshohocken. As the 17th most densely populated place in the state, you can rest assured that you won’t be left out of the action in Conshohocken. And while Conshohocken ranks as one of the most expensive places in Pennsylvania, don’t let that put you off. Because while homes are pricey, Conshohocken residents also enjoy the 4th highest median household income in Pennsylvania, at $122,721/year.
Conshohocken also has an unemployment rate of 3.2%, the 35th lowest in the state. On top of that, Conshohocken has the 52nd highest rate of residents with health insurance statewide, with 95.9% of people having some form of coverage.
Being so close to Philly, folks in Conshohocken never have to think too hard where to bring visitors. In twenty minutes, you can be taking a gander at the Liberty Bell at Independence National Historical Park.
Data | Crime | Cost of living | Movers
$243,625 median income · $1,000,519 median home · #5 best place in Pennsylvania
Next up on our list is Fox Chapel, an affluent suburb of Pittsburgh. With a median age of 44, Fox Chapel is the oldest place on this list, and boy has experience been a great teacher for the borough’s residents. Over half of Fox Chapel’s population has a master’s degree or higher, which helps explain how the borough has a median household income of $243,625/year, the highest in the state.
And it’s not just high salaries for some while the rest fall by the wayside, because at 3.2%, Fox Chapel has the 4th lowest poverty level in the state. And seeing as 99.6% of people living in Fox Chapel have health insurance, unwelcome surprises are a little less scary here. Fox Chapel was also named the safest place in Philadelphia, so crime is another unwelcome surprise you don’t have to worry about here.
Being so close to Pittsburgh brings Fox Chapel other perks. Like being able to go shopping in the Strip District any day of the week. Or having the The Andy Warhol Museum right in your backyard. And if you’d like some less interpretive beauty, the 360 views of Pittsburgh from Mount Washington are unquestionably excellent.
Data | Crime | Cost of living | Movers
$176,875 median income · $539,476 median home · #6 best place in Pennsylvania
We’re sticking around the greater Pittsburgh area for our 6th best place in Pennsylvania, Franklin Park. There are a number of factors that land Franklin Park on this list, like having the 6th lowest adult high school dropout rate in the state. Franklin Park residents also have the 2nd highest median household income in PA, with residents pulling in around $176,875/year.
Other economic factors also come into play. Like having a poverty level of just 0.7%, the lowest in the state. And having the 24th highest rate of residents with health insurance, 97.2%.
Being just 20 minutes from the Pirate’s PNC Park and the Steelers Heinz Field means you’ll never have to think too hard about what to do with your free time if you’re a sports fan.
Data | Crime | Cost of living | Movers
$152,361 median income · $467,860 median home · #7 best place in Pennsylvania
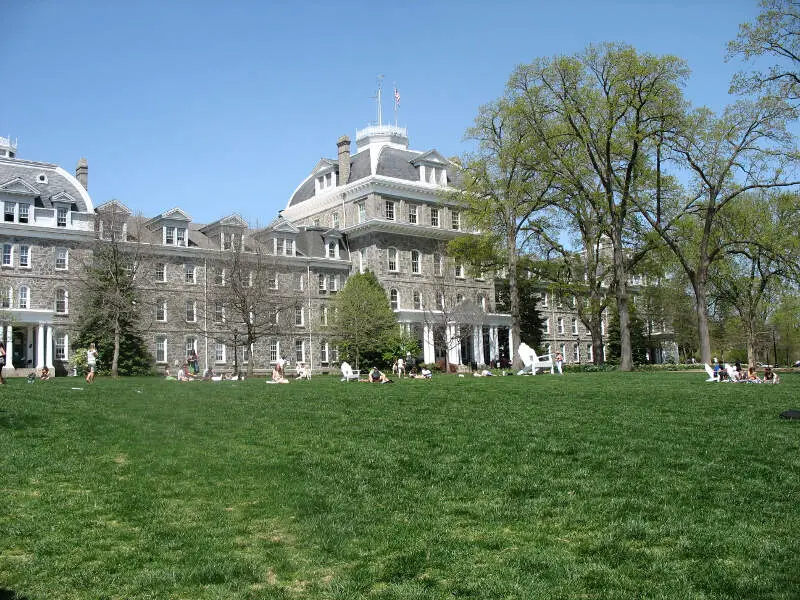
We’re heading to the greater Philadelphia area to arrive at the 7th best place to live in Pennsylvania, Swarthmore. As the home of the prestigious Swarthmore College, it’s unsurprising that Swarthmore’s median age is 28, the second youngest you’ll see on this list. Evidently, having a world-class educational institution has helped instill a love of learning in Swarthmore, because a whopping 45%+ of residents here have a master’s degree or higher.
All those degrees really pay off for the local populace, because at $152,361/year, Swarthmore has the 3rd best-paid residents in PA. Which is kind of necessary, seeing as homes in Swarthmore are the 12th priciest in the state. The good news is that nobody in Swarthmore gets left out of the economic success, because at 1.8%, it has the 2nd lowest poverty level in Pennsylvania.
Data | Crime | Cost of living | Movers
$77,394 median income · $686,428 median home · #8 best place in Pennsylvania
Just north of Philadelphia in Montgomery County, Ambler is a charming borough of 6,847 residents that delivers economic health. Poverty is just 6.0% here, the 22nd lowest in the state. Unemployment sits at 3.4%.
Homes run toward the higher end at a $686,428 median, but honestly, the century-old Ambler Theater and strong economic fundamentals make it truly worth the investment. If you’re seeking a livable Pennsylvania community with both economic stability and local character, Ambler belongs on your shortlist.
Data | Crime | Cost of living | Movers
$92,782 median income · $333,787 median home · #9 best place in Pennsylvania
Oakmont sits along the Allegheny River just upstream from Pittsburgh, and as a Pennsylvania town of 6,702, it quietly punches above its weight. The median household income here is $92,782/year, and with a poverty level of just 5.4%.
If you’re looking for the best place to buy a home in Pennsylvania without sacrificing community feel, Oakmont is worth a serious look. The borough even shares its name with one of golf’s most legendary and demanding courses, which tells you something about the standards this small river town holds itself to.
Data | Crime | Cost of living | Movers
$90,762 median income · $345,140 median home · #10 best place in Pennsylvania
Rounding out our list of best Pennsylvania cities to live in, Northampton is a Lehigh Valley borough of 10,400 people. Residents here pull in a median household income of $90,762, and the poverty rate sits at a modest 6.7%. Those numbers put it squarely in the conversation for top-ranked Pennsylvania cities that don’t always get the attention they deserve.
Homes in this community average around $345,140, and the Northampton Area School District gives families a dependable public education option without a steep premium. At a median age of 43, Northampton skews toward stable, established households, which is exactly what you want from a place to put down roots in 2026.
Data | Crime | Cost of living | Movers
The receipts
Compare the top ten
Pick a metric. The bars rescale. The red line is Pennsylvania’s statewide median.
Pennsylvania statewide median: $77,971
Pennsylvania statewide median: $282,736
Pennsylvania statewide median: 5.3%
On the map
Mapping The Best And Worst Places To Live in Pennsylvania
Saturday Night Science
Methodology: How We Calculated The Best Cities To Live In Pennsylvania
Before we even started to collect data on the best places to live in Pennsylvania, we had to answer a tough question: Is it fair to pit cities with populations over 100,000 against places with a population of 18?
We firmly decided no, that just isn’t fair.
So, to create our ranking, we broke the best places to live into three tiers:
- Cities — Populations over 5,000
- Towns — Populations between 1,000 and 5,000
- Small Towns — Populations below 1,000
We then decided no matter how much anyone loves their town, the best cities to live in Pennsylvania have more of everything, and therefore, you need over 5,000 people to truly be ‘the best.’
Now that we had our set of the best possible cities, it was time to rank them using Saturday Night Science.
We ranked each place in Pennsylvania across a number of criteria from one to 175, with one being the best.
We then took the average rank across all criteria, crowning the city posting the lowest overall score, the “Best Place To Live In Pennsylvania.”
The criteria we looked to determine the best places were:
- Median Home Values
- Median Income
- Population Density (Higher is better)
- Unemployment Rate
- Commute Time
- Crime
- Education Levels
- Health Insurance Coverage
- Poverty rates
Sources of criteria include the New Census Data, FBI Crime Data, and Zillow. We updated this article for 2026. This report is our eleventh time ranking Pennsylvania’s best places to live.
If your city or town isn’t among the top 10, jump down to the bottom of the post to see a detailed chart of the best places in Pennsylvania. Otherwise, buckle up for a ride down good living lane with Clarks Summit at the end of the cul-de-sac.
The full plate
Best Places To Live In Pennsylvania Table
Click any column to sort. Search by city name.
| Rank | City | Best Score | Population | Unemployment Rate | Home Value | Median Income | Rent | Total Crime /100k |
|---|---|---|---|---|---|---|---|---|
| 1 | Clarks Summit | 29.05 | 5,073 | 1.0% | $323,510 | $92,083 | 670 | |
| 2 | Lititz | 39.80 | 9,619 | 1.8% | $458,674 | $88,576 | 457 | |
| 3 | Camp Hill | 40.35 | 8,169 | 2.0% | $331,050 | $115,761 | 1,114 | |
| 4 | Conshohocken | 40.80 | 9,282 | 3.2% | $482,552 | $122,721 | 1,271 | |
| 5 | Fox Chapel | 42.60 | 5,246 | 5.6% | $1,000,519 | $243,625 | 286 | |
| 6 | Franklin Park | 42.60 | 15,235 | 4.5% | $539,476 | $176,875 | 282 | |
| 7 | Swarthmore | 45.50 | 6,550 | 7.7% | $467,860 | $152,361 | 748 | |
| 8 | Ambler | 45.70 | 6,847 | 3.4% | $686,428 | $77,394 | 847 | |
| 9 | Oakmont | 46.50 | 6,702 | 5.6% | $333,787 | $92,782 | 1,030 | |
| 10 | Northampton | 46.70 | 10,400 | 5.2% | $345,140 | $90,762 | 394 | |
| 11 | Wyomissing | 47.90 | 11,172 | 2.1% | $377,346 | $93,203 | 1,862 | |
| 12 | Dormont | 48.70 | 8,063 | 6.0% | $246,408 | $80,526 | 633 | |
| 13 | Hollidaysburg | 49.60 | 5,558 | 2.2% | $243,009 | $69,458 | 630 | |
| 14 | Mount Joy | 49.75 | 8,344 | 1.3% | $296,067 | $90,061 | 431 | |
| 15 | Castle Shannon | 50.00 | 8,209 | 0.4% | $211,413 | $64,071 | 341 | |
| 16 | Media | 50.35 | 5,870 | 4.2% | $632,298 | $89,092 | 1,789 | |
| 17 | Phoenixville | 50.75 | 19,452 | 4.8% | $521,604 | $102,138 | 550 | |
| 18 | Plum | 50.90 | 26,723 | 2.8% | $252,851 | $98,705 | 210 | |
| 19 | Ridley Park | 51.20 | 7,261 | 3.1% | $309,370 | $93,594 | 716 | |
| 20 | Collegeville | 51.90 | 5,247 | 6.7% | $568,662 | $91,466 | 724 | |
| 21 | Mechanicsburg | 52.20 | 9,720 | 2.1% | $401,857 | $84,421 | 1,389 | |
| 22 | Bridgeport | 53.40 | 5,174 | 3.1% | $352,990 | $82,705 | 1,778 | |
| 23 | New Cumberland | 53.45 | 7,580 | 4.0% | $292,639 | $82,154 | 488 | |
| 24 | Perkasie | 55.50 | 9,216 | 3.8% | $512,871 | $93,845 | 716 | |
| 25 | Hatboro | 55.65 | 8,283 | 5.6% | $440,910 | $112,565 | 580 | |
| 26 | Pleasant Hills | 55.85 | 8,399 | 5.1% | $265,880 | $102,167 | 1,179 | |
| 27 | Emmaus | 57.80 | 11,889 | 3.3% | $385,740 | $83,917 | 967 | |
| 28 | Brookhaven | 57.95 | 8,331 | 3.5% | $265,657 | $91,042 | 2,833 | |
| 29 | Bellefonte | 58.40 | 6,009 | 0.7% | $309,022 | $62,540 | 0 | |
| 30 | Selinsgrove | 58.80 | 5,593 | 1.8% | $239,848 | $65,650 | 286 | |
| 31 | South Williamsport | 58.90 | 6,211 | 3.0% | $191,786 | $64,583 | 805 | |
| 32 | Olyphant | 59.15 | 5,381 | 4.7% | $228,298 | $66,423 | 409 | |
| 33 | Lewisburg | 59.20 | 5,257 | 0.7% | $326,711 | $54,767 | 691 | |
| 34 | Schuylkill Haven | 61.05 | 5,253 | 4.7% | $231,981 | $54,167 | 952 | |
| 35 | West View | 61.50 | 6,533 | 5.1% | $252,296 | $84,063 | 964 | |
| 36 | New Freedom | 61.65 | 5,066 | 1.9% | $417,281 | $120,037 | 2,623 | |
| 37 | Archbald | 61.80 | 7,404 | 1.4% | $242,130 | $71,936 | 608 | |
| 38 | Birdsboro | 62.30 | 5,116 | 1.7% | $331,845 | $86,290 | 801 | |
| 39 | Economy | 62.30 | 9,005 | 3.3% | $278,625 | $95,313 | 1,244 | |
| 40 | Canonsburg | 63.00 | 9,675 | 5.6% | $358,324 | $79,227 | 269 | |
| 41 | Lower Burrell | 64.25 | 11,633 | 3.3% | $200,396 | $84,602 | 318 | |
| 42 | Kennett Square | 64.75 | 6,243 | 3.1% | $620,982 | $80,505 | 769 | |
| 43 | Carnegie | 65.05 | 7,978 | 3.5% | $224,034 | $67,656 | 1,166 | |
| 44 | Bellevue | 65.20 | 8,128 | 4.7% | $236,965 | $68,827 | 1,218 | |
| 45 | Shillington | 65.90 | 5,492 | 6.1% | $260,081 | $79,922 | 728 | |
| 46 | Forest Hills | 66.75 | 6,286 | 7.5% | $222,967 | $89,688 | 986 | |
| 47 | State College | 67.10 | 41,050 | 5.0% | $408,500 | $45,424 | 1,286 | |
| 48 | West Chester | 68.15 | 20,666 | 7.0% | $657,113 | $78,385 | 1,418 | |
| 49 | Palmyra | 68.40 | 7,755 | 3.5% | $343,038 | $77,469 | 1,262 | |
| 50 | Norwood | 68.80 | 5,934 | 8.7% | $287,954 | $96,134 | 657 | |
| 51 | Old Forge | 69.60 | 8,573 | 5.5% | $207,907 | $71,812 | 642 | |
| 52 | Lansdale | 69.60 | 19,011 | 3.0% | $496,720 | $88,229 | 1,105 | |
| 53 | St. Marys | 70.30 | 12,529 | 7.7% | $165,531 | $67,167 | 1,361 | |
| 54 | Souderton | 70.60 | 7,181 | 4.1% | $462,110 | $93,537 | 905 | |
| 55 | Gettysburg | 71.00 | 8,254 | 5.7% | $366,471 | $54,365 | 848 | |
| 56 | Coraopolis | 71.65 | 5,417 | 4.5% | $302,086 | $63,828 | 1,292 | |
| 57 | Whitehall | 72.00 | 14,811 | 6.3% | $262,406 | $89,404 | 601 | |
| 58 | Huntingdon | 73.10 | 6,897 | 6.0% | $190,101 | $67,125 | 739 | |
| 59 | Wilson | 75.15 | 8,183 | 4.1% | $234,076 | $82,902 | 1,674 | |
| 60 | Catasauqua | 75.20 | 6,541 | 8.2% | $284,193 | $85,049 | 1,330 | |
| 61 | Millersville | 76.90 | 8,982 | 5.0% | $353,092 | $67,866 | 523 | |
| 62 | Ephrata | 77.50 | 13,772 | 2.4% | $249,296 | $69,735 | 2,302 | |
| 63 | Bloomsburg | 77.85 | 13,024 | 7.9% | $257,067 | $51,536 | 1,105 | |
| 64 | Dunmore | 78.00 | 14,181 | 3.8% | $217,857 | $71,302 | 1,619 | |
| 65 | Moosic | 78.20 | 5,973 | 2.6% | $238,010 | $80,187 | 1,440 | |
| 66 | Carlisle | 78.40 | 21,852 | 4.4% | $329,620 | $61,720 | 1,391 | |
| 67 | Stroudsburg | 78.80 | 5,894 | 5.0% | $346,453 | $66,674 | 0 | |
| 68 | Blakely | 78.80 | 6,662 | 5.3% | $220,301 | $55,855 | 856 | |
| 69 | Bangor | 78.90 | 5,163 | 2.9% | $324,590 | $70,076 | 1,123 | |
| 70 | Greensburg | 79.10 | 14,741 | 5.0% | $238,469 | $64,914 | 895 | |
| 71 | Bristol | 79.30 | 9,902 | 5.1% | $339,367 | $76,042 | 1,333 | |
| 72 | Palmerton | 80.30 | 5,622 | 1.8% | $254,962 | $68,143 | 711 | |
| 73 | Hermitage | 80.30 | 16,041 | 4.9% | $213,565 | $70,052 | 1,453 | |
| 74 | Edinboro | 81.70 | 5,440 | 0.4% | $288,726 | $48,173 | 1,011 | |
| 75 | Crafton | 82.50 | 5,961 | 7.4% | $208,119 | $64,006 | 2,416 | |
| 76 | Swoyersville | 83.30 | 5,048 | 3.9% | $206,255 | $71,555 | 812 | |
| 77 | New Holland | 83.30 | 5,780 | 1.8% | $408,128 | $63,182 | 1,747 | |
| 78 | Waynesboro | 83.30 | 11,047 | 4.9% | $275,318 | $66,956 | 1,150 | |
| 79 | Monaca | 83.85 | 5,519 | 5.1% | $209,283 | $73,538 | 852 | |
| 80 | Shippensburg | 84.25 | 5,620 | 3.9% | $197,415 | $51,503 | 1,157 | |
| 81 | Nazareth | 84.45 | 6,043 | 1.9% | $443,943 | $56,855 | 1,674 | |
| 82 | Pittston | 84.90 | 7,626 | 5.6% | $201,703 | $49,941 | 564 | |
| 83 | DuBois | 85.70 | 7,402 | 3.4% | $169,881 | $62,697 | 1,581 | |
| 84 | Glenolden | 85.90 | 7,220 | 7.6% | $241,350 | $72,786 | 2,271 | |
| 85 | Jefferson Hills | 86.80 | 12,317 | 5.7% | $350,948 | $116,064 | 9,534 | |
| 86 | Warren | 86.90 | 9,240 | 3.1% | $139,191 | $53,815 | 1,797 | |
| 87 | Manheim | 88.00 | 5,027 | 9.0% | $273,737 | $81,273 | 1,412 | |
| 88 | Indiana | 88.40 | 14,212 | 9.6% | $192,679 | $40,857 | 865 | |
| 89 | Sunbury | 88.75 | 9,617 | 4.8% | $177,767 | $51,028 | 291 | |
| 90 | Easton | 88.90 | 29,739 | 5.4% | $371,500 | $69,348 | 1,402 | |
| 91 | Bethlehem | 88.95 | 77,956 | 6.6% | $351,353 | $68,879 | 1,600 | |
| 92 | Baldwin | 90.00 | 21,057 | 1.9% | $231,521 | $80,983 | 9,534 | |
| 93 | West York | 90.10 | 5,092 | 3.4% | $137,313 | $80,995 | 1,748 | |
| 94 | Pittsburgh | 90.80 | 304,759 | 6.1% | $237,533 | $65,742 | 2,818 | |
| 95 | Red Lion | 91.00 | 6,516 | 3.1% | $291,903 | $72,901 | 2,623 | |
| 96 | East Stroudsburg | 91.70 | 9,319 | 8.3% | $309,993 | $59,821 | 0 | |
| 97 | Taylor | 91.80 | 6,265 | 5.5% | $192,995 | $71,599 | 1,619 | |
| 98 | Greenville | 92.10 | 5,523 | 4.7% | $154,867 | $52,661 | 1,304 | |
| 99 | Mount Carmel | 92.50 | 5,677 | 6.4% | $59,925 | $53,021 | 1,215 | |
| 100 | Kingston | 92.50 | 13,397 | 6.4% | $220,513 | $55,347 | 1,694 |
Source: U.S. Census ACS 2020-2024, FBI UCR, Zillow research. 175 places with more than 5,000 residents.
Summary
Summary: The Best Places In Pennsylvania
If you’re looking at areas in Pennsylvania with the best economic situations, where there’s lower than average crime, and a lot to do, this is an accurate list.
The best places to live in Pennsylvania are Clarks Summit, Lititz, Camp Hill, Conshohocken, Fox Chapel, Franklin Park, Swarthmore, Ambler, Oakmont, and Northampton.
Clarks Summit made a strong showing to take in the overall number one spot for the best place to live in Pennsylvania for 2026. Not sold on Pennsylvania? Take the two-minute Find Your Place quiz and see which state actually fits you.
Questions and answers
Best Places To Live In Pennsylvania FAQs
What is the best place to live in Pennsylvania?
Clarks Summit is the best place to live in Pennsylvania for 2026. It pairs a $92,083 median household income with a $323,510 median home value. Lititz and Camp Hill round out the top three.
What are the 10 best places to live in Pennsylvania?
The ten best places to live in Pennsylvania are Clarks Summit, Lititz, Camp Hill, Conshohocken, Fox Chapel, Franklin Park, Swarthmore, Ambler, Oakmont, and Northampton. We ranked all 175 places with more than 5,000 residents across nine criteria, from home values to commute times.
How expensive is it to live in the best parts of Pennsylvania?
The median home across the ten best places runs $463,267, versus $282,736 statewide. Quality shows up in the price tag; in Clarks Summit the typical home costs $323,510.
What is the worst place to live in Pennsylvania?
McKeesport lands at the bottom of this ranking, making it the worst place to live in Pennsylvania by the numbers. The full ordering of all 175 places is in the table above.
How do you rank the best places to live in Pennsylvania?
We score every Pennsylvania place with more than 5,000 residents on nine criteria covering jobs, housing, safety, and daily life, using Census American Community Survey and FBI crime data. The place with the best average rank, Clarks Summit, wins for 2026.


