Altoona SnackAbility
Overall SnackAbility
Crime in Altoona summary. We use data from the FBI to determine the crime rates in Altoona. Key points include:
There were 927 total crimes in Altoona in the last reporting year.
The overall crime rate per 100,000 people in Altoona is 2,185.1 / 100k people.
The violent crime rate per 100,000 people in Altoona is 334.7 / 100k people.
The property crime rate per 100,000 people in Altoona is 1,850.4 / 100k people.
Overall, crime in Altoona is 3.11% above the national average.
Total Crimes
Above National Average
Crime In Altoona Comparison Table
| Statistic | Count Raw |
Altoona / 100k People |
Pennsylvania / 100k People |
National / 100k People |
|---|---|---|---|---|
| Total Crimes Per 100K | 927 | 2,185.1 | 1,680.6 | 2,119.2 |
| Violent Crime | 142 | 334.7 | 245.6 | 359.0 |
| Murder | 1 | 2.4 | 5.0 | 5.0 |
| Robbery | 31 | 73.1 | 51.4 | 61.0 |
| Aggravated Assault | 78 | 183.9 | 161.4 | 256.0 |
| Property Crime | 785 | 1,850.4 | 1,435.0 | 1,760.0 |
| Burglary | 141 | 332.4 | 116.7 | 229.0 |
| Larceny | 595 | 1,402.5 | 1,129.8 | 1,272.0 |
| Car Theft | 49 | 115.5 | 188.5 | 259.0 |
Source: FBI Uniform Crime Reporting (2024)
Cost of living in Altoona summary. We use data on the cost of living to determine how expensive it is to live in Altoona. Real estate prices drive most of the variance in cost of living around Pennsylvania. Key points include:
The cost of living in Altoona is 89 with 100 being average.
The cost of living in Altoona is 0.9x lower than the national average.
The median home value in Altoona is $134,583.
The median income in Altoona is $51,250.
Altoona's Overall Cost Of Living
Lower Than The National Average
Cost Of Living In Altoona Comparison Table
| Living Expense | Altoona | Pennsylvania | National Average |
|---|---|---|---|
| Overall | 89 | 97 | 100 |
| Services | 99 | 99 | 100 |
| Groceries | 96 | 100 | 100 |
| Health | 59 | 88 | 100 |
| Housing | 103 | 102 | 100 |
| Transportation | 100 | 100 | 100 |
| Utilities | 100 | 101 | 100 |
Source: Cost of living index, normalized to US average = 100
Altoona, PA Weather
The average high in Altoona is 59.6° and the average low is 38.9°.
There are 83.3 days of precipitation each year.
Expect an average of 39.2 inches of precipitation each year with 29.7 inches of snow.
| Stat | Altoona |
|---|---|
| Average Annual High | 59.6 |
| Average Annual Low | 38.9 |
| Annual Precipitation Days | 83.3 |
| Average Annual Precipitation | 39.2 |
| Average Annual Snowfall | 29.7 |
Average High
Days of Rain
Source: NOAA climate normals (30-year)
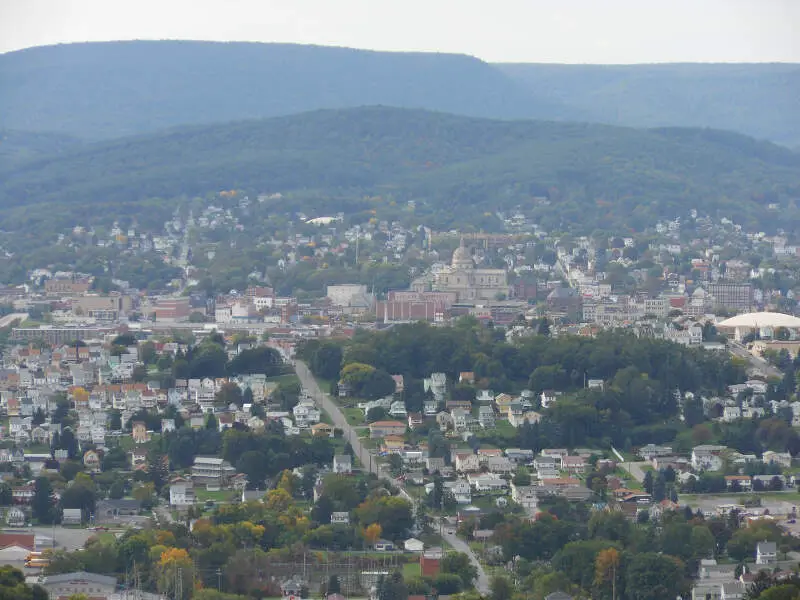
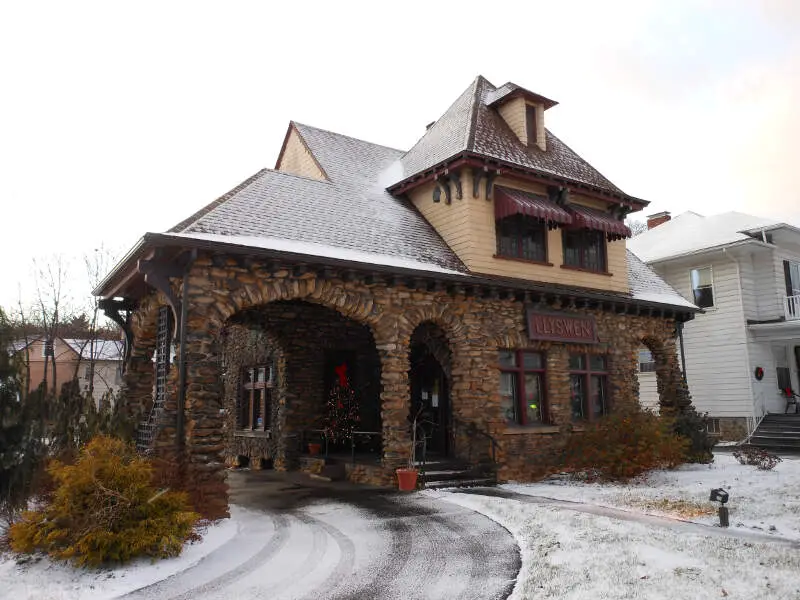
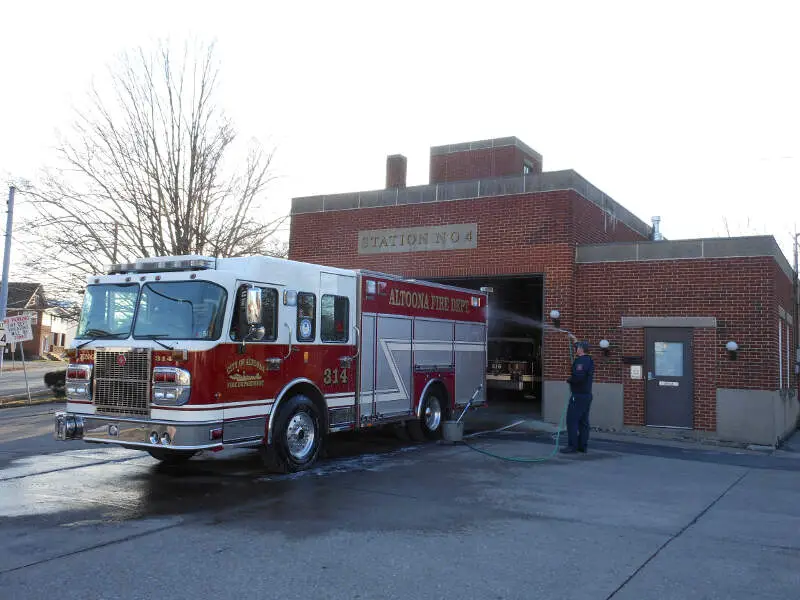
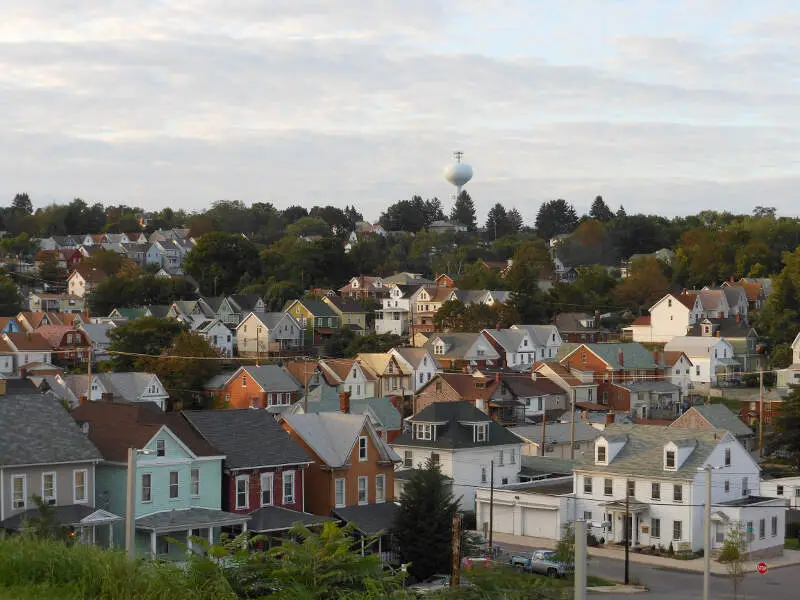
Altoona, PA Photos
2 Reviews & Comments About Altoona

Altoona is an excellent place to go, either for recreation, shopping, or staying the night. The cops keep things nice and safe. The air is clean, and the roads are well-kept. Traffic sometimes get busy, but that is to be expected in a big small-town. The most important aspect of Altoona that stands out are the shops and the options you have. There is literally food on every street corner, two separate malls, and hundreds, maybe thousands, of places to go and see. It also has some public transit, libraries, plenty of doctors' offices, and I hear, good schools, and some nearby colleges. Another good aspect of this town is that, if you can't find it here, Altoona is kind of a hub that is connected to somewhere where you will find what you're looking for. If you like train watching, there are several vantage points from which to view, and taking the highway route 22, from Gallitzin, you will be able to see the famous Horseshoe Curve.
If you plan to visit, you may want to use Google maps and familiarize yourself with the road system. In-town Altoona, as we call it here, is where the UPMC Altoona hospital is. That is near the 'old section' of town, and is kind of dumpy and run-down but still nice. The 'new' section of the city is heading more towards Duncansville, which is sometimes confused with Altoona. This is where the action starts! You've got the Logan Valley Mall, Wal-Mart, two movie theaters, and other things. Heading more towards Duncansville but splitting off, you've got the road to Hollidaysburg, another nice little town, which is kind of ritzy. You can use Convention Center Boulevard behind Wal-Mart to make a short cut to this road, then make a right, and you'll get on a split two-lane, two-way road. When I was little, as an out-of-towner, I remember that one summer my mother took my brother and I every day to Altoona and we all shopped and just ran through the mall!! That was back when arcades were still around. I love that mall! Most malls have suffered over the years, but it is almost fully stocked with stores.
Everything here is out dated. The wind never stops. There is nothing to do.
Just dont go to the 16602 area code.
Rankings & Articles For Altoona


Locations Around Altoona
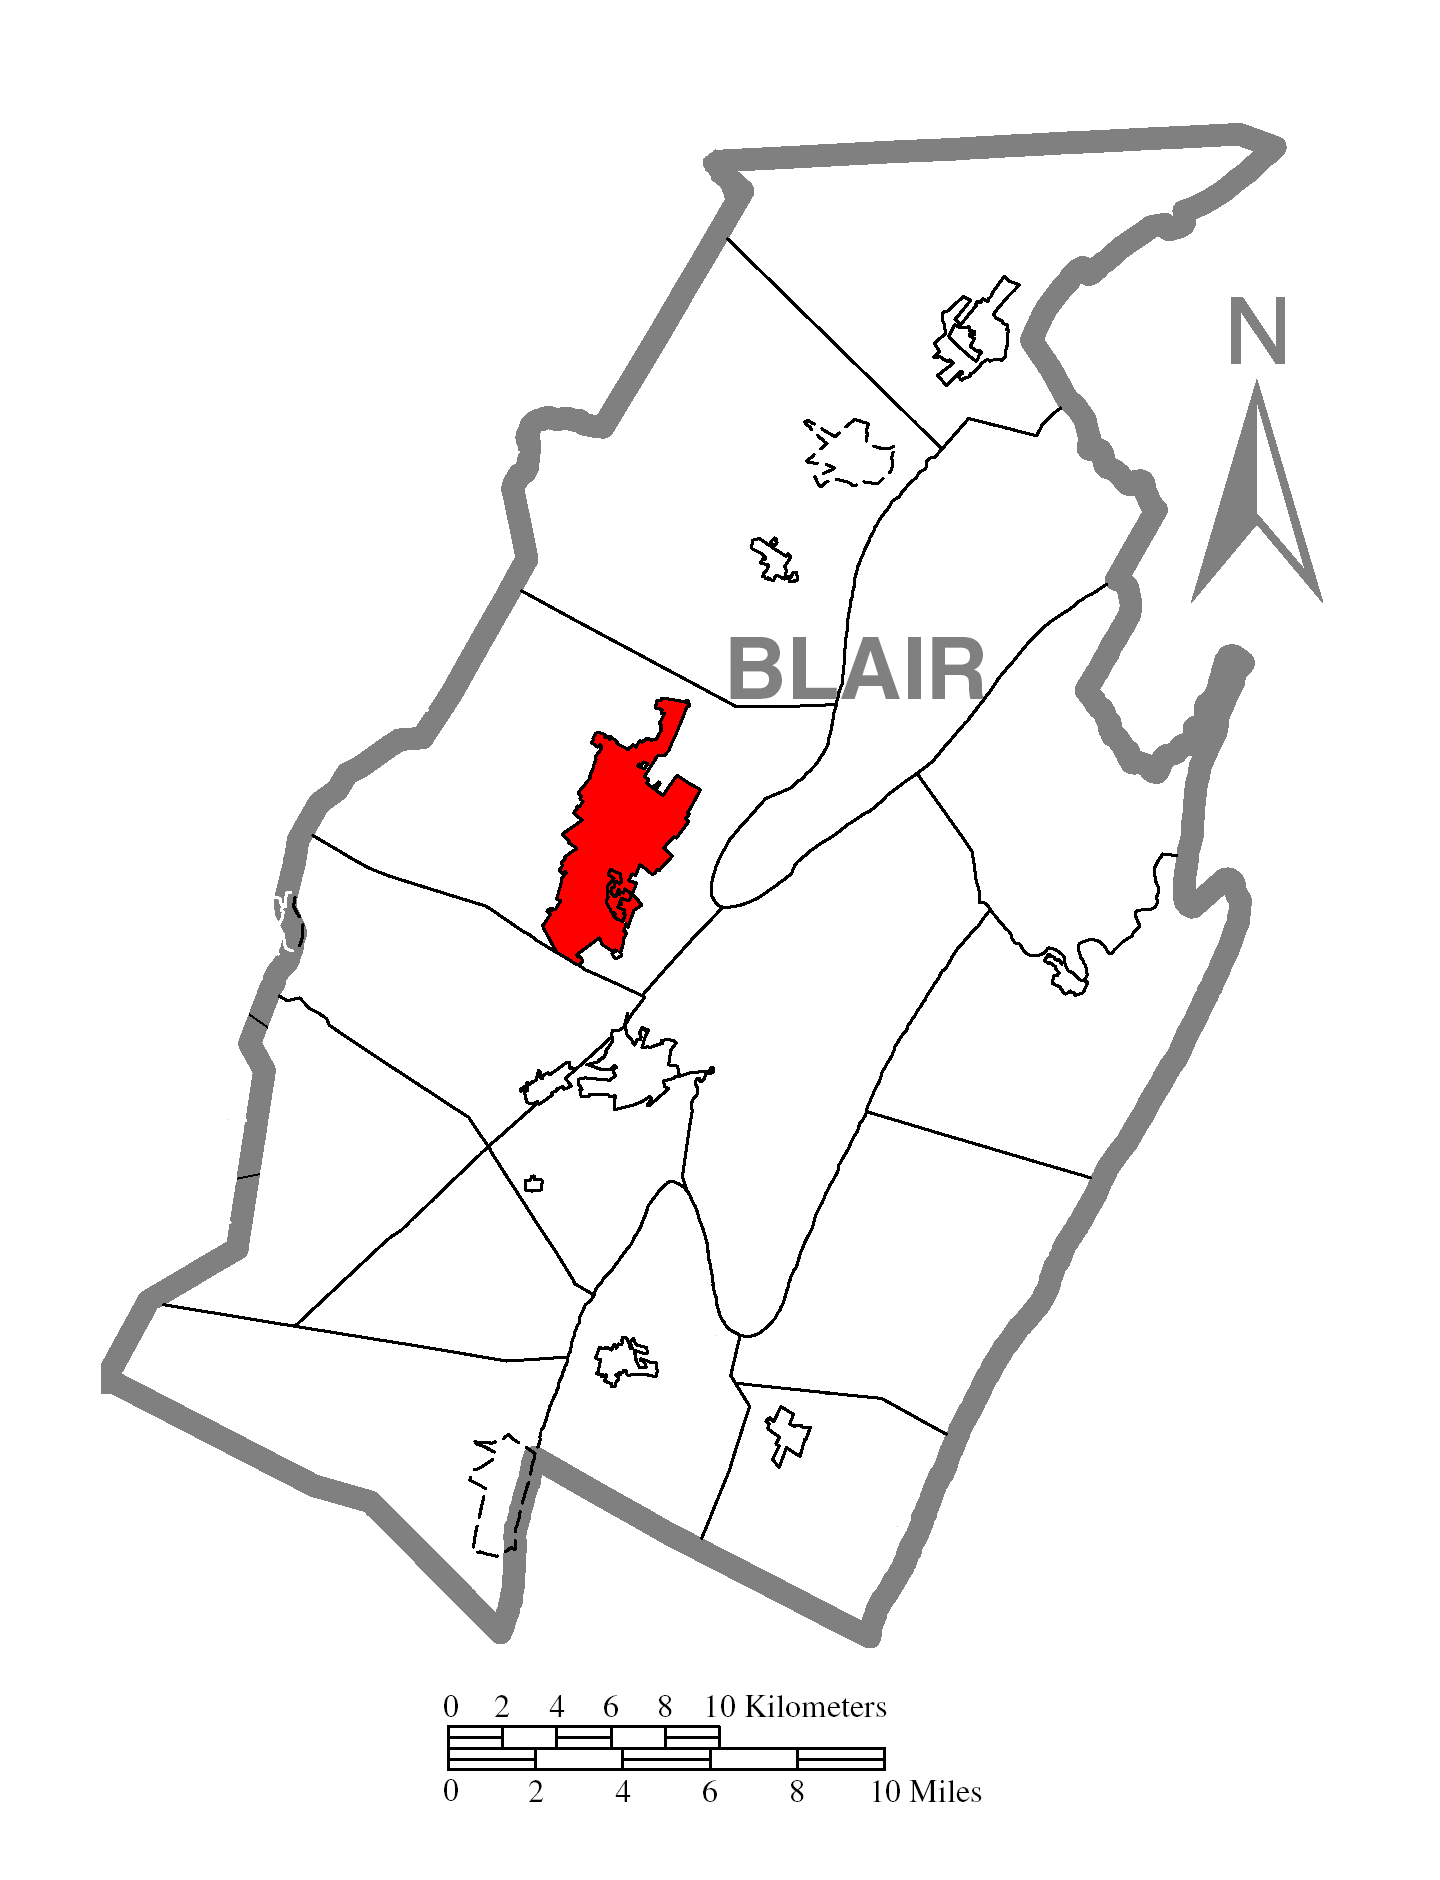
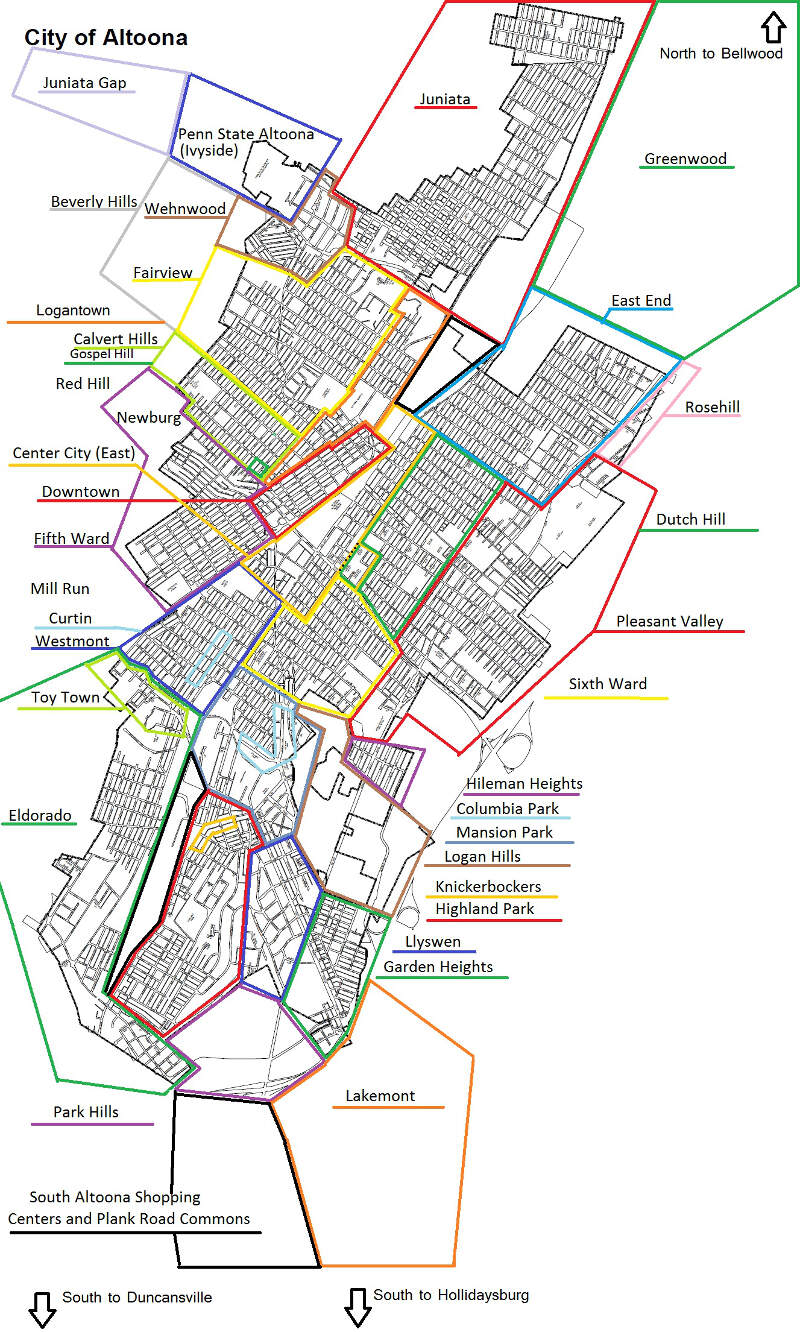
Map Of Altoona, PA
Best Places Around Altoona
State College, PA
Population 41,050
Bellefonte, PA
Population 6,009
Indiana, PA
Population 14,212
Westmont, PA
Population 4,855
Hollidaysburg, PA
Population 5,558
Huntingdon, PA
Population 6,897
Tyrone, PA
Population 5,377
Franklin, PA
Population 265
Franklin, PA
Population 265
DuBois, PA
Population 7,402
Altoona Demographics And Statistics
Population over time in Altoona
The current population in Altoona is 43,196. The population has decreased 7.9% from 2010.
| Year | Population | % Change |
|---|---|---|
| 2024 | 43,196 | -0.7% |
| 2023 | 43,508 | -0.7% |
| 2022 | 43,821 | -0.7% |
| 2021 | 44,114 | 1.0% |
| 2020 | 43,669 | -0.7% |
| 2019 | 43,987 | -0.9% |
| 2018 | 44,372 | -0.8% |
| 2017 | 44,749 | -1.0% |
| 2016 | 45,209 | -1.3% |
| 2015 | 45,814 | -0.4% |
| 2014 | 45,987 | -0.5% |
| 2013 | 46,195 | -0.5% |
| 2012 | 46,434 | -0.5% |
| 2011 | 46,662 | -0.5% |
| 2010 | 46,883 | - |
Race / Ethnicity in Altoona
See the full breakdown
Altoona is:
88.0% White with 38,028 White residents.
3.6% African American with 1,557 African American residents.
0.0% American Indian with 16 American Indian residents.
0.8% Asian with 351 Asian residents.
0.0% Hawaiian with 0 Hawaiian residents.
0.2% Other with 72 Other residents.
5.8% Two Or More with 2,490 Two Or More residents.
1.6% Hispanic with 682 Hispanic residents.
| Race | Altoona | PA | USA |
|---|---|---|---|
| White | 88.0% | 73.0% | 57.4% |
| African American | 3.6% | 10.3% | 11.9% |
| American Indian | 0.0% | 0.1% | 0.5% |
| Asian | 0.8% | 3.8% | 5.9% |
| Hawaiian | 0.0% | 0.0% | 0.2% |
| Other | 0.2% | 0.5% | 0.6% |
| Two Or More | 5.8% | 3.6% | 4.3% |
| Hispanic | 1.6% | 8.7% | 19.3% |
Gender in Altoona
See the full breakdown
Altoona is 50.7% female with 21,909 female residents.
Altoona is 49.3% male with 21,286 male residents.
| Gender | Altoona | PA | USA |
|---|---|---|---|
| Female | 50.7% | 50.7% | 50.5% |
| Male | 49.3% | 49.3% | 49.5% |
Highest level of educational attainment in Altoona for adults over 25
See the full breakdown
2.0% of adults in Altoona completed < 9th grade.
5.0% of adults in Altoona completed 9-12th grade.
49.0% of adults in Altoona completed high school / ged.
15.0% of adults in Altoona completed some college.
8.0% of adults in Altoona completed associate's degree.
15.0% of adults in Altoona completed bachelor's degree.
4.0% of adults in Altoona completed master's degree.
1.0% of adults in Altoona completed professional degree.
1.0% of adults in Altoona completed doctorate degree.
| Education | Altoona | PA | USA |
|---|---|---|---|
| < 9th Grade | 2.0% | 3.0% | 4.0% |
| 9-12th Grade | 5.0% | 5.0% | 6.0% |
| High School / GED | 49.0% | 33.0% | 26.0% |
| Some College | 15.0% | 15.0% | 19.0% |
| Associate's Degree | 8.0% | 9.0% | 9.0% |
| Bachelor's Degree | 15.0% | 21.0% | 22.0% |
| Master's Degree | 4.0% | 10.0% | 10.0% |
| Professional Degree | 1.0% | 2.0% | 2.0% |
| Doctorate Degree | 1.0% | 2.0% | 2.0% |
Household Income For Altoona, Pennsylvania
See the full breakdown
6.6% of households in Altoona earn Less than $10,000.
6.5% of households in Altoona earn $10,000 to $14,999.
11.2% of households in Altoona earn $15,000 to $24,999.
8.3% of households in Altoona earn $25,000 to $34,999.
16.0% of households in Altoona earn $35,000 to $49,999.
18.0% of households in Altoona earn $50,000 to $74,999.
10.7% of households in Altoona earn $75,000 to $99,999.
13.7% of households in Altoona earn $100,000 to $149,999.
6.4% of households in Altoona earn $150,000 to $199,999.
2.6% of households in Altoona earn $200,000 or more.
| Income | Altoona | PA | USA |
|---|---|---|---|
| Less than $10,000 | 6.6% | 4.9% | 5.0% |
| $10,000 to $14,999 | 6.5% | 3.5% | 3.4% |
| $15,000 to $24,999 | 11.2% | 6.7% | 6.3% |
| $25,000 to $34,999 | 8.3% | 6.9% | 6.6% |
| $35,000 to $49,999 | 16.0% | 10.5% | 10.1% |
| $50,000 to $74,999 | 18.0% | 15.9% | 15.5% |
| $75,000 to $99,999 | 10.7% | 12.8% | 12.6% |
| $100,000 to $149,999 | 13.7% | 17.7% | 17.5% |
| $150,000 to $199,999 | 6.4% | 9.3% | 9.6% |
| $200,000 or more | 2.6% | 11.8% | 13.4% |
Source: U.S. Census ACS 5-year estimates (2024)


