Collingdale SnackAbility
Overall SnackAbility
Cost of living in Collingdale summary. We use data on the cost of living to determine how expensive it is to live in Collingdale. Real estate prices drive most of the variance in cost of living around Pennsylvania. Key points include:
The cost of living in Collingdale is 96 with 100 being average.
The cost of living in Collingdale is 1.0x lower than the national average.
The median home value in Collingdale is $201,850.
The median income in Collingdale is $51,886.
Collingdale's Overall Cost Of Living
Lower Than The National Average
Cost Of Living In Collingdale Comparison Table
| Living Expense | Collingdale | Pennsylvania | National Average |
|---|---|---|---|
| Overall | 96 | 97 | 100 |
| Services | 107 | 99 | 100 |
| Groceries | 103 | 100 | 100 |
| Health | 79 | 88 | 100 |
| Housing | 107 | 102 | 100 |
| Transportation | 98 | 100 | 100 |
| Utilities | 110 | 101 | 100 |
Source: Cost of living index, normalized to US average = 100
Collingdale, PA Weather
The average high in Collingdale is 64.1° and the average low is 46.3°.
There are 73.6 days of precipitation each year.
Expect an average of 45.1 inches of precipitation each year with 15.1 inches of snow.
| Stat | Collingdale |
|---|---|
| Average Annual High | 64.1 |
| Average Annual Low | 46.3 |
| Annual Precipitation Days | 73.6 |
| Average Annual Precipitation | 45.1 |
| Average Annual Snowfall | 15.1 |
Average High
Days of Rain
Source: NOAA climate normals (30-year)
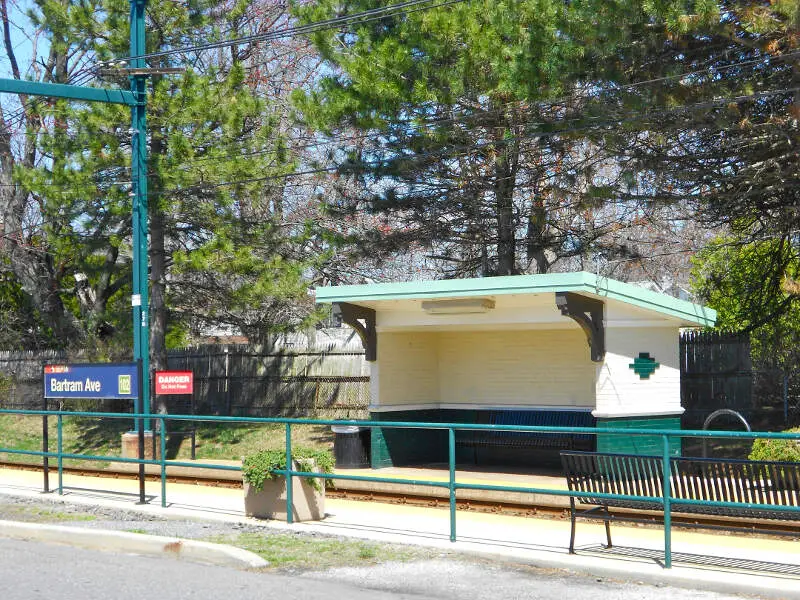
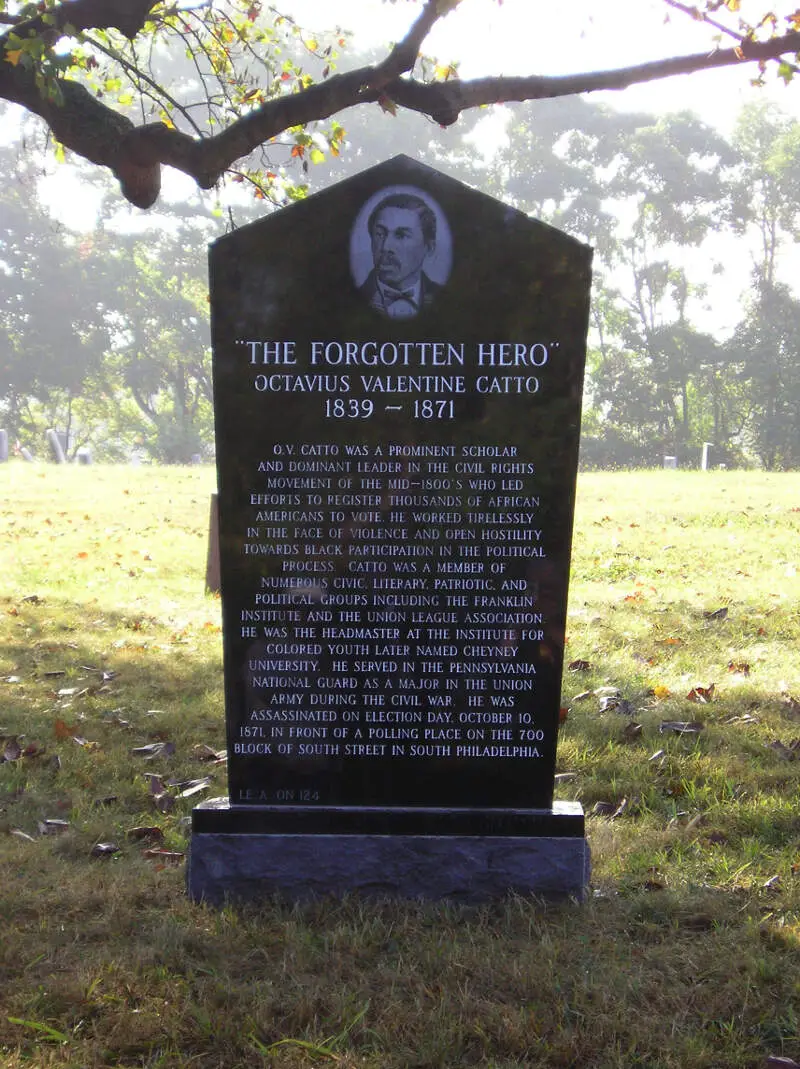
Collingdale, PA Photos
Rankings & Articles For Collingdale


Locations Around Collingdale
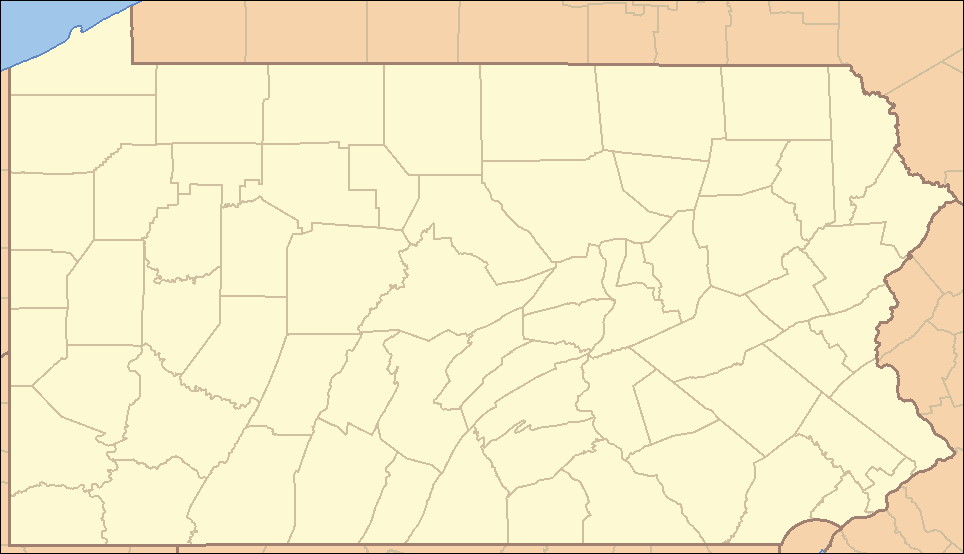
Map Of Collingdale, PA
Best Places Around Collingdale
Ashland, NJ
Population 9,320
Springdale, NJ
Population 15,173
Ramblewood, NJ
Population 6,611
Greentree, NJ
Population 11,537
Penn Wynne, PA
Population 6,070
Oreland, PA
Population 5,953
Glenside, PA
Population 7,659
Wyndmoor, PA
Population 5,633
Maple Glen, PA
Population 6,643
Ardmore, PA
Population 13,909
Collingdale Demographics And Statistics
Population over time in Collingdale
The current population in Collingdale is 8,897. The population has increased 1.6% from 2010.
| Year | Population | % Change |
|---|---|---|
| 2024 | 8,897 | 0.4% |
| 2023 | 8,862 | -0.0% |
| 2022 | 8,865 | 0.1% |
| 2021 | 8,857 | 0.9% |
| 2020 | 8,776 | -0.2% |
| 2019 | 8,791 | 0.0% |
| 2018 | 8,790 | -0.1% |
| 2017 | 8,800 | 0.3% |
| 2016 | 8,777 | -0.1% |
| 2015 | 8,786 | 0.1% |
| 2014 | 8,778 | -0.1% |
| 2013 | 8,786 | 0.0% |
| 2012 | 8,782 | 0.2% |
| 2011 | 8,768 | 0.1% |
| 2010 | 8,757 | - |
Race / Ethnicity in Collingdale
See the full breakdown
Collingdale is:
27.8% White with 2,473 White residents.
57.2% African American with 5,093 African American residents.
0.1% American Indian with 9 American Indian residents.
4.3% Asian with 385 Asian residents.
0.0% Hawaiian with 0 Hawaiian residents.
0.3% Other with 31 Other residents.
2.9% Two Or More with 257 Two Or More residents.
7.3% Hispanic with 649 Hispanic residents.
| Race | Collingdale | PA | USA |
|---|---|---|---|
| White | 27.8% | 73.0% | 57.4% |
| African American | 57.2% | 10.3% | 11.9% |
| American Indian | 0.1% | 0.1% | 0.5% |
| Asian | 4.3% | 3.8% | 5.9% |
| Hawaiian | 0.0% | 0.0% | 0.2% |
| Other | 0.3% | 0.5% | 0.6% |
| Two Or More | 2.9% | 3.6% | 4.3% |
| Hispanic | 7.3% | 8.7% | 19.3% |
Gender in Collingdale
See the full breakdown
Collingdale is 51.9% female with 4,621 female residents.
Collingdale is 48.1% male with 4,276 male residents.
| Gender | Collingdale | PA | USA |
|---|---|---|---|
| Female | 51.9% | 50.7% | 50.5% |
| Male | 48.1% | 49.3% | 49.5% |
Highest level of educational attainment in Collingdale for adults over 25
See the full breakdown
8.0% of adults in Collingdale completed < 9th grade.
7.0% of adults in Collingdale completed 9-12th grade.
35.0% of adults in Collingdale completed high school / ged.
23.0% of adults in Collingdale completed some college.
11.0% of adults in Collingdale completed associate's degree.
9.0% of adults in Collingdale completed bachelor's degree.
6.0% of adults in Collingdale completed master's degree.
0.0% of adults in Collingdale completed professional degree.
1.0% of adults in Collingdale completed doctorate degree.
| Education | Collingdale | PA | USA |
|---|---|---|---|
| < 9th Grade | 8.0% | 3.0% | 4.0% |
| 9-12th Grade | 7.0% | 5.0% | 6.0% |
| High School / GED | 35.0% | 33.0% | 26.0% |
| Some College | 23.0% | 15.0% | 19.0% |
| Associate's Degree | 11.0% | 9.0% | 9.0% |
| Bachelor's Degree | 9.0% | 21.0% | 22.0% |
| Master's Degree | 6.0% | 10.0% | 10.0% |
| Professional Degree | 0.0% | 2.0% | 2.0% |
| Doctorate Degree | 1.0% | 2.0% | 2.0% |
Household Income For Collingdale, Pennsylvania
See the full breakdown
9.9% of households in Collingdale earn Less than $10,000.
11.7% of households in Collingdale earn $10,000 to $14,999.
3.4% of households in Collingdale earn $15,000 to $24,999.
7.6% of households in Collingdale earn $25,000 to $34,999.
14.1% of households in Collingdale earn $35,000 to $49,999.
19.4% of households in Collingdale earn $50,000 to $74,999.
16.1% of households in Collingdale earn $75,000 to $99,999.
11.7% of households in Collingdale earn $100,000 to $149,999.
4.2% of households in Collingdale earn $150,000 to $199,999.
1.8% of households in Collingdale earn $200,000 or more.
| Income | Collingdale | PA | USA |
|---|---|---|---|
| Less than $10,000 | 9.9% | 4.9% | 5.0% |
| $10,000 to $14,999 | 11.7% | 3.5% | 3.4% |
| $15,000 to $24,999 | 3.4% | 6.7% | 6.3% |
| $25,000 to $34,999 | 7.6% | 6.9% | 6.6% |
| $35,000 to $49,999 | 14.1% | 10.5% | 10.1% |
| $50,000 to $74,999 | 19.4% | 15.9% | 15.5% |
| $75,000 to $99,999 | 16.1% | 12.8% | 12.6% |
| $100,000 to $149,999 | 11.7% | 17.7% | 17.5% |
| $150,000 to $199,999 | 4.2% | 9.3% | 9.6% |
| $200,000 or more | 1.8% | 11.8% | 13.4% |
Source: U.S. Census ACS 5-year estimates (2024)


