Dickson City SnackAbility
Overall SnackAbility
Cost of living in Dickson City summary. We use data on the cost of living to determine how expensive it is to live in Dickson City. Real estate prices drive most of the variance in cost of living around Pennsylvania. Key points include:
The cost of living in Dickson City is 94 with 100 being average.
The cost of living in Dickson City is 0.9x lower than the national average.
The median home value in Dickson City is $213,635.
The median income in Dickson City is $59,963.
Dickson City's Overall Cost Of Living
Lower Than The National Average
Cost Of Living In Dickson City Comparison Table
| Living Expense | Dickson City | Pennsylvania | National Average |
|---|---|---|---|
| Overall | 94 | 97 | 100 |
| Services | 99 | 99 | 100 |
| Groceries | 102 | 100 | 100 |
| Health | 83 | 88 | 100 |
| Housing | 95 | 102 | 100 |
| Transportation | 104 | 100 | 100 |
| Utilities | 100 | 101 | 100 |
Source: Cost of living index, normalized to US average = 100
Dickson City, PA Weather
The average high in Dickson City is 59.4° and the average low is 39.0°.
There are 76.6 days of precipitation each year.
Expect an average of 39.7 inches of precipitation each year with 59.0 inches of snow.
| Stat | Dickson City |
|---|---|
| Average Annual High | 59.4 |
| Average Annual Low | 39.0 |
| Annual Precipitation Days | 76.6 |
| Average Annual Precipitation | 39.7 |
| Average Annual Snowfall | 59.0 |
Average High
Days of Rain
Source: NOAA climate normals (30-year)
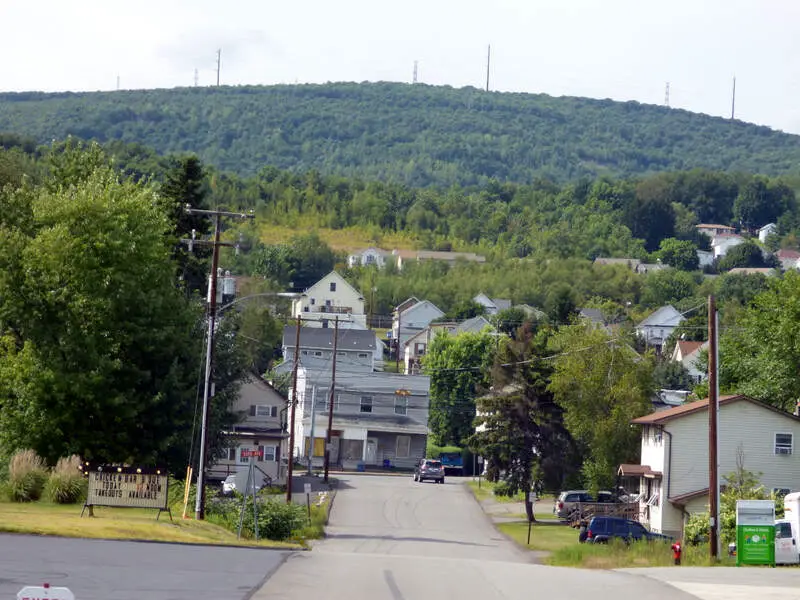
Dickson City, PA Photos
1 Reviews & Comments About Dickson City

I live in Northeast Pennsylvania. I agree with almost all of these except Dickson City. If you've been there it's a place filled with beautiful restaurants tons of things to do malls great restaurants in a lot of other really nice things. I don't live in Dickson City but I do know it's a very clean City and I have no idea how in the h**l it made the top 10. Clarks Summit Pennsylvania should be the number one nicest place to live. With a very good employment rate, one of the top rated high schools in the country, and phenomenal Athletics including many state champions over several Sports over the past few years. And we're a public school. Which means we don't go out and recruit children like colleges do when they become men. Clarks Summit Pennsylvania, the number one best place to live in Northeast Pennsylvania or maybe all of Pennsylvania.
Rankings & Articles For Dickson City


Locations Around Dickson City
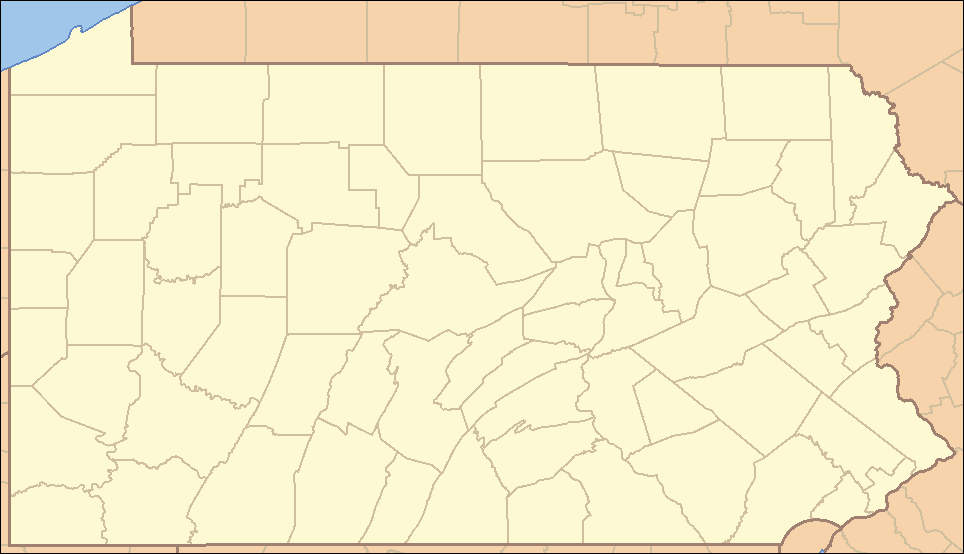
Map Of Dickson City, PA
Best Places Around Dickson City
Dickson City Demographics And Statistics
Population over time in Dickson City
The current population in Dickson City is 6,023. The population has decreased 0.9% from 2010.
| Year | Population | % Change |
|---|---|---|
| 2024 | 6,023 | 0.0% |
| 2023 | 6,022 | -0.1% |
| 2022 | 6,026 | -0.3% |
| 2021 | 6,047 | 4.7% |
| 2020 | 5,778 | -0.4% |
| 2019 | 5,802 | -1.1% |
| 2018 | 5,868 | -0.6% |
| 2017 | 5,903 | -1.1% |
| 2016 | 5,970 | -0.6% |
| 2015 | 6,005 | -0.7% |
| 2014 | 6,049 | -0.1% |
| 2013 | 6,058 | -0.5% |
| 2012 | 6,088 | 0.0% |
| 2011 | 6,086 | 0.1% |
| 2010 | 6,078 | - |
Race / Ethnicity in Dickson City
See the full breakdown
Dickson City is:
88.0% White with 5,303 White residents.
0.5% African American with 32 African American residents.
0.0% American Indian with 2 American Indian residents.
2.8% Asian with 166 Asian residents.
0.0% Hawaiian with 0 Hawaiian residents.
1.8% Other with 107 Other residents.
0.9% Two Or More with 53 Two Or More residents.
6.0% Hispanic with 360 Hispanic residents.
| Race | Dickson City | PA | USA |
|---|---|---|---|
| White | 88.0% | 73.0% | 57.4% |
| African American | 0.5% | 10.3% | 11.9% |
| American Indian | 0.0% | 0.1% | 0.5% |
| Asian | 2.8% | 3.8% | 5.9% |
| Hawaiian | 0.0% | 0.0% | 0.2% |
| Other | 1.8% | 0.5% | 0.6% |
| Two Or More | 0.9% | 3.6% | 4.3% |
| Hispanic | 6.0% | 8.7% | 19.3% |
Gender in Dickson City
See the full breakdown
Dickson City is 56.0% female with 3,373 female residents.
Dickson City is 44.0% male with 2,649 male residents.
| Gender | Dickson City | PA | USA |
|---|---|---|---|
| Female | 56.0% | 50.7% | 50.5% |
| Male | 44.0% | 49.3% | 49.5% |
Highest level of educational attainment in Dickson City for adults over 25
See the full breakdown
1.0% of adults in Dickson City completed < 9th grade.
8.0% of adults in Dickson City completed 9-12th grade.
38.0% of adults in Dickson City completed high school / ged.
17.0% of adults in Dickson City completed some college.
11.0% of adults in Dickson City completed associate's degree.
14.0% of adults in Dickson City completed bachelor's degree.
8.0% of adults in Dickson City completed master's degree.
1.0% of adults in Dickson City completed professional degree.
2.0% of adults in Dickson City completed doctorate degree.
| Education | Dickson City | PA | USA |
|---|---|---|---|
| < 9th Grade | 1.0% | 3.0% | 4.0% |
| 9-12th Grade | 8.0% | 5.0% | 6.0% |
| High School / GED | 38.0% | 33.0% | 26.0% |
| Some College | 17.0% | 15.0% | 19.0% |
| Associate's Degree | 11.0% | 9.0% | 9.0% |
| Bachelor's Degree | 14.0% | 21.0% | 22.0% |
| Master's Degree | 8.0% | 10.0% | 10.0% |
| Professional Degree | 1.0% | 2.0% | 2.0% |
| Doctorate Degree | 2.0% | 2.0% | 2.0% |
Household Income For Dickson City, Pennsylvania
See the full breakdown
8.7% of households in Dickson City earn Less than $10,000.
4.4% of households in Dickson City earn $10,000 to $14,999.
5.8% of households in Dickson City earn $15,000 to $24,999.
11.4% of households in Dickson City earn $25,000 to $34,999.
11.4% of households in Dickson City earn $35,000 to $49,999.
18.3% of households in Dickson City earn $50,000 to $74,999.
10.2% of households in Dickson City earn $75,000 to $99,999.
18.5% of households in Dickson City earn $100,000 to $149,999.
7.3% of households in Dickson City earn $150,000 to $199,999.
4.1% of households in Dickson City earn $200,000 or more.
| Income | Dickson City | PA | USA |
|---|---|---|---|
| Less than $10,000 | 8.7% | 4.9% | 5.0% |
| $10,000 to $14,999 | 4.4% | 3.5% | 3.4% |
| $15,000 to $24,999 | 5.8% | 6.7% | 6.3% |
| $25,000 to $34,999 | 11.4% | 6.9% | 6.6% |
| $35,000 to $49,999 | 11.4% | 10.5% | 10.1% |
| $50,000 to $74,999 | 18.3% | 15.9% | 15.5% |
| $75,000 to $99,999 | 10.2% | 12.8% | 12.6% |
| $100,000 to $149,999 | 18.5% | 17.7% | 17.5% |
| $150,000 to $199,999 | 7.3% | 9.3% | 9.6% |
| $200,000 or more | 4.1% | 11.8% | 13.4% |
Source: U.S. Census ACS 5-year estimates (2024)


