Harrisburg SnackAbility
Overall SnackAbility
Crime in Harrisburg summary. We use data from the FBI to determine the crime rates in Harrisburg. Key points include:
There were 1,377 total crimes in Harrisburg in the last reporting year.
The overall crime rate per 100,000 people in Harrisburg is 2,754.8 / 100k people.
The violent crime rate per 100,000 people in Harrisburg is 762.2 / 100k people.
The property crime rate per 100,000 people in Harrisburg is 1,992.6 / 100k people.
Overall, crime in Harrisburg is 29.99% above the national average.
Total Crimes
Above National Average
Crime In Harrisburg Comparison Table
| Statistic | Count Raw |
Harrisburg / 100k People |
Pennsylvania / 100k People |
National / 100k People |
|---|---|---|---|---|
| Total Crimes Per 100K | 1,377 | 2,754.8 | 1,680.6 | 2,119.2 |
| Violent Crime | 381 | 762.2 | 245.6 | 359.0 |
| Murder | 15 | 30.0 | 5.0 | 5.0 |
| Robbery | 82 | 164.0 | 51.4 | 61.0 |
| Aggravated Assault | 257 | 514.2 | 161.4 | 256.0 |
| Property Crime | 996 | 1,992.6 | 1,435.0 | 1,760.0 |
| Burglary | 167 | 334.1 | 116.7 | 229.0 |
| Larceny | 586 | 1,172.4 | 1,129.8 | 1,272.0 |
| Car Theft | 243 | 486.1 | 188.5 | 259.0 |
Source: FBI Uniform Crime Reporting (2024)
Cost of living in Harrisburg summary. We use data on the cost of living to determine how expensive it is to live in Harrisburg. Real estate prices drive most of the variance in cost of living around Pennsylvania. Key points include:
The cost of living in Harrisburg is 89 with 100 being average.
The cost of living in Harrisburg is 0.9x lower than the national average.
The median home value in Harrisburg is $263,369.
The median income in Harrisburg is $48,099.
Harrisburg's Overall Cost Of Living
Lower Than The National Average
Cost Of Living In Harrisburg Comparison Table
| Living Expense | Harrisburg | Pennsylvania | National Average |
|---|---|---|---|
| Overall | 89 | 97 | 100 |
| Services | 98 | 99 | 100 |
| Groceries | 100 | 100 | 100 |
| Health | 60 | 88 | 100 |
| Housing | 100 | 102 | 100 |
| Transportation | 95 | 100 | 100 |
| Utilities | 95 | 101 | 100 |
Source: Cost of living index, normalized to US average = 100
Harrisburg, PA Weather
The average high in Harrisburg is 62.2° and the average low is 43.3°.
There are 74.5 days of precipitation each year.
Expect an average of 42.1 inches of precipitation each year with 27.2 inches of snow.
| Stat | Harrisburg |
|---|---|
| Average Annual High | 62.2 |
| Average Annual Low | 43.3 |
| Annual Precipitation Days | 74.5 |
| Average Annual Precipitation | 42.1 |
| Average Annual Snowfall | 27.2 |
Average High
Days of Rain
Source: NOAA climate normals (30-year)
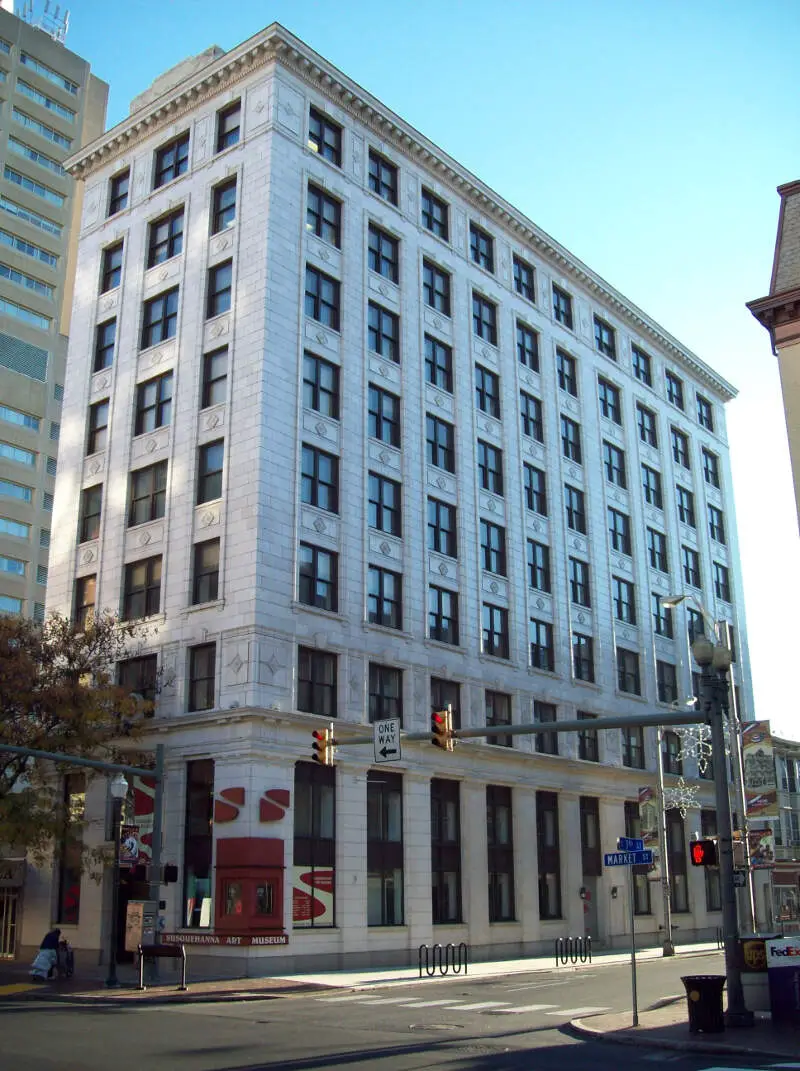
Harrisburg, PA Photos


1 Reviews & Comments About Harrisburg

I live in the suburbs of Harrisburg, and that place s***s too.
Rankings & Articles For Harrisburg


Locations Around Harrisburg
Map Of Harrisburg, PA
Best Places Around Harrisburg
Camp Hill, PA
Population 8,169
Linglestown, PA
Population 6,957
New Cumberland, PA
Population 7,580
Lower Allen, PA
Population 7,646
Schlusser, PA
Population 5,402
Progress, PA
Population 11,017
Middletown, PA
Population 7,628
Middletown, PA
Population 7,628
Palmyra, PA
Population 7,755
Harrisburg Demographics And Statistics
Population over time in Harrisburg
The current population in Harrisburg is 50,287. The population has increased 1.9% from 2010.
| Year | Population | % Change |
|---|---|---|
| 2024 | 50,287 | 0.4% |
| 2023 | 50,092 | 0.1% |
| 2022 | 50,055 | 0.2% |
| 2021 | 49,969 | 1.5% |
| 2020 | 49,247 | 0.1% |
| 2019 | 49,209 | -0.0% |
| 2018 | 49,230 | -0.1% |
| 2017 | 49,278 | 0.2% |
| 2016 | 49,160 | -0.1% |
| 2015 | 49,232 | -0.1% |
| 2014 | 49,297 | -0.2% |
| 2013 | 49,395 | -0.0% |
| 2012 | 49,401 | -0.2% |
| 2011 | 49,499 | 0.3% |
| 2010 | 49,332 | - |
Race / Ethnicity in Harrisburg
See the full breakdown
Harrisburg is:
25.2% White with 12,687 White residents.
40.9% African American with 20,570 African American residents.
0.1% American Indian with 58 American Indian residents.
2.2% Asian with 1,110 Asian residents.
0.1% Hawaiian with 56 Hawaiian residents.
0.3% Other with 167 Other residents.
4.7% Two Or More with 2,358 Two Or More residents.
26.4% Hispanic with 13,281 Hispanic residents.
| Race | Harrisburg | PA | USA |
|---|---|---|---|
| White | 25.2% | 73.0% | 57.4% |
| African American | 40.9% | 10.3% | 11.9% |
| American Indian | 0.1% | 0.1% | 0.5% |
| Asian | 2.2% | 3.8% | 5.9% |
| Hawaiian | 0.1% | 0.0% | 0.2% |
| Other | 0.3% | 0.5% | 0.6% |
| Two Or More | 4.7% | 3.6% | 4.3% |
| Hispanic | 26.4% | 8.7% | 19.3% |
Gender in Harrisburg
See the full breakdown
Harrisburg is 52.6% female with 26,464 female residents.
Harrisburg is 47.4% male with 23,823 male residents.
| Gender | Harrisburg | PA | USA |
|---|---|---|---|
| Female | 52.6% | 50.7% | 50.5% |
| Male | 47.4% | 49.3% | 49.5% |
Highest level of educational attainment in Harrisburg for adults over 25
See the full breakdown
6.0% of adults in Harrisburg completed < 9th grade.
9.0% of adults in Harrisburg completed 9-12th grade.
34.0% of adults in Harrisburg completed high school / ged.
19.0% of adults in Harrisburg completed some college.
6.0% of adults in Harrisburg completed associate's degree.
16.0% of adults in Harrisburg completed bachelor's degree.
6.0% of adults in Harrisburg completed master's degree.
3.0% of adults in Harrisburg completed professional degree.
1.0% of adults in Harrisburg completed doctorate degree.
| Education | Harrisburg | PA | USA |
|---|---|---|---|
| < 9th Grade | 6.0% | 3.0% | 4.0% |
| 9-12th Grade | 9.0% | 5.0% | 6.0% |
| High School / GED | 34.0% | 33.0% | 26.0% |
| Some College | 19.0% | 15.0% | 19.0% |
| Associate's Degree | 6.0% | 9.0% | 9.0% |
| Bachelor's Degree | 16.0% | 21.0% | 22.0% |
| Master's Degree | 6.0% | 10.0% | 10.0% |
| Professional Degree | 3.0% | 2.0% | 2.0% |
| Doctorate Degree | 1.0% | 2.0% | 2.0% |
Household Income For Harrisburg, Pennsylvania
See the full breakdown
13.9% of households in Harrisburg earn Less than $10,000.
6.9% of households in Harrisburg earn $10,000 to $14,999.
9.6% of households in Harrisburg earn $15,000 to $24,999.
8.0% of households in Harrisburg earn $25,000 to $34,999.
13.4% of households in Harrisburg earn $35,000 to $49,999.
19.0% of households in Harrisburg earn $50,000 to $74,999.
12.2% of households in Harrisburg earn $75,000 to $99,999.
9.5% of households in Harrisburg earn $100,000 to $149,999.
3.6% of households in Harrisburg earn $150,000 to $199,999.
3.8% of households in Harrisburg earn $200,000 or more.
| Income | Harrisburg | PA | USA |
|---|---|---|---|
| Less than $10,000 | 13.9% | 4.9% | 5.0% |
| $10,000 to $14,999 | 6.9% | 3.5% | 3.4% |
| $15,000 to $24,999 | 9.6% | 6.7% | 6.3% |
| $25,000 to $34,999 | 8.0% | 6.9% | 6.6% |
| $35,000 to $49,999 | 13.4% | 10.5% | 10.1% |
| $50,000 to $74,999 | 19.0% | 15.9% | 15.5% |
| $75,000 to $99,999 | 12.2% | 12.8% | 12.6% |
| $100,000 to $149,999 | 9.5% | 17.7% | 17.5% |
| $150,000 to $199,999 | 3.6% | 9.3% | 9.6% |
| $200,000 or more | 3.8% | 11.8% | 13.4% |
Source: U.S. Census ACS 5-year estimates (2024)


