Lancaster SnackAbility
Overall SnackAbility
Cost of living in Lancaster summary. We use data on the cost of living to determine how expensive it is to live in Lancaster. Real estate prices drive most of the variance in cost of living around Pennsylvania. Key points include:
The cost of living in Lancaster is 92 with 100 being average.
The cost of living in Lancaster is 0.9x lower than the national average.
The median home value in Lancaster is $243,852.
The median income in Lancaster is $63,690.
Lancaster's Overall Cost Of Living
Lower Than The National Average
Cost Of Living In Lancaster Comparison Table
| Living Expense | Lancaster | Pennsylvania | National Average |
|---|---|---|---|
| Overall | 92 | 97 | 100 |
| Services | 101 | 99 | 100 |
| Groceries | 99 | 100 | 100 |
| Health | 77 | 88 | 100 |
| Housing | 95 | 102 | 100 |
| Transportation | 98 | 100 | 100 |
| Utilities | 96 | 101 | 100 |
Source: Cost of living index, normalized to US average = 100
Lancaster, PA Weather
The average high in Lancaster is 63.1° and the average low is 42.9°.
There are 76.0 days of precipitation each year.
Expect an average of 43.1 inches of precipitation each year with 19.1 inches of snow.
| Stat | Lancaster |
|---|---|
| Average Annual High | 63.1 |
| Average Annual Low | 42.9 |
| Annual Precipitation Days | 76.0 |
| Average Annual Precipitation | 43.1 |
| Average Annual Snowfall | 19.1 |
Average High
Days of Rain
Source: NOAA climate normals (30-year)
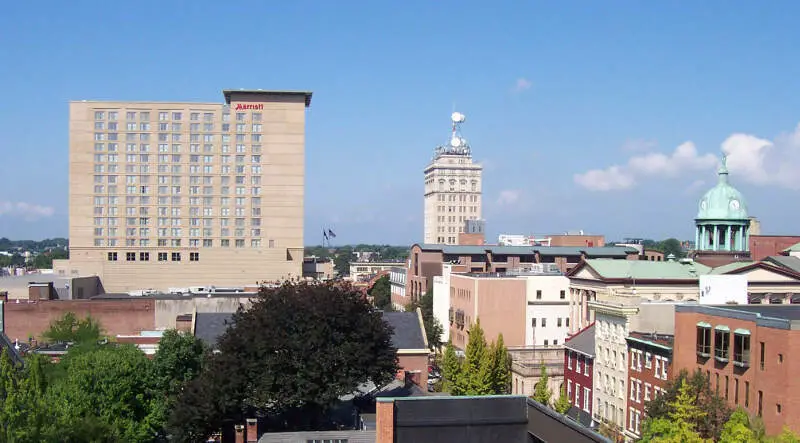
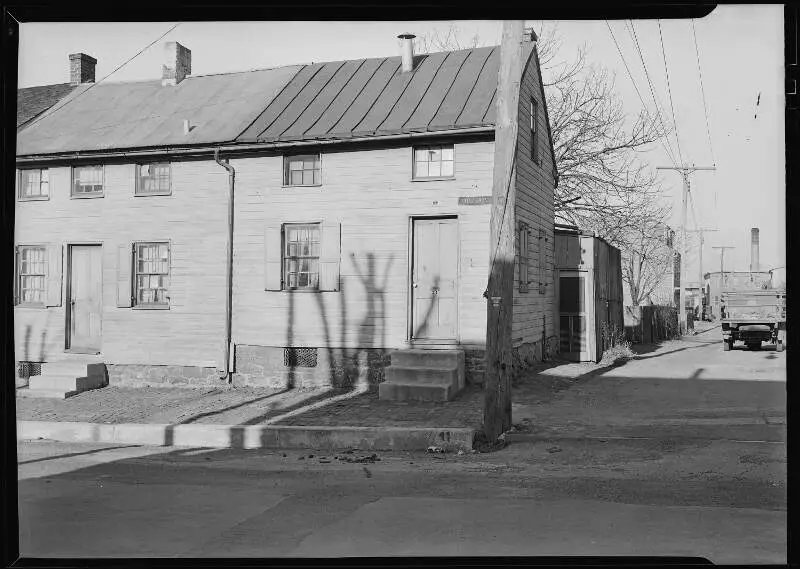
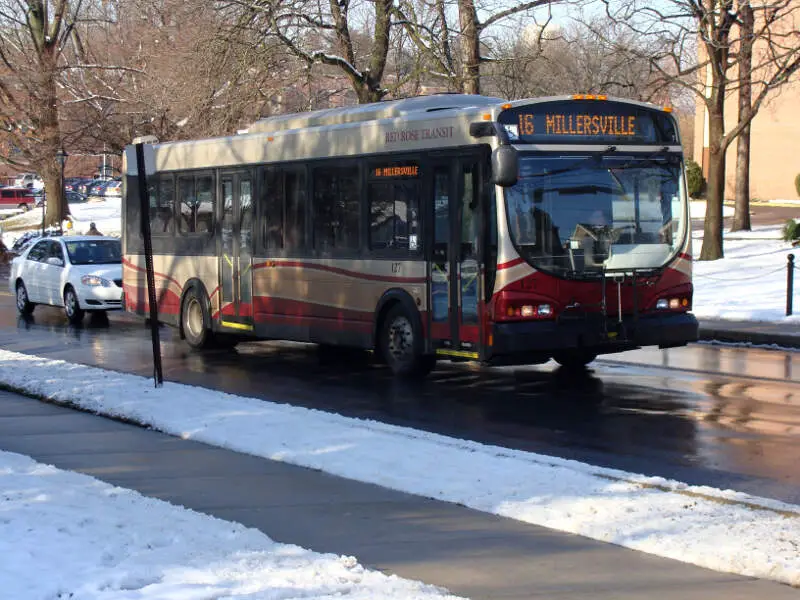
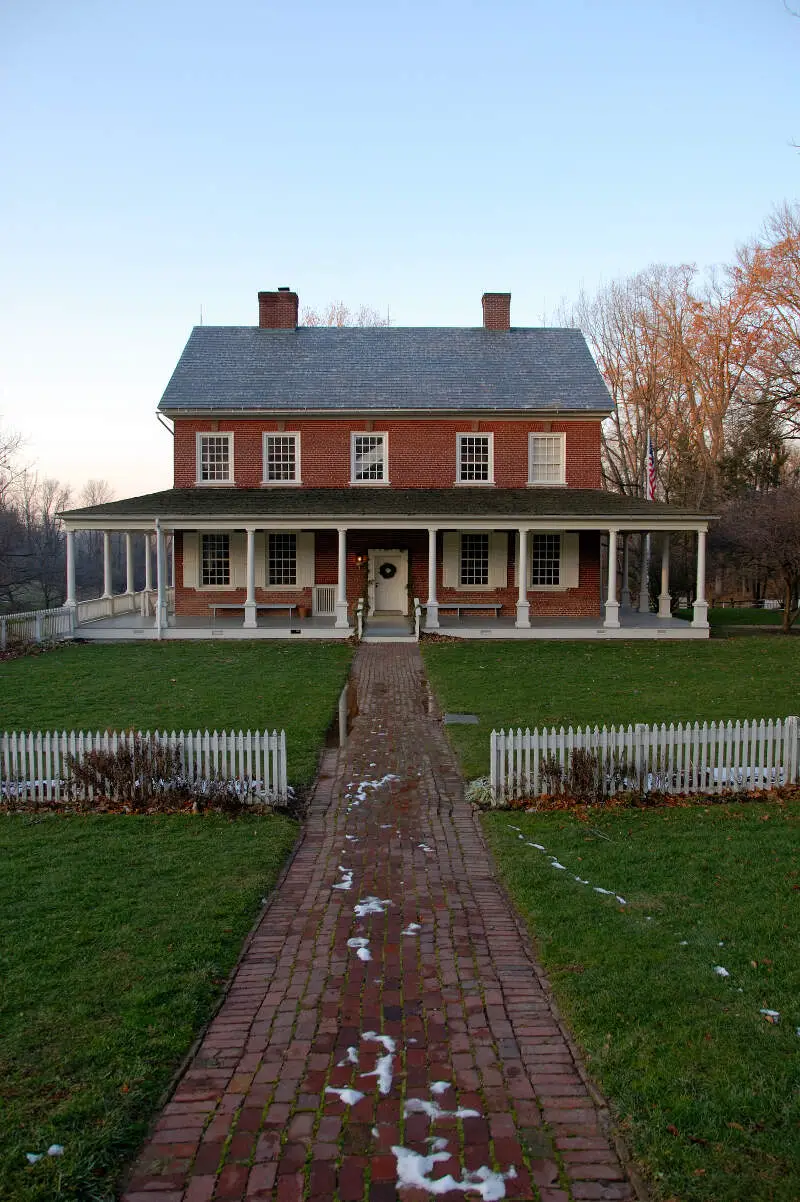
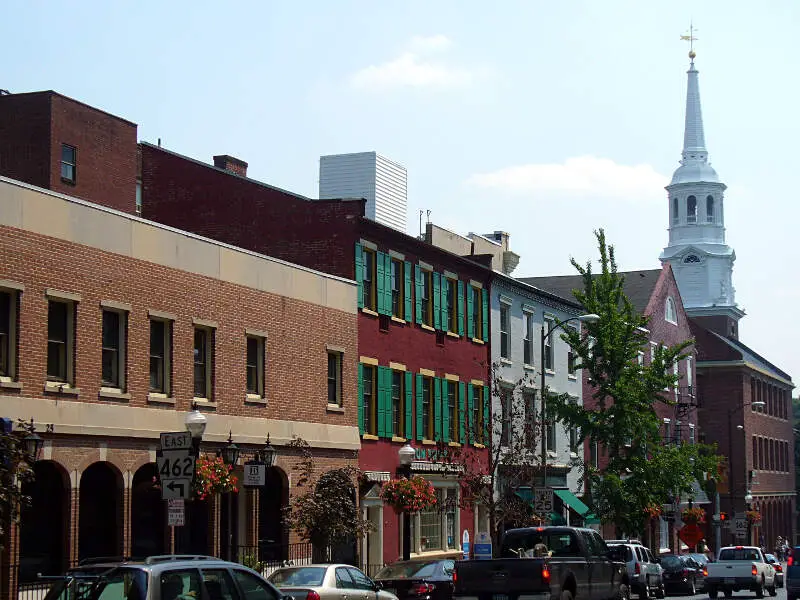
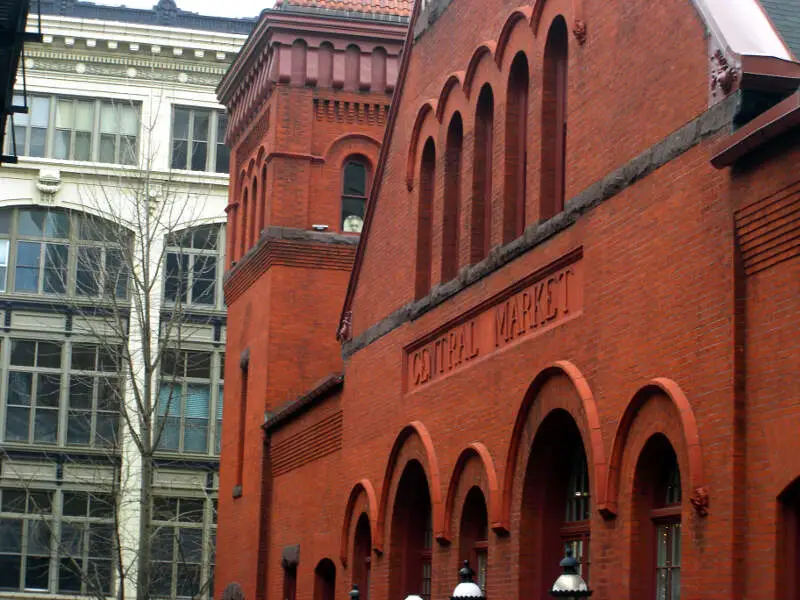
Lancaster, PA Photos
3 Reviews & Comments About Lancaster

My experience isn't too bad. There is plenty of things to do like go to the park, mall or just walk around the city. The crime has increased throughout the years, and also the population has become more crowded.
I love going to Longs Park and getting some ice cream and walking around. It's a very peaceful place.
I'm wondering if these numbers are right. Lancaster shows up on many lists due to its many positives, being safe among them.
I feel very safe here except for ONE neighborhood.
I've lived in Lancaster all my life and I will agree there are rednecks here as well as dive bars but I must say there's no place I'd rather call home. Yes times are changing but this town has its ups and downs just like anyplace else. Besides there is plenty of history in this town and many many Good people. Rednecks are everywhere they don't bother me at all. I say live and let live! I Love Lancaster Pa!!!
Rankings & Articles For Lancaster


Locations Around Lancaster
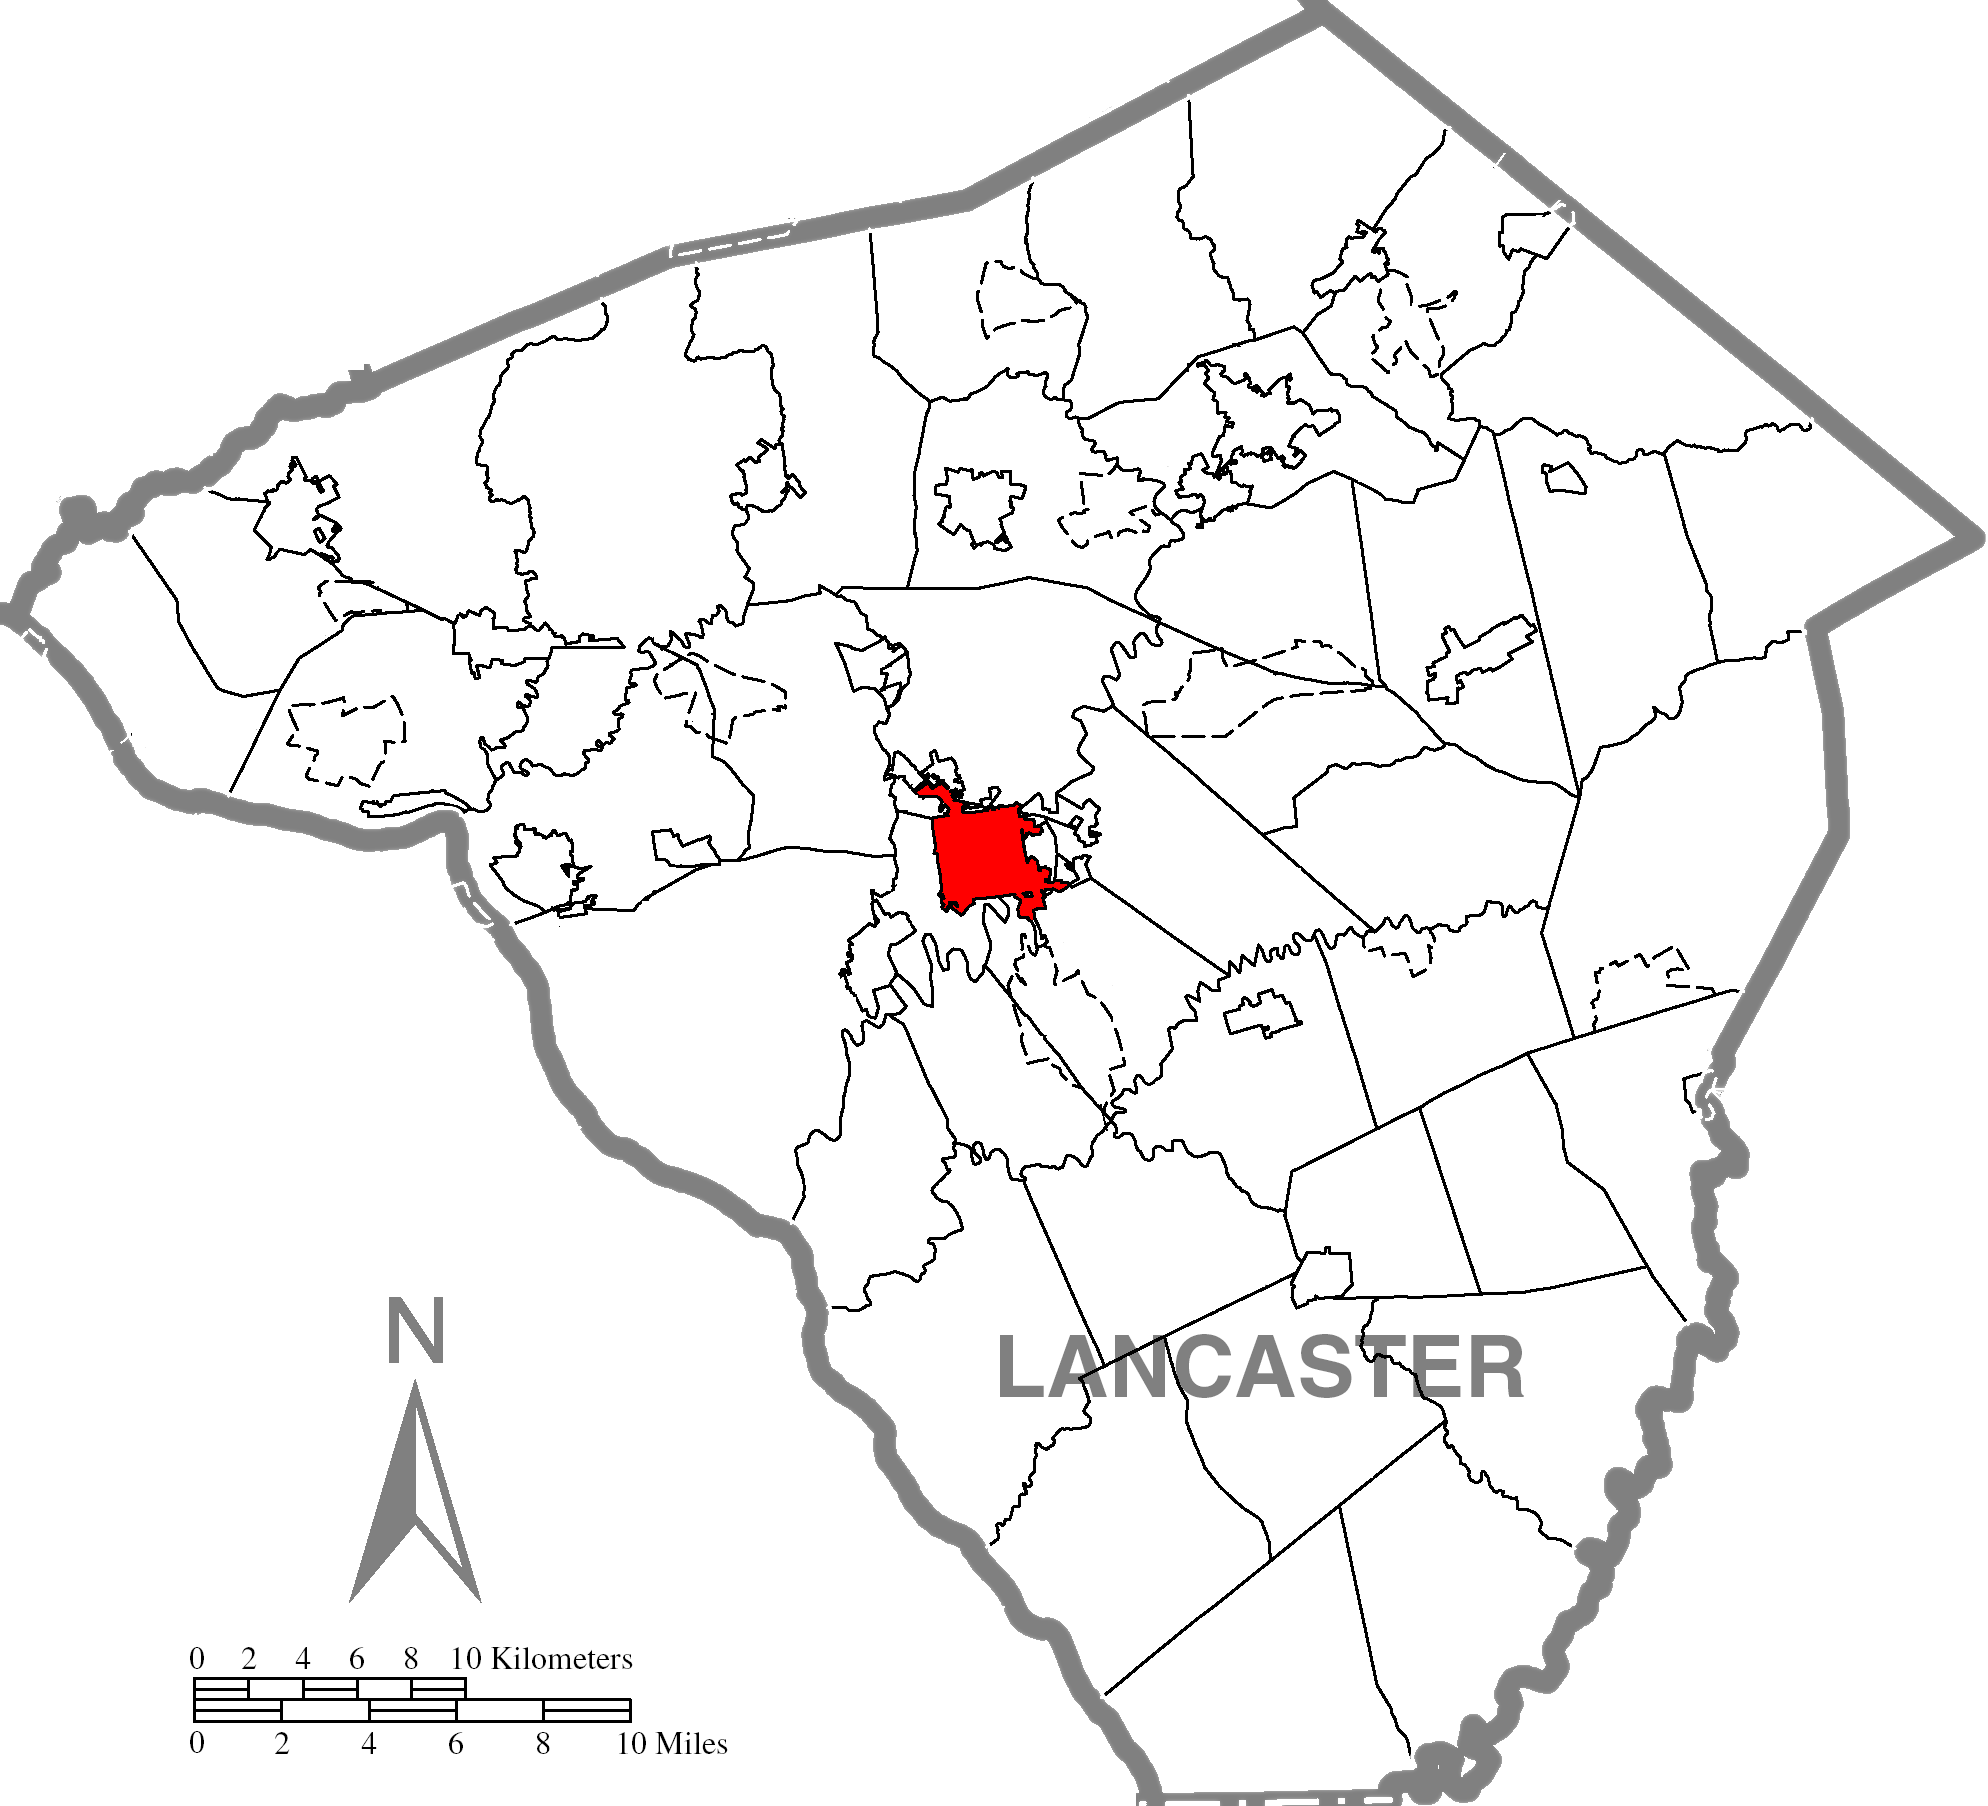
Map Of Lancaster, PA
Best Places Around Lancaster
Lititz, PA
Population 9,619
Millersville, PA
Population 8,982
Ephrata, PA
Population 13,772
New Holland, PA
Population 5,780
Willow Street, PA
Population 9,647
Leola, PA
Population 7,448
Mount Joy, PA
Population 8,344
Columbia, PA
Population 10,278
Red Lion, PA
Population 6,516
Georgetown, SC
Population 8,565
Lancaster Demographics And Statistics
Population over time in Lancaster
The current population in Lancaster is 57,719. The population has decreased 1.9% from 2010.
| Year | Population | % Change |
|---|---|---|
| 2024 | 57,719 | 0.1% |
| 2023 | 57,683 | -0.5% |
| 2022 | 57,970 | -0.1% |
| 2021 | 58,034 | -2.2% |
| 2020 | 59,321 | -0.2% |
| 2019 | 59,433 | -0.1% |
| 2018 | 59,503 | -0.1% |
| 2017 | 59,556 | 0.4% |
| 2016 | 59,341 | -0.0% |
| 2015 | 59,344 | -0.0% |
| 2014 | 59,368 | 0.1% |
| 2013 | 59,335 | 0.2% |
| 2012 | 59,205 | -0.1% |
| 2011 | 59,263 | 0.8% |
| 2010 | 58,819 | - |
Race / Ethnicity in Lancaster
See the full breakdown
Lancaster is:
39.7% White with 22,886 White residents.
12.0% African American with 6,922 African American residents.
0.0% American Indian with 15 American Indian residents.
2.9% Asian with 1,697 Asian residents.
0.0% Hawaiian with 23 Hawaiian residents.
0.7% Other with 426 Other residents.
4.0% Two Or More with 2,326 Two Or More residents.
40.6% Hispanic with 23,424 Hispanic residents.
| Race | Lancaster | PA | USA |
|---|---|---|---|
| White | 39.7% | 73.0% | 57.4% |
| African American | 12.0% | 10.3% | 11.9% |
| American Indian | 0.0% | 0.1% | 0.5% |
| Asian | 2.9% | 3.8% | 5.9% |
| Hawaiian | 0.0% | 0.0% | 0.2% |
| Other | 0.7% | 0.5% | 0.6% |
| Two Or More | 4.0% | 3.6% | 4.3% |
| Hispanic | 40.6% | 8.7% | 19.3% |
Gender in Lancaster
See the full breakdown
Lancaster is 51.7% female with 29,816 female residents.
Lancaster is 48.3% male with 27,903 male residents.
| Gender | Lancaster | PA | USA |
|---|---|---|---|
| Female | 51.7% | 50.7% | 50.5% |
| Male | 48.3% | 49.3% | 49.5% |
Highest level of educational attainment in Lancaster for adults over 25
See the full breakdown
7.0% of adults in Lancaster completed < 9th grade.
9.0% of adults in Lancaster completed 9-12th grade.
32.0% of adults in Lancaster completed high school / ged.
14.0% of adults in Lancaster completed some college.
9.0% of adults in Lancaster completed associate's degree.
19.0% of adults in Lancaster completed bachelor's degree.
8.0% of adults in Lancaster completed master's degree.
1.0% of adults in Lancaster completed professional degree.
1.0% of adults in Lancaster completed doctorate degree.
| Education | Lancaster | PA | USA |
|---|---|---|---|
| < 9th Grade | 7.0% | 3.0% | 4.0% |
| 9-12th Grade | 9.0% | 5.0% | 6.0% |
| High School / GED | 32.0% | 33.0% | 26.0% |
| Some College | 14.0% | 15.0% | 19.0% |
| Associate's Degree | 9.0% | 9.0% | 9.0% |
| Bachelor's Degree | 19.0% | 21.0% | 22.0% |
| Master's Degree | 8.0% | 10.0% | 10.0% |
| Professional Degree | 1.0% | 2.0% | 2.0% |
| Doctorate Degree | 1.0% | 2.0% | 2.0% |
Household Income For Lancaster, Pennsylvania
See the full breakdown
5.6% of households in Lancaster earn Less than $10,000.
5.8% of households in Lancaster earn $10,000 to $14,999.
8.8% of households in Lancaster earn $15,000 to $24,999.
6.9% of households in Lancaster earn $25,000 to $34,999.
13.0% of households in Lancaster earn $35,000 to $49,999.
19.0% of households in Lancaster earn $50,000 to $74,999.
13.0% of households in Lancaster earn $75,000 to $99,999.
17.4% of households in Lancaster earn $100,000 to $149,999.
5.6% of households in Lancaster earn $150,000 to $199,999.
4.9% of households in Lancaster earn $200,000 or more.
| Income | Lancaster | PA | USA |
|---|---|---|---|
| Less than $10,000 | 5.6% | 4.9% | 5.0% |
| $10,000 to $14,999 | 5.8% | 3.5% | 3.4% |
| $15,000 to $24,999 | 8.8% | 6.7% | 6.3% |
| $25,000 to $34,999 | 6.9% | 6.9% | 6.6% |
| $35,000 to $49,999 | 13.0% | 10.5% | 10.1% |
| $50,000 to $74,999 | 19.0% | 15.9% | 15.5% |
| $75,000 to $99,999 | 13.0% | 12.8% | 12.6% |
| $100,000 to $149,999 | 17.4% | 17.7% | 17.5% |
| $150,000 to $199,999 | 5.6% | 9.3% | 9.6% |
| $200,000 or more | 4.9% | 11.8% | 13.4% |
Source: U.S. Census ACS 5-year estimates (2024)


