Lebanon SnackAbility
Overall SnackAbility
Crime in Lebanon summary. We use data from the FBI to determine the crime rates in Lebanon. Key points include:
There were 335 total crimes in Lebanon in the last reporting year.
The overall crime rate per 100,000 people in Lebanon is 1,276.6 / 100k people.
The violent crime rate per 100,000 people in Lebanon is 152.4 / 100k people.
The property crime rate per 100,000 people in Lebanon is 1,124.2 / 100k people.
Overall, crime in Lebanon is -39.76% below the national average.
Total Crimes
Below National Average
Crime In Lebanon Comparison Table
| Statistic | Count Raw |
Lebanon / 100k People |
Pennsylvania / 100k People |
National / 100k People |
|---|---|---|---|---|
| Total Crimes Per 100K | 335 | 1,276.6 | 1,680.6 | 2,119.2 |
| Violent Crime | 40 | 152.4 | 245.6 | 359.0 |
| Murder | 0 | 0.0 | 5.0 | 5.0 |
| Robbery | 8 | 30.5 | 51.4 | 61.0 |
| Aggravated Assault | 27 | 102.9 | 161.4 | 256.0 |
| Property Crime | 295 | 1,124.2 | 1,435.0 | 1,760.0 |
| Burglary | 36 | 137.2 | 116.7 | 229.0 |
| Larceny | 235 | 895.5 | 1,129.8 | 1,272.0 |
| Car Theft | 24 | 91.5 | 188.5 | 259.0 |
Source: FBI Uniform Crime Reporting (2024)
Cost of living in Lebanon summary. We use data on the cost of living to determine how expensive it is to live in Lebanon. Real estate prices drive most of the variance in cost of living around Pennsylvania. Key points include:
The cost of living in Lebanon is 89 with 100 being average.
The cost of living in Lebanon is 0.9x lower than the national average.
The median home value in Lebanon is $285,427.
The median income in Lebanon is $48,456.
Lebanon's Overall Cost Of Living
Lower Than The National Average
Cost Of Living In Lebanon Comparison Table
| Living Expense | Lebanon | Pennsylvania | National Average |
|---|---|---|---|
| Overall | 89 | 97 | 100 |
| Services | 102 | 99 | 100 |
| Groceries | 99 | 100 | 100 |
| Health | 62 | 88 | 100 |
| Housing | 97 | 102 | 100 |
| Transportation | 101 | 100 | 100 |
| Utilities | 96 | 101 | 100 |
Source: Cost of living index, normalized to US average = 100
Lebanon, PA Weather
The average high in Lebanon is 62.0° and the average low is 42.1°.
There are 75.6 days of precipitation each year.
Expect an average of 44.4 inches of precipitation each year with 21.3 inches of snow.
| Stat | Lebanon |
|---|---|
| Average Annual High | 62.0 |
| Average Annual Low | 42.1 |
| Annual Precipitation Days | 75.6 |
| Average Annual Precipitation | 44.4 |
| Average Annual Snowfall | 21.3 |
Average High
Days of Rain
Source: NOAA climate normals (30-year)
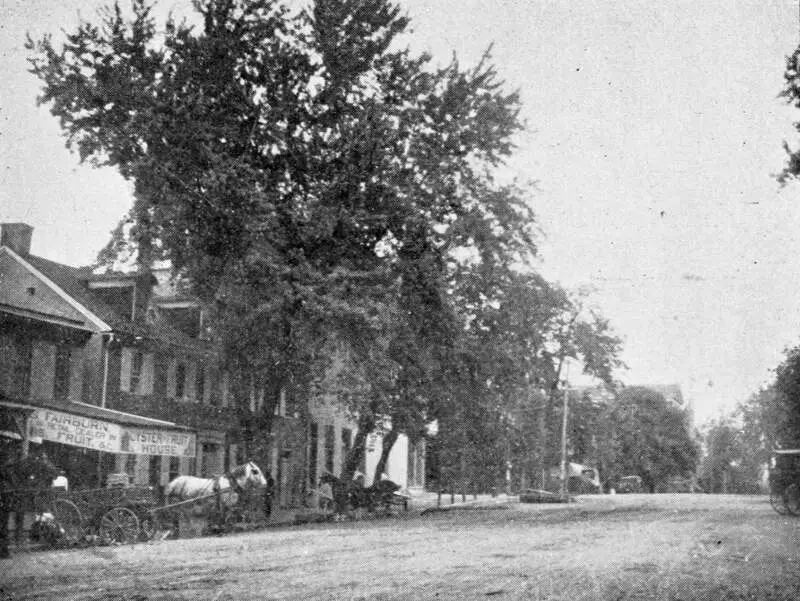
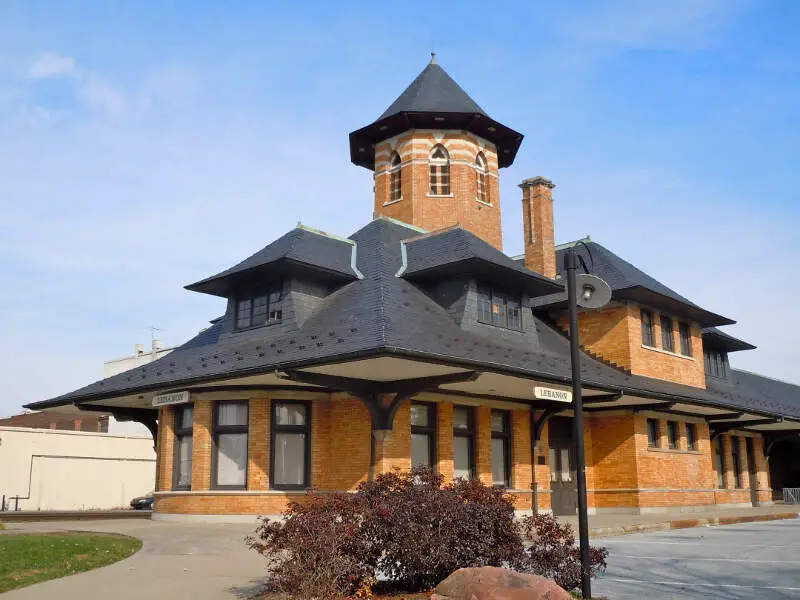
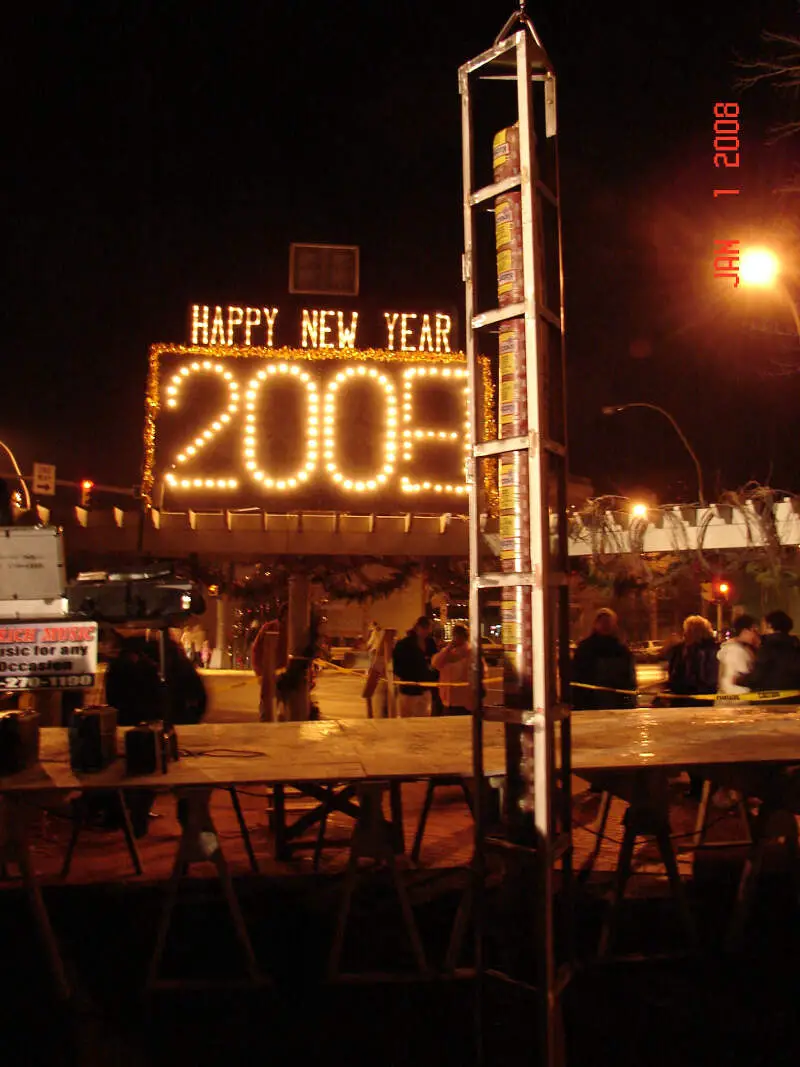
Lebanon, PA Photos
1 Reviews & Comments About Lebanon

I live in Lebanon,PA and it is a s**t hole now.
Rankings & Articles For Lebanon


Locations Around Lebanon
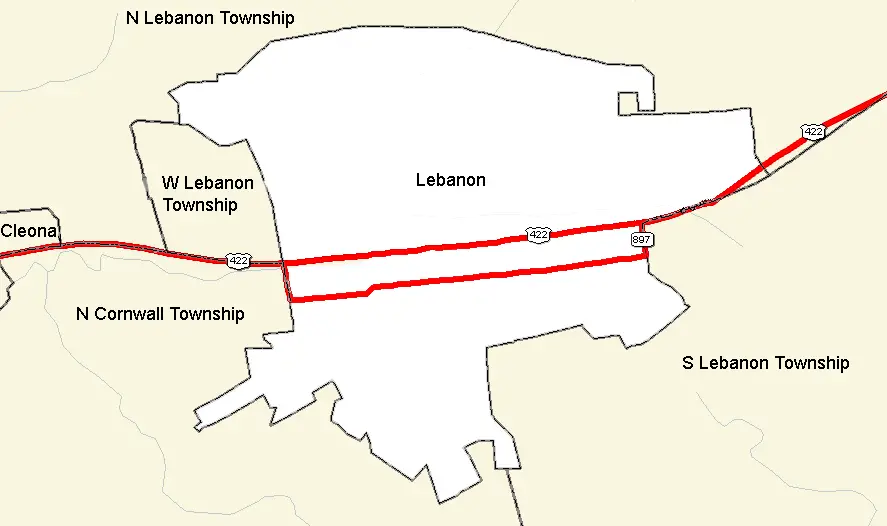
Map Of Lebanon, PA
Best Places Around Lebanon
Fredericksburg, TX
Population 11,419
Linglestown, PA
Population 6,957
Lititz, PA
Population 9,619
Middletown, PA
Population 7,628
Middletown, PA
Population 7,628
Palmyra, PA
Population 7,755
Ephrata, PA
Population 13,772
Mount Joy, PA
Population 8,344
Hershey, PA
Population 14,242
Lebanon Demographics And Statistics
Population over time in Lebanon
The current population in Lebanon is 26,536. The population has increased 4.4% from 2010.
| Year | Population | % Change |
|---|---|---|
| 2024 | 26,536 | -0.2% |
| 2023 | 26,600 | -0.3% |
| 2022 | 26,679 | 0.3% |
| 2021 | 26,611 | 3.2% |
| 2020 | 25,779 | -0.1% |
| 2019 | 25,793 | 0.2% |
| 2018 | 25,739 | 0.1% |
| 2017 | 25,703 | 0.2% |
| 2016 | 25,654 | 0.4% |
| 2015 | 25,555 | 0.0% |
| 2014 | 25,553 | 0.1% |
| 2013 | 25,520 | 0.1% |
| 2012 | 25,495 | 0.0% |
| 2011 | 25,495 | 0.3% |
| 2010 | 25,412 | - |
Race / Ethnicity in Lebanon
See the full breakdown
Lebanon is:
47.3% White with 12,559 White residents.
2.6% African American with 698 African American residents.
0.0% American Indian with 12 American Indian residents.
1.2% Asian with 316 Asian residents.
0.0% Hawaiian with 0 Hawaiian residents.
0.8% Other with 203 Other residents.
2.7% Two Or More with 711 Two Or More residents.
45.4% Hispanic with 12,037 Hispanic residents.
| Race | Lebanon | PA | USA |
|---|---|---|---|
| White | 47.3% | 73.0% | 57.4% |
| African American | 2.6% | 10.3% | 11.9% |
| American Indian | 0.0% | 0.1% | 0.5% |
| Asian | 1.2% | 3.8% | 5.9% |
| Hawaiian | 0.0% | 0.0% | 0.2% |
| Other | 0.8% | 0.5% | 0.6% |
| Two Or More | 2.7% | 3.6% | 4.3% |
| Hispanic | 45.4% | 8.7% | 19.3% |
Gender in Lebanon
See the full breakdown
Lebanon is 51.4% female with 13,651 female residents.
Lebanon is 48.6% male with 12,885 male residents.
| Gender | Lebanon | PA | USA |
|---|---|---|---|
| Female | 51.4% | 50.7% | 50.5% |
| Male | 48.6% | 49.3% | 49.5% |
Highest level of educational attainment in Lebanon for adults over 25
See the full breakdown
6.0% of adults in Lebanon completed < 9th grade.
11.0% of adults in Lebanon completed 9-12th grade.
44.0% of adults in Lebanon completed high school / ged.
16.0% of adults in Lebanon completed some college.
7.0% of adults in Lebanon completed associate's degree.
10.0% of adults in Lebanon completed bachelor's degree.
4.0% of adults in Lebanon completed master's degree.
1.0% of adults in Lebanon completed professional degree.
1.0% of adults in Lebanon completed doctorate degree.
| Education | Lebanon | PA | USA |
|---|---|---|---|
| < 9th Grade | 6.0% | 3.0% | 4.0% |
| 9-12th Grade | 11.0% | 5.0% | 6.0% |
| High School / GED | 44.0% | 33.0% | 26.0% |
| Some College | 16.0% | 15.0% | 19.0% |
| Associate's Degree | 7.0% | 9.0% | 9.0% |
| Bachelor's Degree | 10.0% | 21.0% | 22.0% |
| Master's Degree | 4.0% | 10.0% | 10.0% |
| Professional Degree | 1.0% | 2.0% | 2.0% |
| Doctorate Degree | 1.0% | 2.0% | 2.0% |
Household Income For Lebanon, Pennsylvania
See the full breakdown
7.6% of households in Lebanon earn Less than $10,000.
4.1% of households in Lebanon earn $10,000 to $14,999.
12.8% of households in Lebanon earn $15,000 to $24,999.
12.7% of households in Lebanon earn $25,000 to $34,999.
14.9% of households in Lebanon earn $35,000 to $49,999.
17.3% of households in Lebanon earn $50,000 to $74,999.
11.9% of households in Lebanon earn $75,000 to $99,999.
11.6% of households in Lebanon earn $100,000 to $149,999.
4.5% of households in Lebanon earn $150,000 to $199,999.
2.6% of households in Lebanon earn $200,000 or more.
| Income | Lebanon | PA | USA |
|---|---|---|---|
| Less than $10,000 | 7.6% | 4.9% | 5.0% |
| $10,000 to $14,999 | 4.1% | 3.5% | 3.4% |
| $15,000 to $24,999 | 12.8% | 6.7% | 6.3% |
| $25,000 to $34,999 | 12.7% | 6.9% | 6.6% |
| $35,000 to $49,999 | 14.9% | 10.5% | 10.1% |
| $50,000 to $74,999 | 17.3% | 15.9% | 15.5% |
| $75,000 to $99,999 | 11.9% | 12.8% | 12.6% |
| $100,000 to $149,999 | 11.6% | 17.7% | 17.5% |
| $150,000 to $199,999 | 4.5% | 9.3% | 9.6% |
| $200,000 or more | 2.6% | 11.8% | 13.4% |
Source: U.S. Census ACS 5-year estimates (2024)


