Manheim SnackAbility
Overall SnackAbility
Crime in Manheim summary. We use data from the FBI to determine the crime rates in Manheim. Key points include:
There were 71 total crimes in Manheim in the last reporting year.
The overall crime rate per 100,000 people in Manheim is 1,425.7 / 100k people.
The violent crime rate per 100,000 people in Manheim is 281.1 / 100k people.
The property crime rate per 100,000 people in Manheim is 1,144.6 / 100k people.
Overall, crime in Manheim is -32.73% below the national average.
Total Crimes
Below National Average
Crime In Manheim Comparison Table
| Statistic | Count Raw |
Manheim / 100k People |
Pennsylvania / 100k People |
National / 100k People |
|---|---|---|---|---|
| Total Crimes Per 100K | 71 | 1,425.7 | 1,680.6 | 2,119.2 |
| Violent Crime | 14 | 281.1 | 245.6 | 359.0 |
| Murder | 0 | 0.0 | 5.0 | 5.0 |
| Robbery | 2 | 40.2 | 51.4 | 61.0 |
| Aggravated Assault | 11 | 220.9 | 161.4 | 256.0 |
| Property Crime | 57 | 1,144.6 | 1,435.0 | 1,760.0 |
| Burglary | 11 | 220.9 | 116.7 | 229.0 |
| Larceny | 35 | 702.8 | 1,129.8 | 1,272.0 |
| Car Theft | 11 | 220.9 | 188.5 | 259.0 |
Source: FBI Uniform Crime Reporting (2024)
Manheim, PA Weather
The average high in Manheim is 62.8° and the average low is 42.9°.
There are 76.7 days of precipitation each year.
Expect an average of 43.7 inches of precipitation each year with 23.2 inches of snow.
| Stat | Manheim |
|---|---|
| Average Annual High | 62.8 |
| Average Annual Low | 42.9 |
| Annual Precipitation Days | 76.7 |
| Average Annual Precipitation | 43.7 |
| Average Annual Snowfall | 23.2 |
Average High
Days of Rain
Source: NOAA climate normals (30-year)
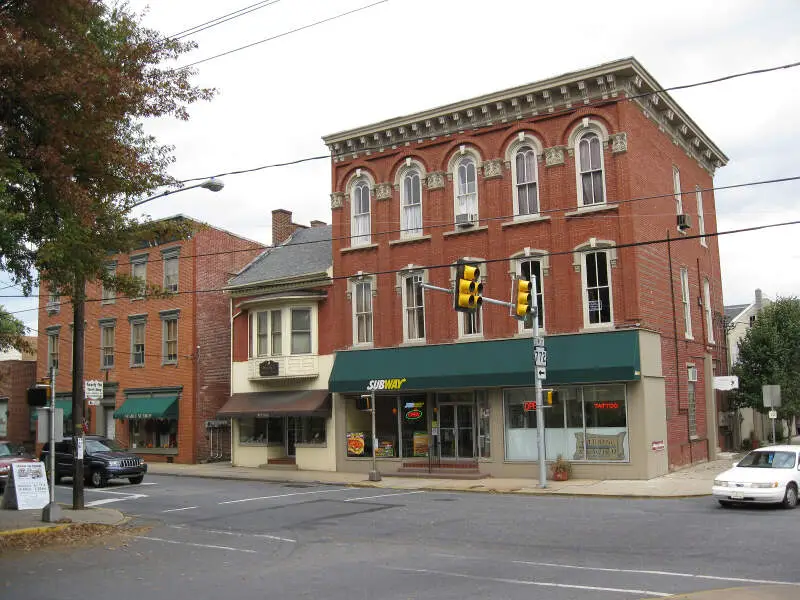
Manheim, PA Photos
Rankings & Articles For Manheim


Locations Around Manheim
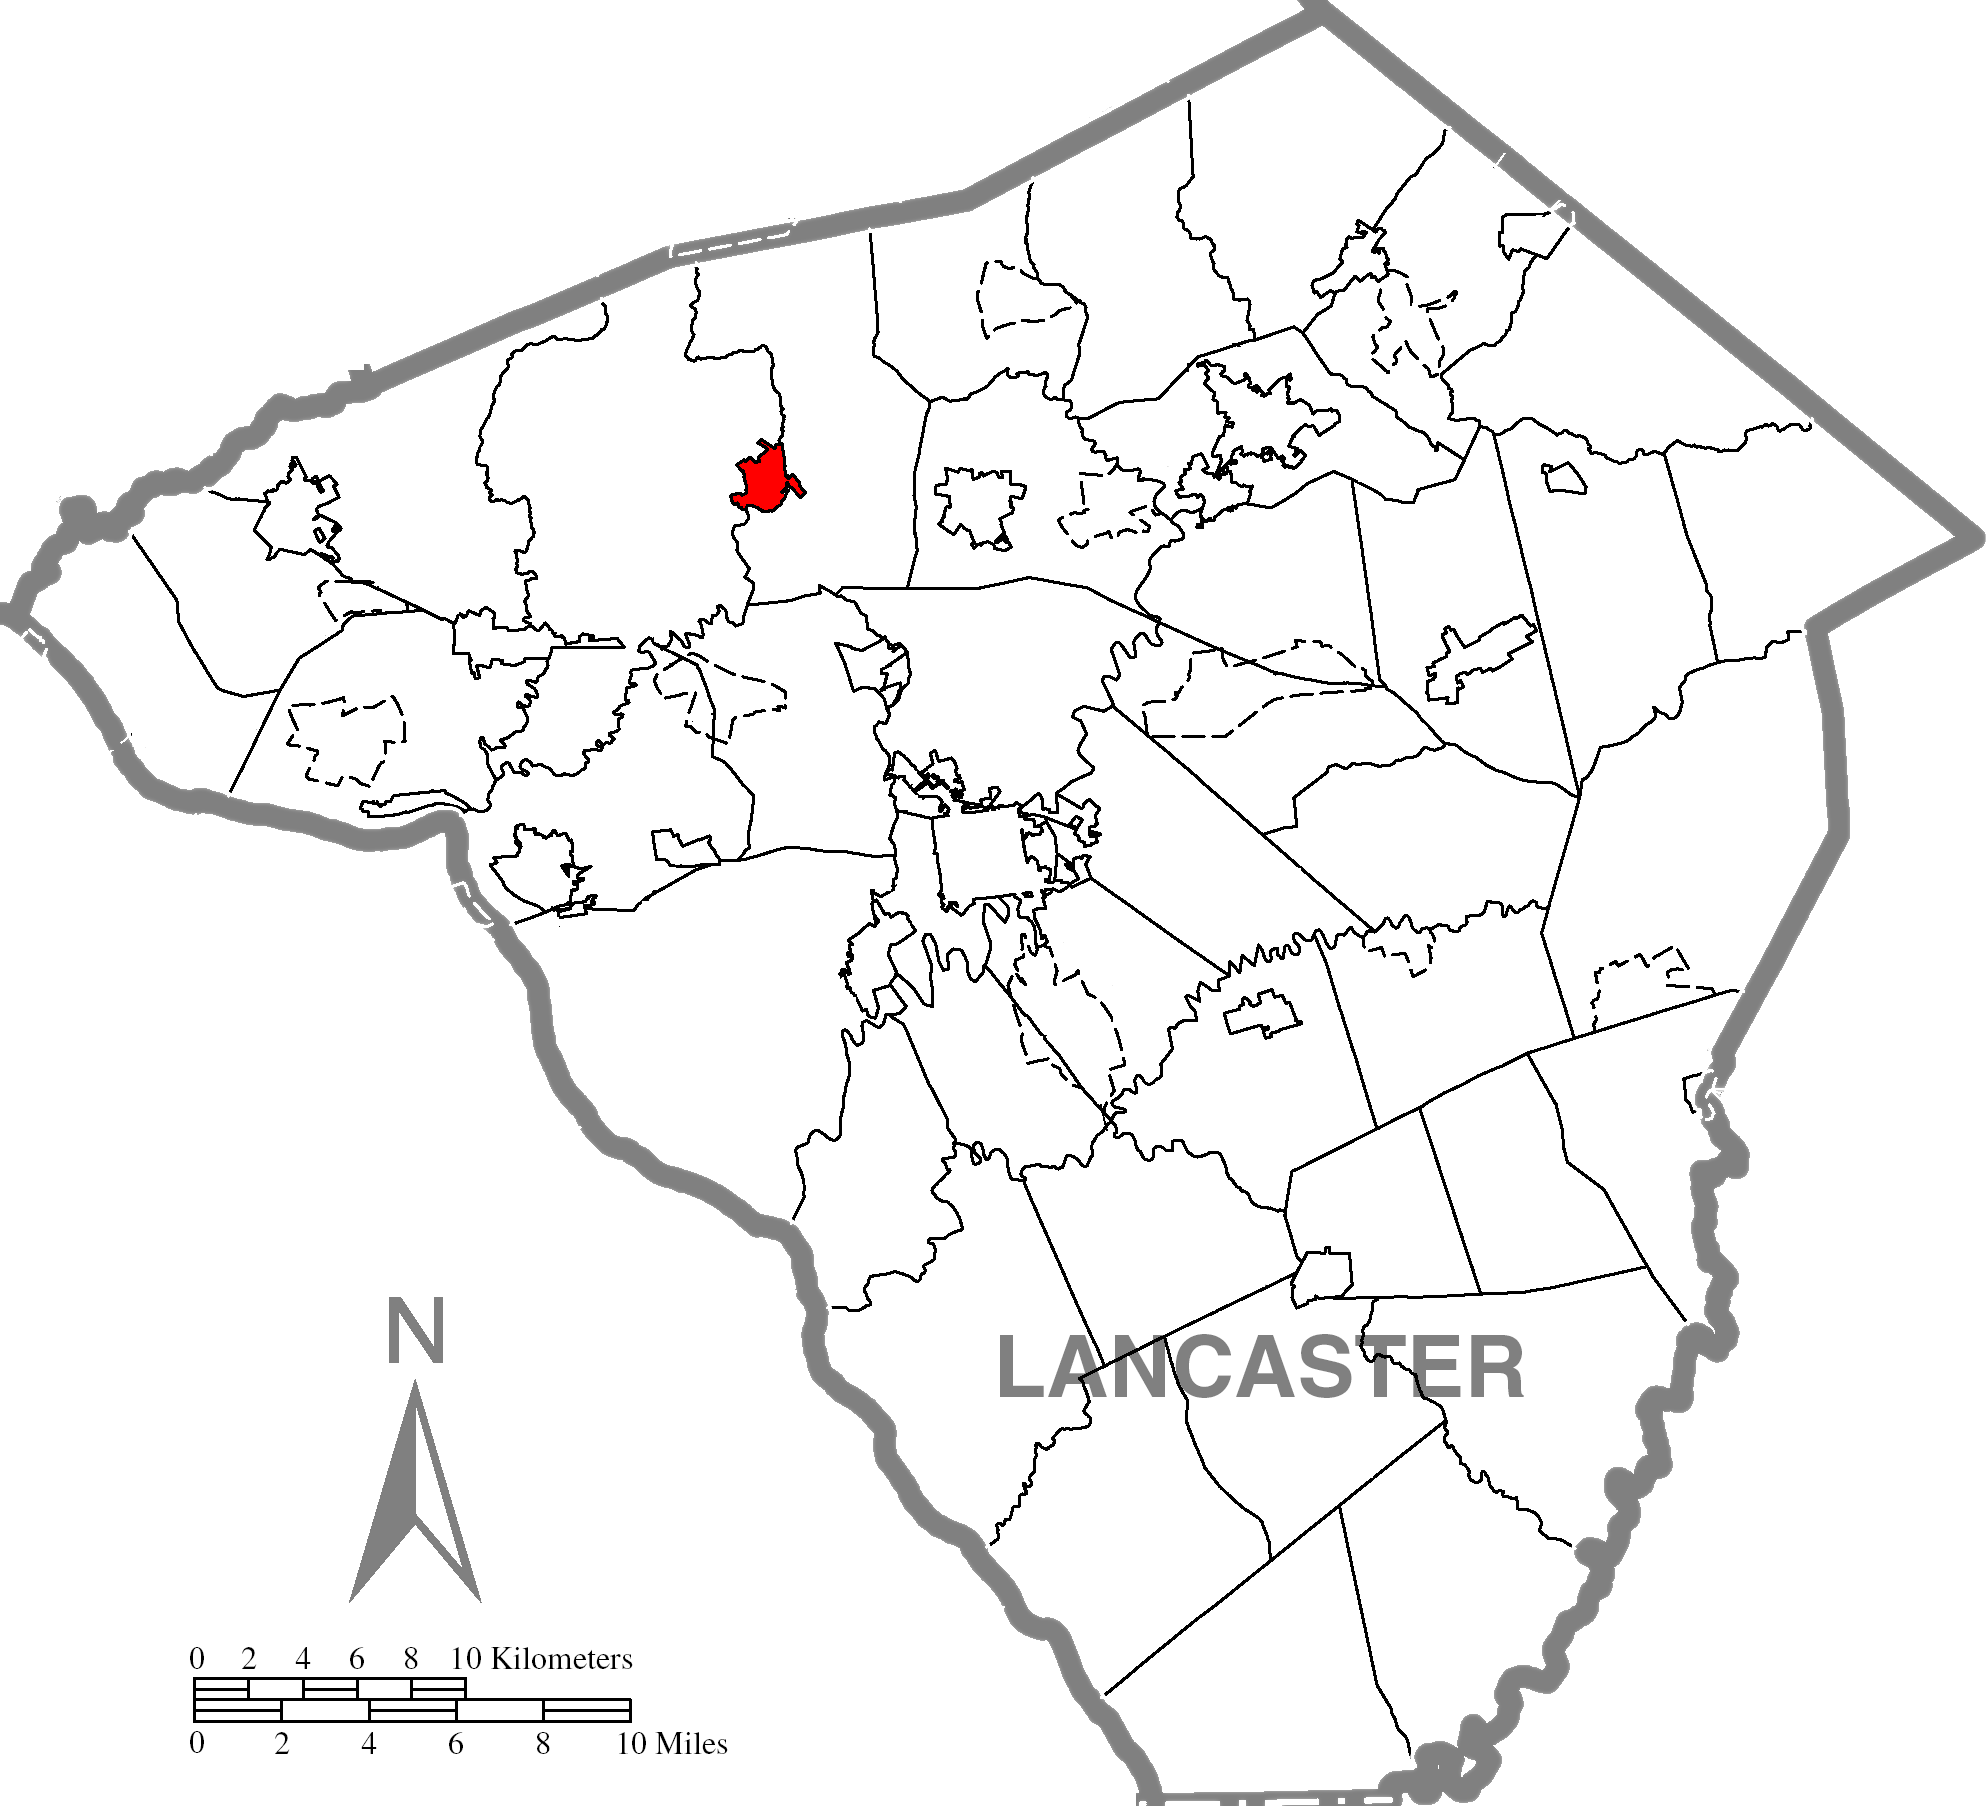
Map Of Manheim, PA
Best Places Around Manheim
Fredericksburg, TX
Population 11,419
Lititz, PA
Population 9,619
Millersville, PA
Population 8,982
Middletown, PA
Population 7,628
Middletown, PA
Population 7,628
East York, PA
Population 9,388
Palmyra, PA
Population 7,755
Ephrata, PA
Population 13,772
New Holland, PA
Population 5,780
Willow Street, PA
Population 9,647
Manheim Demographics And Statistics
Population over time in Manheim
The current population in Manheim is 5,027. The population has increased 3.4% from 2010.
| Year | Population | % Change |
|---|---|---|
| 2024 | 5,027 | -0.0% |
| 2023 | 5,028 | 0.0% |
| 2022 | 5,028 | -0.2% |
| 2021 | 5,036 | 3.8% |
| 2020 | 4,852 | -0.3% |
| 2019 | 4,867 | -0.2% |
| 2018 | 4,878 | -0.1% |
| 2017 | 4,881 | 0.3% |
| 2016 | 4,867 | 0.1% |
| 2015 | 4,864 | 0.0% |
| 2014 | 4,864 | 0.1% |
| 2013 | 4,860 | -0.1% |
| 2012 | 4,867 | -0.3% |
| 2011 | 4,881 | 0.4% |
| 2010 | 4,863 | - |
Race / Ethnicity in Manheim
See the full breakdown
Manheim is:
86.9% White with 4,366 White residents.
2.8% African American with 142 African American residents.
0.0% American Indian with 0 American Indian residents.
0.5% Asian with 25 Asian residents.
0.0% Hawaiian with 0 Hawaiian residents.
0.0% Other with 0 Other residents.
4.8% Two Or More with 239 Two Or More residents.
5.1% Hispanic with 255 Hispanic residents.
| Race | Manheim | PA | USA |
|---|---|---|---|
| White | 86.9% | 73.0% | 57.4% |
| African American | 2.8% | 10.3% | 11.9% |
| American Indian | 0.0% | 0.1% | 0.5% |
| Asian | 0.5% | 3.8% | 5.9% |
| Hawaiian | 0.0% | 0.0% | 0.2% |
| Other | 0.0% | 0.5% | 0.6% |
| Two Or More | 4.8% | 3.6% | 4.3% |
| Hispanic | 5.1% | 8.7% | 19.3% |
Gender in Manheim
See the full breakdown
Manheim is 49.3% female with 2,477 female residents.
Manheim is 50.7% male with 2,550 male residents.
| Gender | Manheim | PA | USA |
|---|---|---|---|
| Female | 49.3% | 50.7% | 50.5% |
| Male | 50.7% | 49.3% | 49.5% |
Highest level of educational attainment in Manheim for adults over 25
See the full breakdown
2.0% of adults in Manheim completed < 9th grade.
5.0% of adults in Manheim completed 9-12th grade.
35.0% of adults in Manheim completed high school / ged.
18.0% of adults in Manheim completed some college.
12.0% of adults in Manheim completed associate's degree.
20.0% of adults in Manheim completed bachelor's degree.
6.0% of adults in Manheim completed master's degree.
1.0% of adults in Manheim completed professional degree.
1.0% of adults in Manheim completed doctorate degree.
| Education | Manheim | PA | USA |
|---|---|---|---|
| < 9th Grade | 2.0% | 3.0% | 4.0% |
| 9-12th Grade | 5.0% | 5.0% | 6.0% |
| High School / GED | 35.0% | 33.0% | 26.0% |
| Some College | 18.0% | 15.0% | 19.0% |
| Associate's Degree | 12.0% | 9.0% | 9.0% |
| Bachelor's Degree | 20.0% | 21.0% | 22.0% |
| Master's Degree | 6.0% | 10.0% | 10.0% |
| Professional Degree | 1.0% | 2.0% | 2.0% |
| Doctorate Degree | 1.0% | 2.0% | 2.0% |
Household Income For Manheim, Pennsylvania
See the full breakdown
3.9% of households in Manheim earn Less than $10,000.
3.9% of households in Manheim earn $10,000 to $14,999.
8.7% of households in Manheim earn $15,000 to $24,999.
5.0% of households in Manheim earn $25,000 to $34,999.
7.5% of households in Manheim earn $35,000 to $49,999.
13.9% of households in Manheim earn $50,000 to $74,999.
28.0% of households in Manheim earn $75,000 to $99,999.
15.8% of households in Manheim earn $100,000 to $149,999.
4.7% of households in Manheim earn $150,000 to $199,999.
8.6% of households in Manheim earn $200,000 or more.
| Income | Manheim | PA | USA |
|---|---|---|---|
| Less than $10,000 | 3.9% | 4.9% | 5.0% |
| $10,000 to $14,999 | 3.9% | 3.5% | 3.4% |
| $15,000 to $24,999 | 8.7% | 6.7% | 6.3% |
| $25,000 to $34,999 | 5.0% | 6.9% | 6.6% |
| $35,000 to $49,999 | 7.5% | 10.5% | 10.1% |
| $50,000 to $74,999 | 13.9% | 15.9% | 15.5% |
| $75,000 to $99,999 | 28.0% | 12.8% | 12.6% |
| $100,000 to $149,999 | 15.8% | 17.7% | 17.5% |
| $150,000 to $199,999 | 4.7% | 9.3% | 9.6% |
| $200,000 or more | 8.6% | 11.8% | 13.4% |
Source: U.S. Census ACS 5-year estimates (2024)


