Media SnackAbility
Overall SnackAbility
Cost of living in Media summary. We use data on the cost of living to determine how expensive it is to live in Media. Real estate prices drive most of the variance in cost of living around Pennsylvania. Key points include:
The cost of living in Media is 122 with 100 being average.
The cost of living in Media is 1.2x higher than the national average.
The median home value in Media is $632,297.
The median income in Media is $89,092.
Media's Overall Cost Of Living
Higher Than The National Average
Cost Of Living In Media Comparison Table
| Living Expense | Media | Pennsylvania | National Average |
|---|---|---|---|
| Overall | 122 | 97 | 100 |
| Services | 101 | 99 | 100 |
| Groceries | 96 | 100 | 100 |
| Health | 170 | 88 | 100 |
| Housing | 98 | 102 | 100 |
| Transportation | 99 | 100 | 100 |
| Utilities | 104 | 101 | 100 |
Source: Cost of living index, normalized to US average = 100
Media, PA Weather
The average high in Media is 64.1° and the average low is 46.3°.
There are 73.6 days of precipitation each year.
Expect an average of 45.1 inches of precipitation each year with 15.1 inches of snow.
| Stat | Media |
|---|---|
| Average Annual High | 64.1 |
| Average Annual Low | 46.3 |
| Annual Precipitation Days | 73.6 |
| Average Annual Precipitation | 45.1 |
| Average Annual Snowfall | 15.1 |
Average High
Days of Rain
Source: NOAA climate normals (30-year)
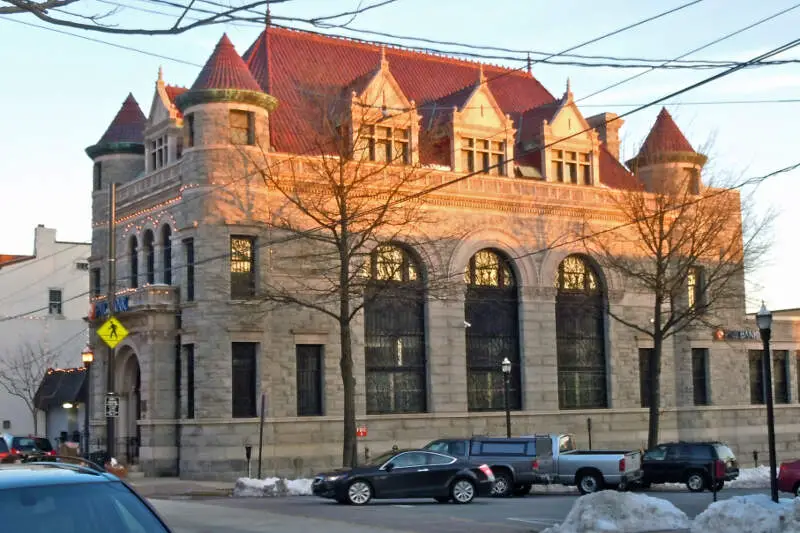
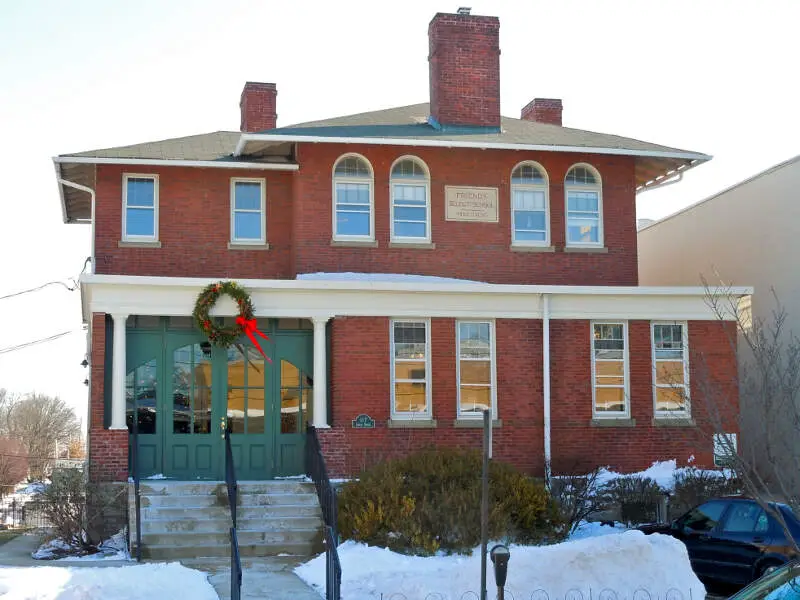
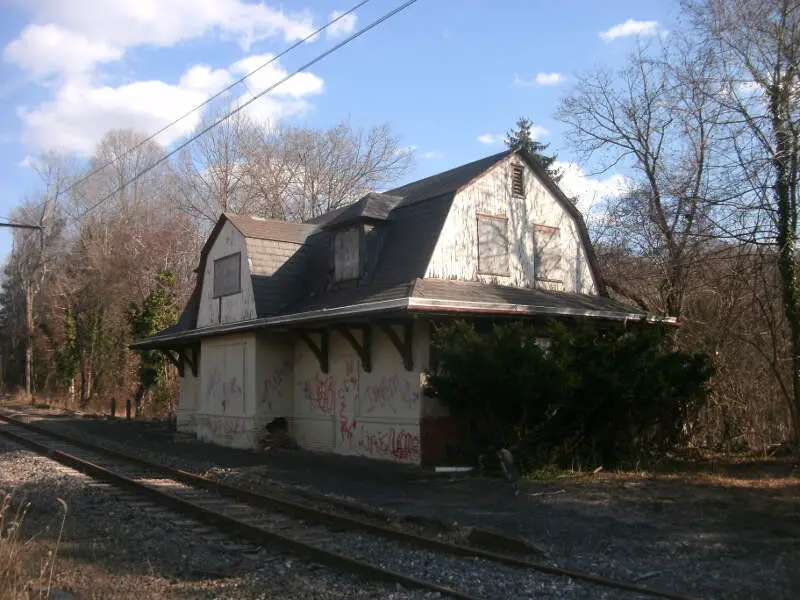
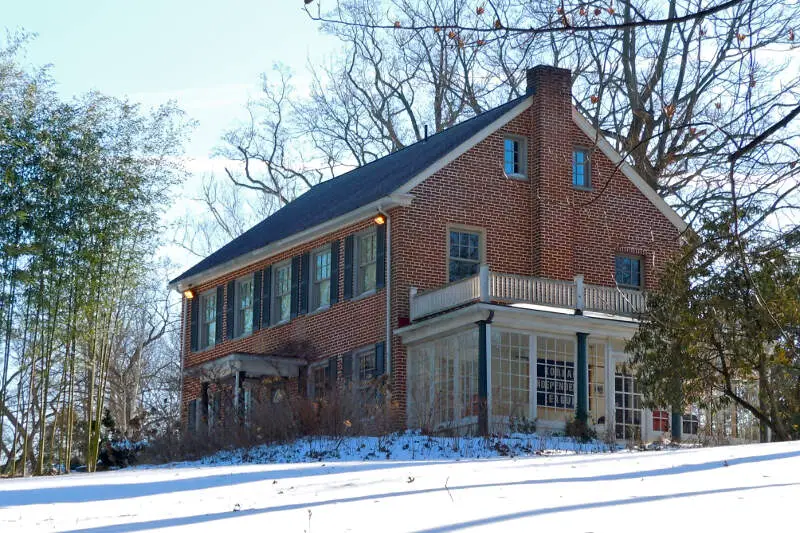
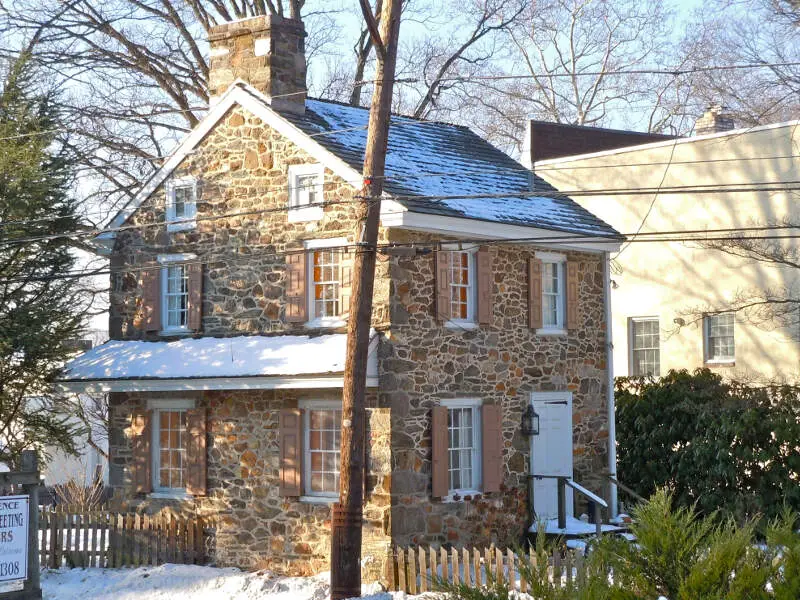
Media, PA Photos


Rankings & Articles For Media


Locations Around Media
Map Of Media, PA
Best Places Around Media
Penn Wynne, PA
Population 6,070
Oreland, PA
Population 5,953
Glenside, PA
Population 7,659
Wyndmoor, PA
Population 5,633
Ardmore, PA
Population 13,909
Trooper, PA
Population 4,907
Collegeville, PA
Population 5,247
Blue Bell, PA
Population 6,424
Conshohocken, PA
Population 9,282
Paoli, PA
Population 6,362
Media Demographics And Statistics
Population over time in Media
The current population in Media is 5,870. The population has increased 9.8% from 2010.
| Year | Population | % Change |
|---|---|---|
| 2024 | 5,870 | 0.0% |
| 2023 | 5,868 | 0.1% |
| 2022 | 5,860 | 0.5% |
| 2021 | 5,832 | 3.1% |
| 2020 | 5,658 | 3.1% |
| 2019 | 5,487 | 1.2% |
| 2018 | 5,423 | 1.4% |
| 2017 | 5,346 | 0.0% |
| 2016 | 5,345 | 0.2% |
| 2015 | 5,336 | -0.1% |
| 2014 | 5,341 | 0.2% |
| 2013 | 5,331 | -0.1% |
| 2012 | 5,334 | -0.3% |
| 2011 | 5,350 | 0.0% |
| 2010 | 5,348 | - |
Race / Ethnicity in Media
See the full breakdown
Media is:
81.6% White with 4,791 White residents.
3.7% African American with 215 African American residents.
0.0% American Indian with 0 American Indian residents.
4.9% Asian with 290 Asian residents.
2.4% Hawaiian with 138 Hawaiian residents.
0.0% Other with 0 Other residents.
2.5% Two Or More with 145 Two Or More residents.
5.0% Hispanic with 291 Hispanic residents.
| Race | Media | PA | USA |
|---|---|---|---|
| White | 81.6% | 73.0% | 57.4% |
| African American | 3.7% | 10.3% | 11.9% |
| American Indian | 0.0% | 0.1% | 0.5% |
| Asian | 4.9% | 3.8% | 5.9% |
| Hawaiian | 2.4% | 0.0% | 0.2% |
| Other | 0.0% | 0.5% | 0.6% |
| Two Or More | 2.5% | 3.6% | 4.3% |
| Hispanic | 5.0% | 8.7% | 19.3% |
Gender in Media
See the full breakdown
Media is 54.3% female with 3,188 female residents.
Media is 45.7% male with 2,682 male residents.
| Gender | Media | PA | USA |
|---|---|---|---|
| Female | 54.3% | 50.7% | 50.5% |
| Male | 45.7% | 49.3% | 49.5% |
Highest level of educational attainment in Media for adults over 25
See the full breakdown
0.0% of adults in Media completed < 9th grade.
3.0% of adults in Media completed 9-12th grade.
16.0% of adults in Media completed high school / ged.
12.0% of adults in Media completed some college.
6.0% of adults in Media completed associate's degree.
29.0% of adults in Media completed bachelor's degree.
23.0% of adults in Media completed master's degree.
5.0% of adults in Media completed professional degree.
6.0% of adults in Media completed doctorate degree.
| Education | Media | PA | USA |
|---|---|---|---|
| < 9th Grade | 0.0% | 3.0% | 4.0% |
| 9-12th Grade | 3.0% | 5.0% | 6.0% |
| High School / GED | 16.0% | 33.0% | 26.0% |
| Some College | 12.0% | 15.0% | 19.0% |
| Associate's Degree | 6.0% | 9.0% | 9.0% |
| Bachelor's Degree | 29.0% | 21.0% | 22.0% |
| Master's Degree | 23.0% | 10.0% | 10.0% |
| Professional Degree | 5.0% | 2.0% | 2.0% |
| Doctorate Degree | 6.0% | 2.0% | 2.0% |
Household Income For Media, Pennsylvania
See the full breakdown
2.0% of households in Media earn Less than $10,000.
1.3% of households in Media earn $10,000 to $14,999.
2.9% of households in Media earn $15,000 to $24,999.
6.5% of households in Media earn $25,000 to $34,999.
7.7% of households in Media earn $35,000 to $49,999.
21.0% of households in Media earn $50,000 to $74,999.
16.6% of households in Media earn $75,000 to $99,999.
18.8% of households in Media earn $100,000 to $149,999.
10.2% of households in Media earn $150,000 to $199,999.
13.0% of households in Media earn $200,000 or more.
| Income | Media | PA | USA |
|---|---|---|---|
| Less than $10,000 | 2.0% | 4.9% | 5.0% |
| $10,000 to $14,999 | 1.3% | 3.5% | 3.4% |
| $15,000 to $24,999 | 2.9% | 6.7% | 6.3% |
| $25,000 to $34,999 | 6.5% | 6.9% | 6.6% |
| $35,000 to $49,999 | 7.7% | 10.5% | 10.1% |
| $50,000 to $74,999 | 21.0% | 15.9% | 15.5% |
| $75,000 to $99,999 | 16.6% | 12.8% | 12.6% |
| $100,000 to $149,999 | 18.8% | 17.7% | 17.5% |
| $150,000 to $199,999 | 10.2% | 9.3% | 9.6% |
| $200,000 or more | 13.0% | 11.8% | 13.4% |
Source: U.S. Census ACS 5-year estimates (2024)


